What is Distributed Tracing and How to implement it with Open Source?
Distributed tracing helps you track requests across services and understand issues affecting your application performance. In distributed cloud architecture, debugging performance issues is complicated. Distributed tracing gives visibility to teams on how a user request performs across different services, protocols, and cloud infrastructure.
Let’s start with a brief overview of distributed tracing.
What is Distributed Tracing?
Distributed tracing is a method to track user requests in their entirety as it travels across components of a distributed system. Cloud and containerization technologies have enabled the creation of distributed system designs like microservices and FaaS (functions as a service).
Distributed tracing enables you to connect the dots of how your distributed system interacts. While traditional monitoring struggles to illuminate the behavior of distributed systems, distributed tracing can help you identify performance patterns of the various components in a distributed system.
In a distributed system, a click from a user initiates a transaction that can travel through hundreds of components before completing the user request. Distributed tracing is the technique that shows how the different components interact together to complete the user request.
The top two important data points that distributed tracing captures about a user request are:
- the time taken to traverse each component in a distributed system
- the sequential flow of the request from its start to the end
Why is Distributed Tracing needed?
In the modern digital ecosystem, a user’s expectation of what’s possible digitally has no limits. It gave rise to the need for rapid innovation and on-demand scaling. Modern application architecture using cloud-native, containerization, and microservices is a very complex distributed system.
The microservices architecture allows multiple technology stacks, decentralized data management, and independent evolution of services in an application. This leads to an ever-increasing number of components in an application’s architecture.
The benefits of microservices architecture come with the increased complexity of operation and troubleshooting. A user request can travel hundreds or even thousands of these components to fulfill a single-use case. As such, there are many failure points in the application, and robust monitoring is needed to identify failure points and latency issues.
But traditional monitoring tools are not adequate to monitor microservices architectures. This is because these tools were designed to monitor a single application instance. The metrics collected from a single instance will not give us insights into how a user request performed as it touches multiple components, but the data collected with distributed tracing can give us those insights.
Understanding a Trace
A trace in distributed tracing represents an end-to-end user request and is composed of single or multiple spans. Spans are fundamental building blocks of a trace, and a trace is composed of a series of tagged time intervals known as spans. It represents a logical unit of work in completing a process in a user request.
The key components and data points that make up a trace are as follows:
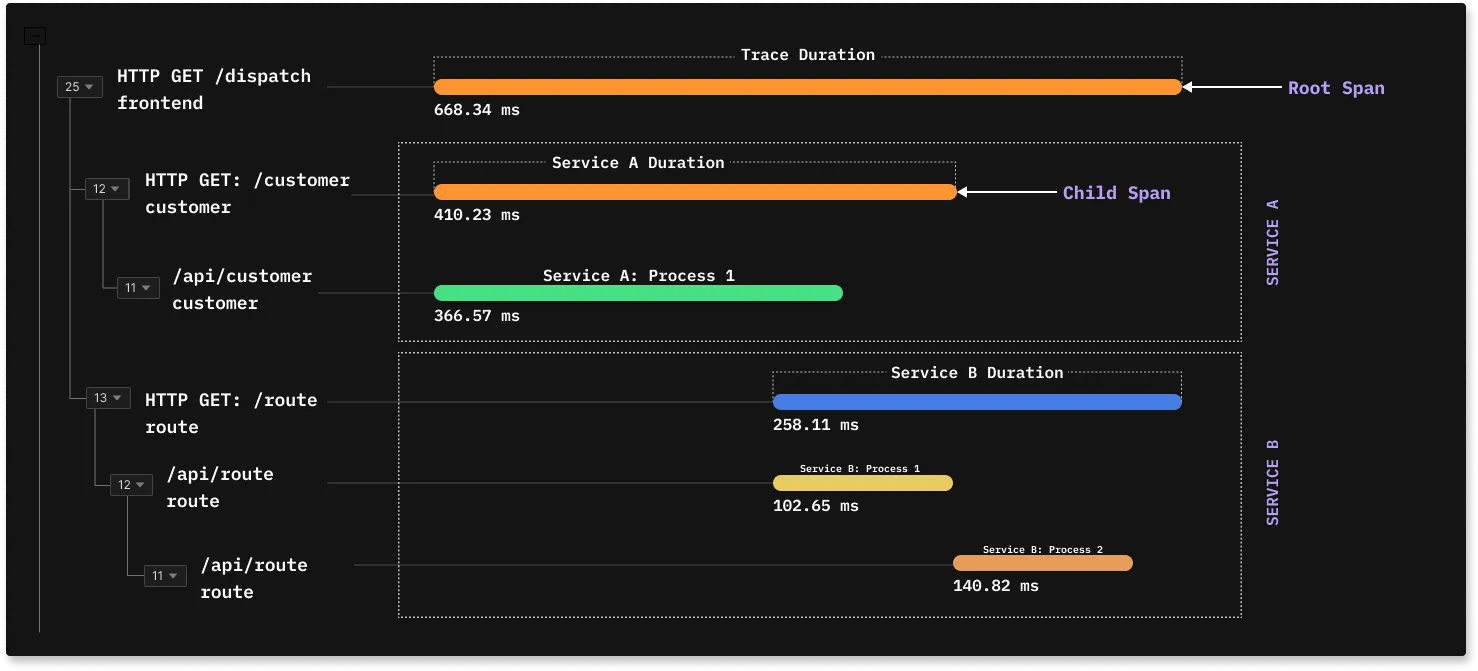
- Root Span
It’s the parent span that represents the first span in a trace. - Child Span
A child span is triggered by a parent span and can be a function call, DB calls, calls to another service, etc. - Duration or Latency
It’s the time taken by each span to complete its process. It’s a key data point used to analyze application performance. - Causal relationship
A trace relates all the spans involved in the request in a sequential relationship.
A trace is usually visualized as Flamegraphs or Gantt charts. Below is a snapshot from the traces dashboard of SigNoz. In the trace diagram below, the root span spawns two child spans which call more inner processes.
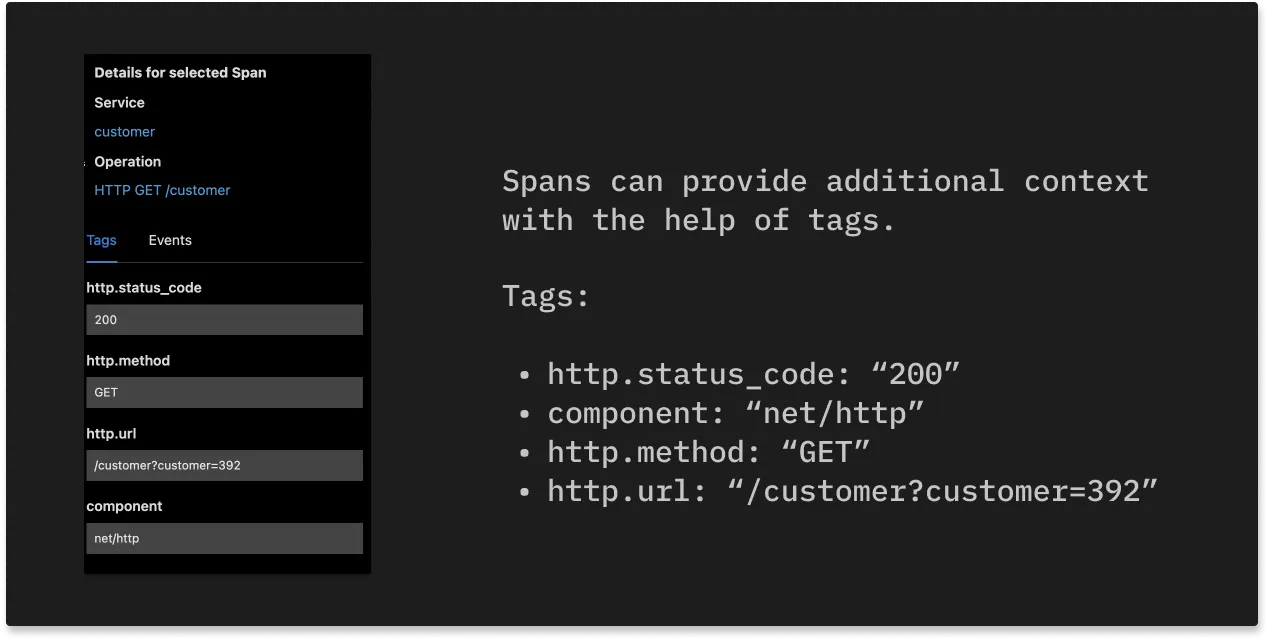
You can also add tags and span attributes to provide more context for your spans. Span attributes are key-value pairs that can be used to provide additional context on a span about the specific operation it tracks.
Deriving value from Distributed Tracing
Distributed tracing gives the much needed visibility into the operations of a complex distributed system. It constructs a picture of how different distributed system components interact to process a user request.
Tracing data can be utilized at two levels:
Single Trace Data
Tracing data can be visualized in the form of Flamegraphs and Gantt Charts to reconstruct the entire flow of a specific user request. This enables us to understand exactly what happened to that request in a particular component of the distributed system.
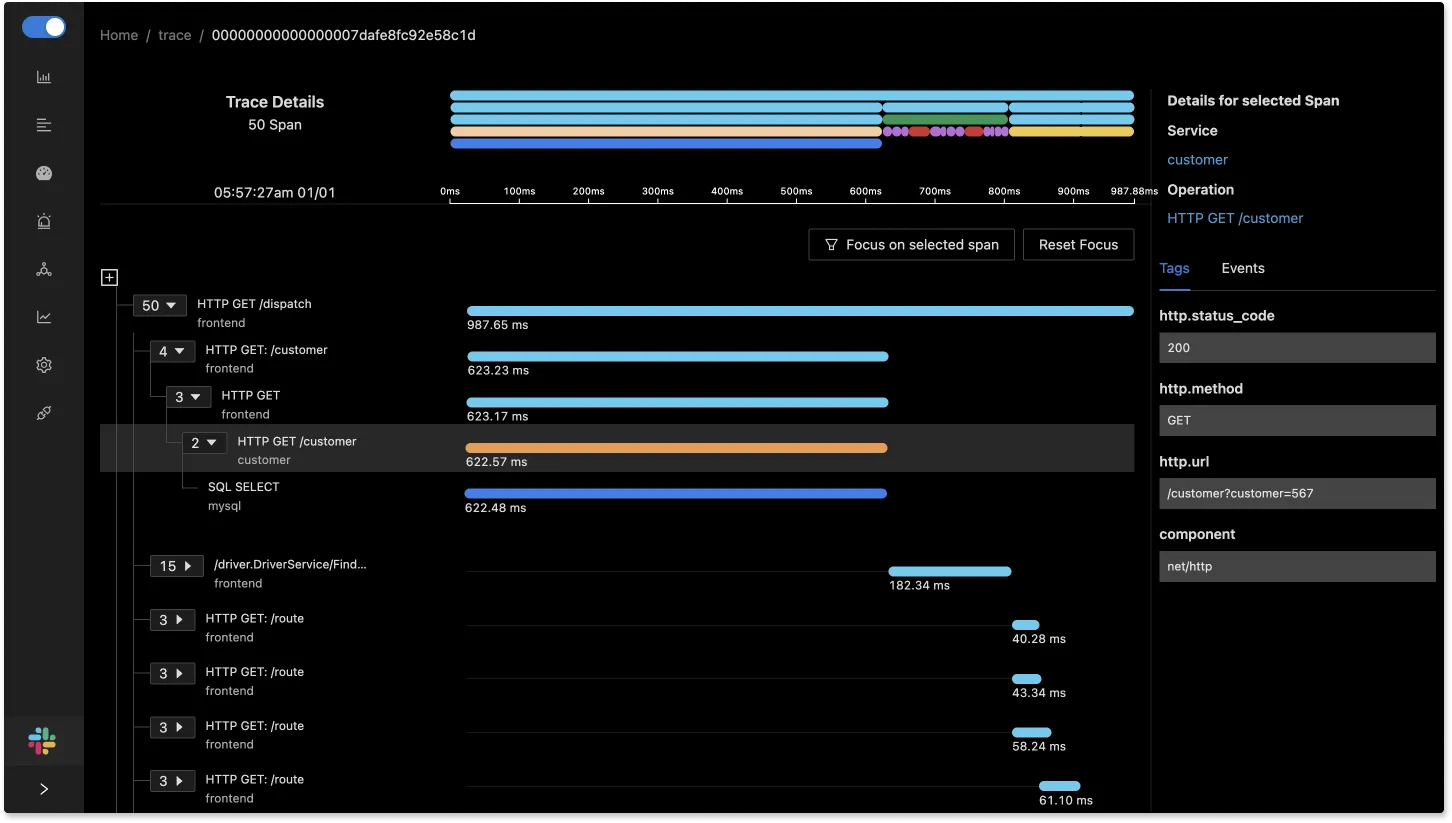
SigNoz shows Flamegraphs and Gantt charts both to make visualizing trace data easier. In the dashboard below, you can see the data for a single trace that consists of 50 spans.
Aggregated Trace Data
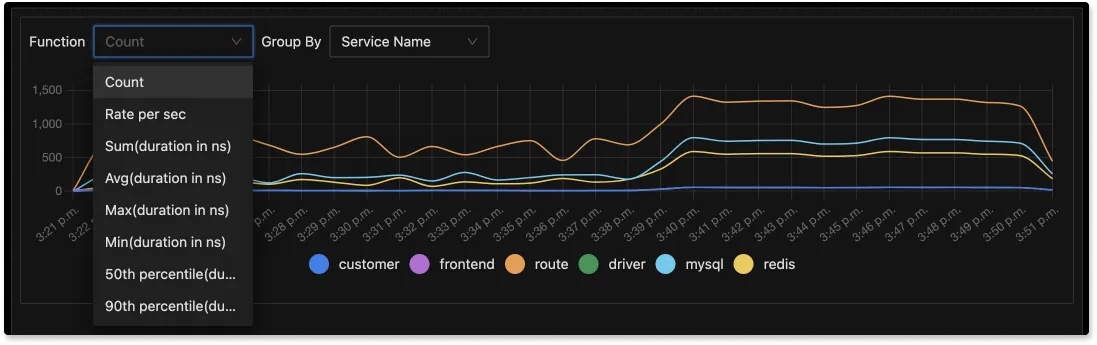
Using tags and tracing data, you can run aggregates to get relevant business metrics from the behavior of your distributed systems. For example, with SigNoz, you can get the error rate and 99th percentile latency of customer_type: gold or deployment_version: v2. This enables quick analysis of services affecting a particular user group or type of requests.
Distributed tracing can also serve as a knowledge base for your engineering team. It can act as a central overview dashboard that enables anyone to quickly get familiar with the application architecture.
Distributed Tracing with OpenTelemetry
OpenTelemetry is an open-source project under CNCF(Cloud Native Computing Foundation) that aims to standardize the process of creation and management of telemetry data like logs, metrics, and traces. Other notable projects under CNCF are Kubernetes, Helm, and etcd.OpenTelemetry is used to instrument application code to generate telemetry data. Instrumentation is the process of enabling your application code to emit telemetry data. For example, you can use OpenTelemetry Java agent to instrument your Spring Boot applications to send out telemetry data automatically.
The question is why is OpenTelemetry important for the future of distributed tracing. The reasons can be summarized in the following points:
Eliminates the risk of vendor lock-in
SaaS tools that provide distributed tracing capabilities have their own agents to instrument applications. Whereas OpenTelemetry supports various popular data formats with the help of an exporter. The data collected with OpenTelemetry can be sent to a backend of your choice.Standard instrumentation across your distributed system
OpenTelemetry covers all major frameworks, protocols, and programming languages. It also comes with a collector that can be used to collect and export data. It enables OpenTelemetry to be the single source of instrumentation across your entire distributed system.Open-source and community-backed
A huge community is working on OpenTelemetry to make it the standard way of collecting and sending telemetry data to a backend platform. It is also supported by all the major cloud vendors.Ability to monitor emerging technologies
OpenTelemetry has a wide number of libraries and SDKs for instrumenting code in various programming languages. If you decide to use any new technology, OpenTelemetry can readily be used to instrument it, and you don’t have to depend on propriety monitoring tools to extend that capability.
Getting started with Open Source Distributed Tracing
SigNoz is an open-source APM tool that provides distributed tracing as one of its main capabilities. It is built to natively support OpenTelemetry so that you can build your entire monitoring stack with open source tools.
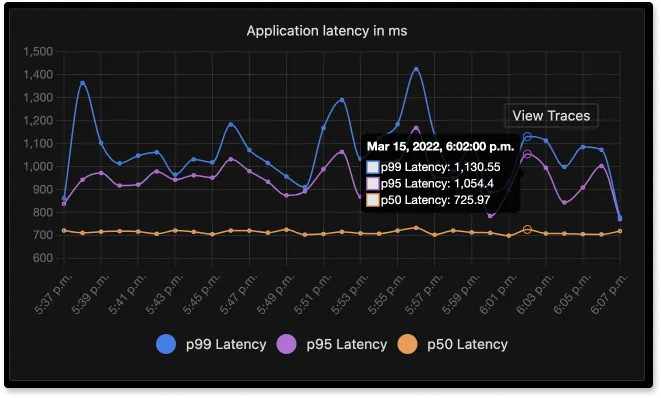
It provides both metrics monitoring and distributed tracing with an ability to correlate metrics and traces seamlessly.
For example, you can view traces at a particular timestamp where metrics like application latency are poor, and then you can dig deeper with traces generated around that timestamp.
SigNoz comes with out of box visualizations for your tracing data. The Traces dashboard of SigNoz provides you with powerful filters that can be used to analyze your tracing data.
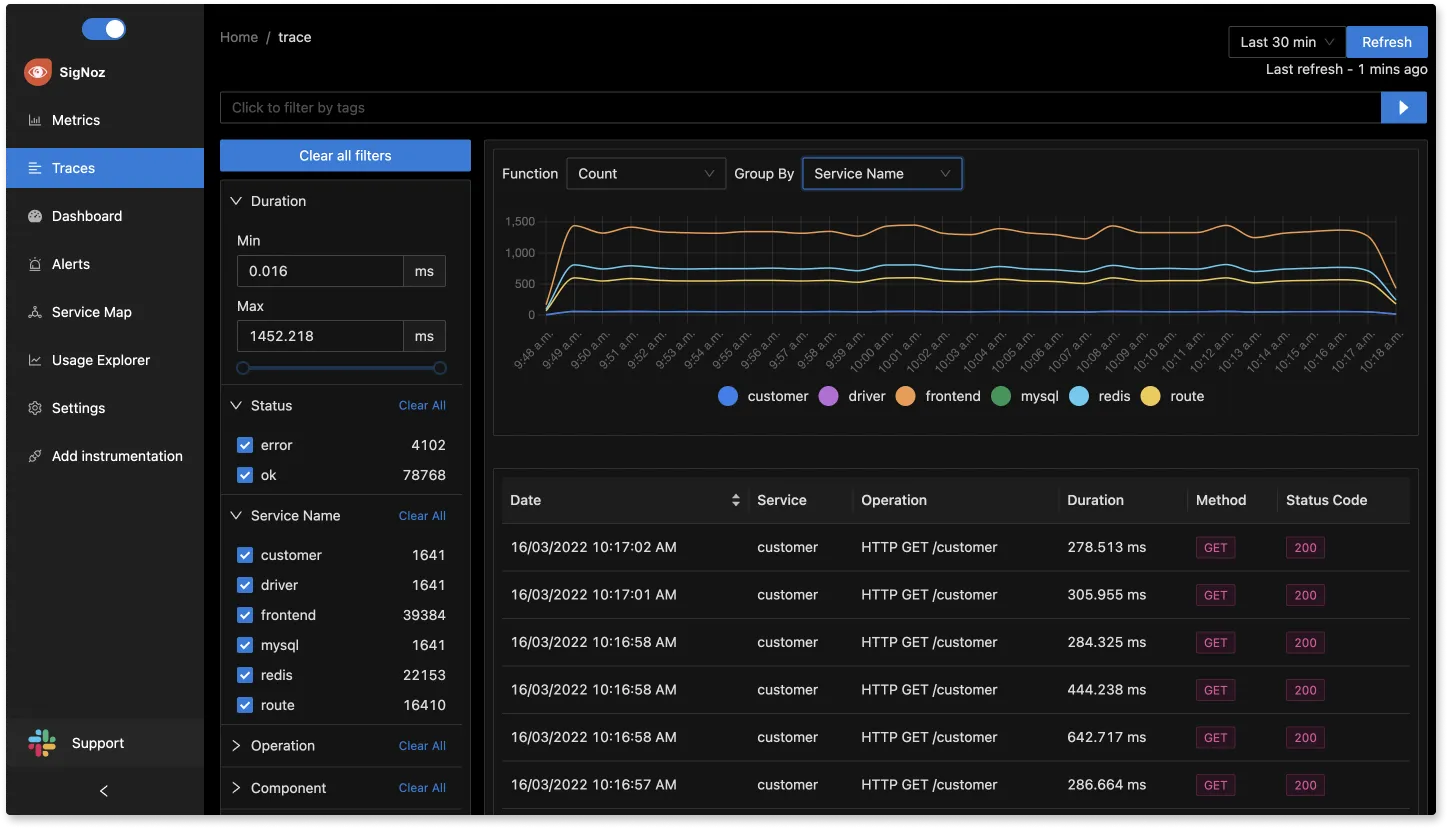
You can see all the spans based on selected filters and the chosen time period. And you can also visualize how a particular span performed as part of an entire user request with Flamegraphs and Gantt Charts.
SigNoz can be installed on macOS or Linux computers in just three steps by using a simple install script.
The install script automatically installs Docker Engine on Linux. However, on macOS, you must manually install Docker Engine before running the install script.
git clone -b main https://github.com/SigNoz/signoz.git
cd signoz/deploy/
./install.sh
You can visit our documentation for instructions on how to install SigNoz using Docker Swarm and Helm Charts.

Further Reading
Examples of Distributed Tracing
Implementing Distributed Tracing in a Java application
Implementing Distributed Tracing in a Nodejs application