What is N+1 query problem and how distributed tracing solves it?
N+1 query problem is a problem in database retrieval where the related entities of an object are queried individually from a database, leading to O(n) queries where n is the number of related entities of the object.
Mouthful of words, I agree 🙂
Let’s take an example to illustrate what it means.
What is N+1 query problem?
Let's say you have a collection of team objects (database rows), and each team
has a collection of members objects (also rows). In other words, team → members
is a 1-to-many relationship.
Now, let's say you need to iterate through all the teams, and for each one, print out a list of the members. The naive O/R implementation would do the following:
find all the teams
SELECT * from teams WHERE …
then for each team, find their members
SELECT * from members where teamID = x
If there are N teams, you can see why this would lead to N+1 database queries.
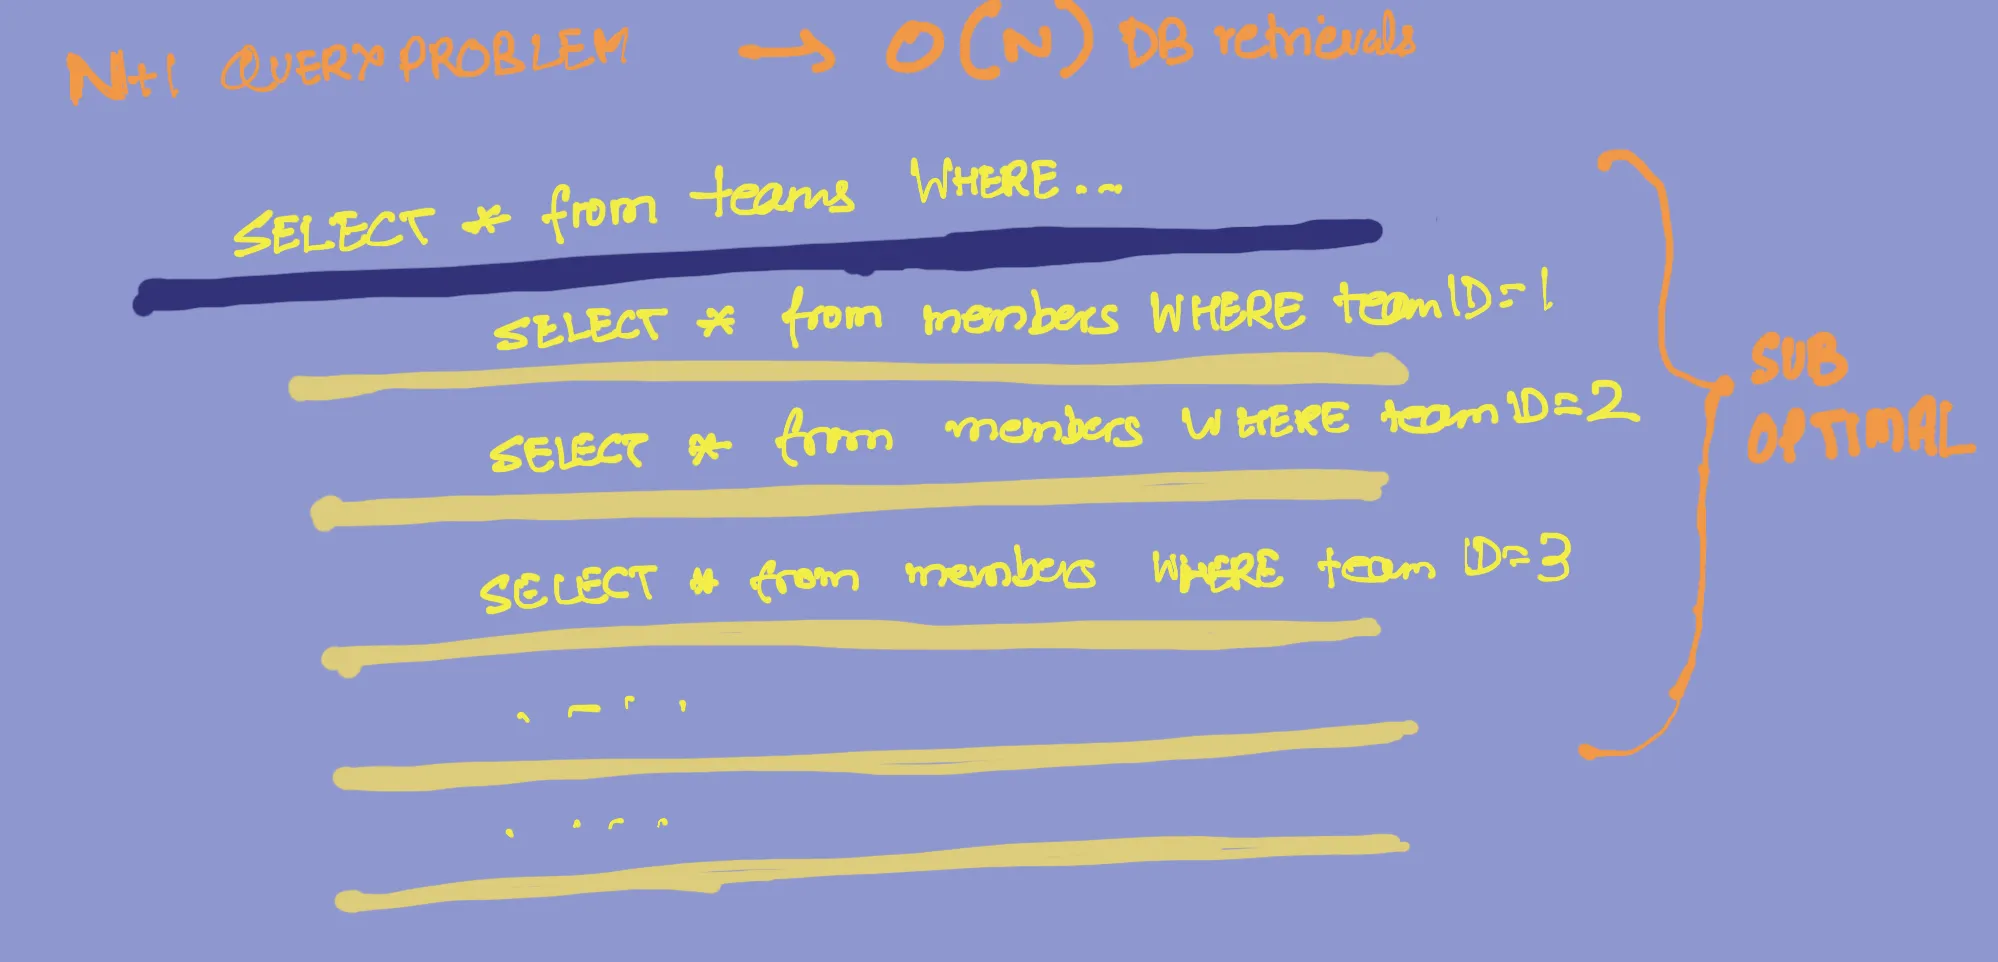
Playing it out, this would issue queries like
SELECT * from teams WHERE …

SELECT * from members where teamID = 1

SELECT * from members where teamID = 2

SELECT * from members where teamID = 3

SELECT * from members where teamID = 4

…
This is sub-optimal.
The problem with this is that each query has quite a bit of overhead. It is much faster to issue 1 query, which returns 1000 results, than to issue 1000 queries which return 1 result each.
This is particularly true if your database is on a different machine that is, say, 3-4 ms away on the network. In this case, issuing 1000 queries serially has a minimum cost of 3000-4000ms, even if they can be satisfied instantly by MySQL.
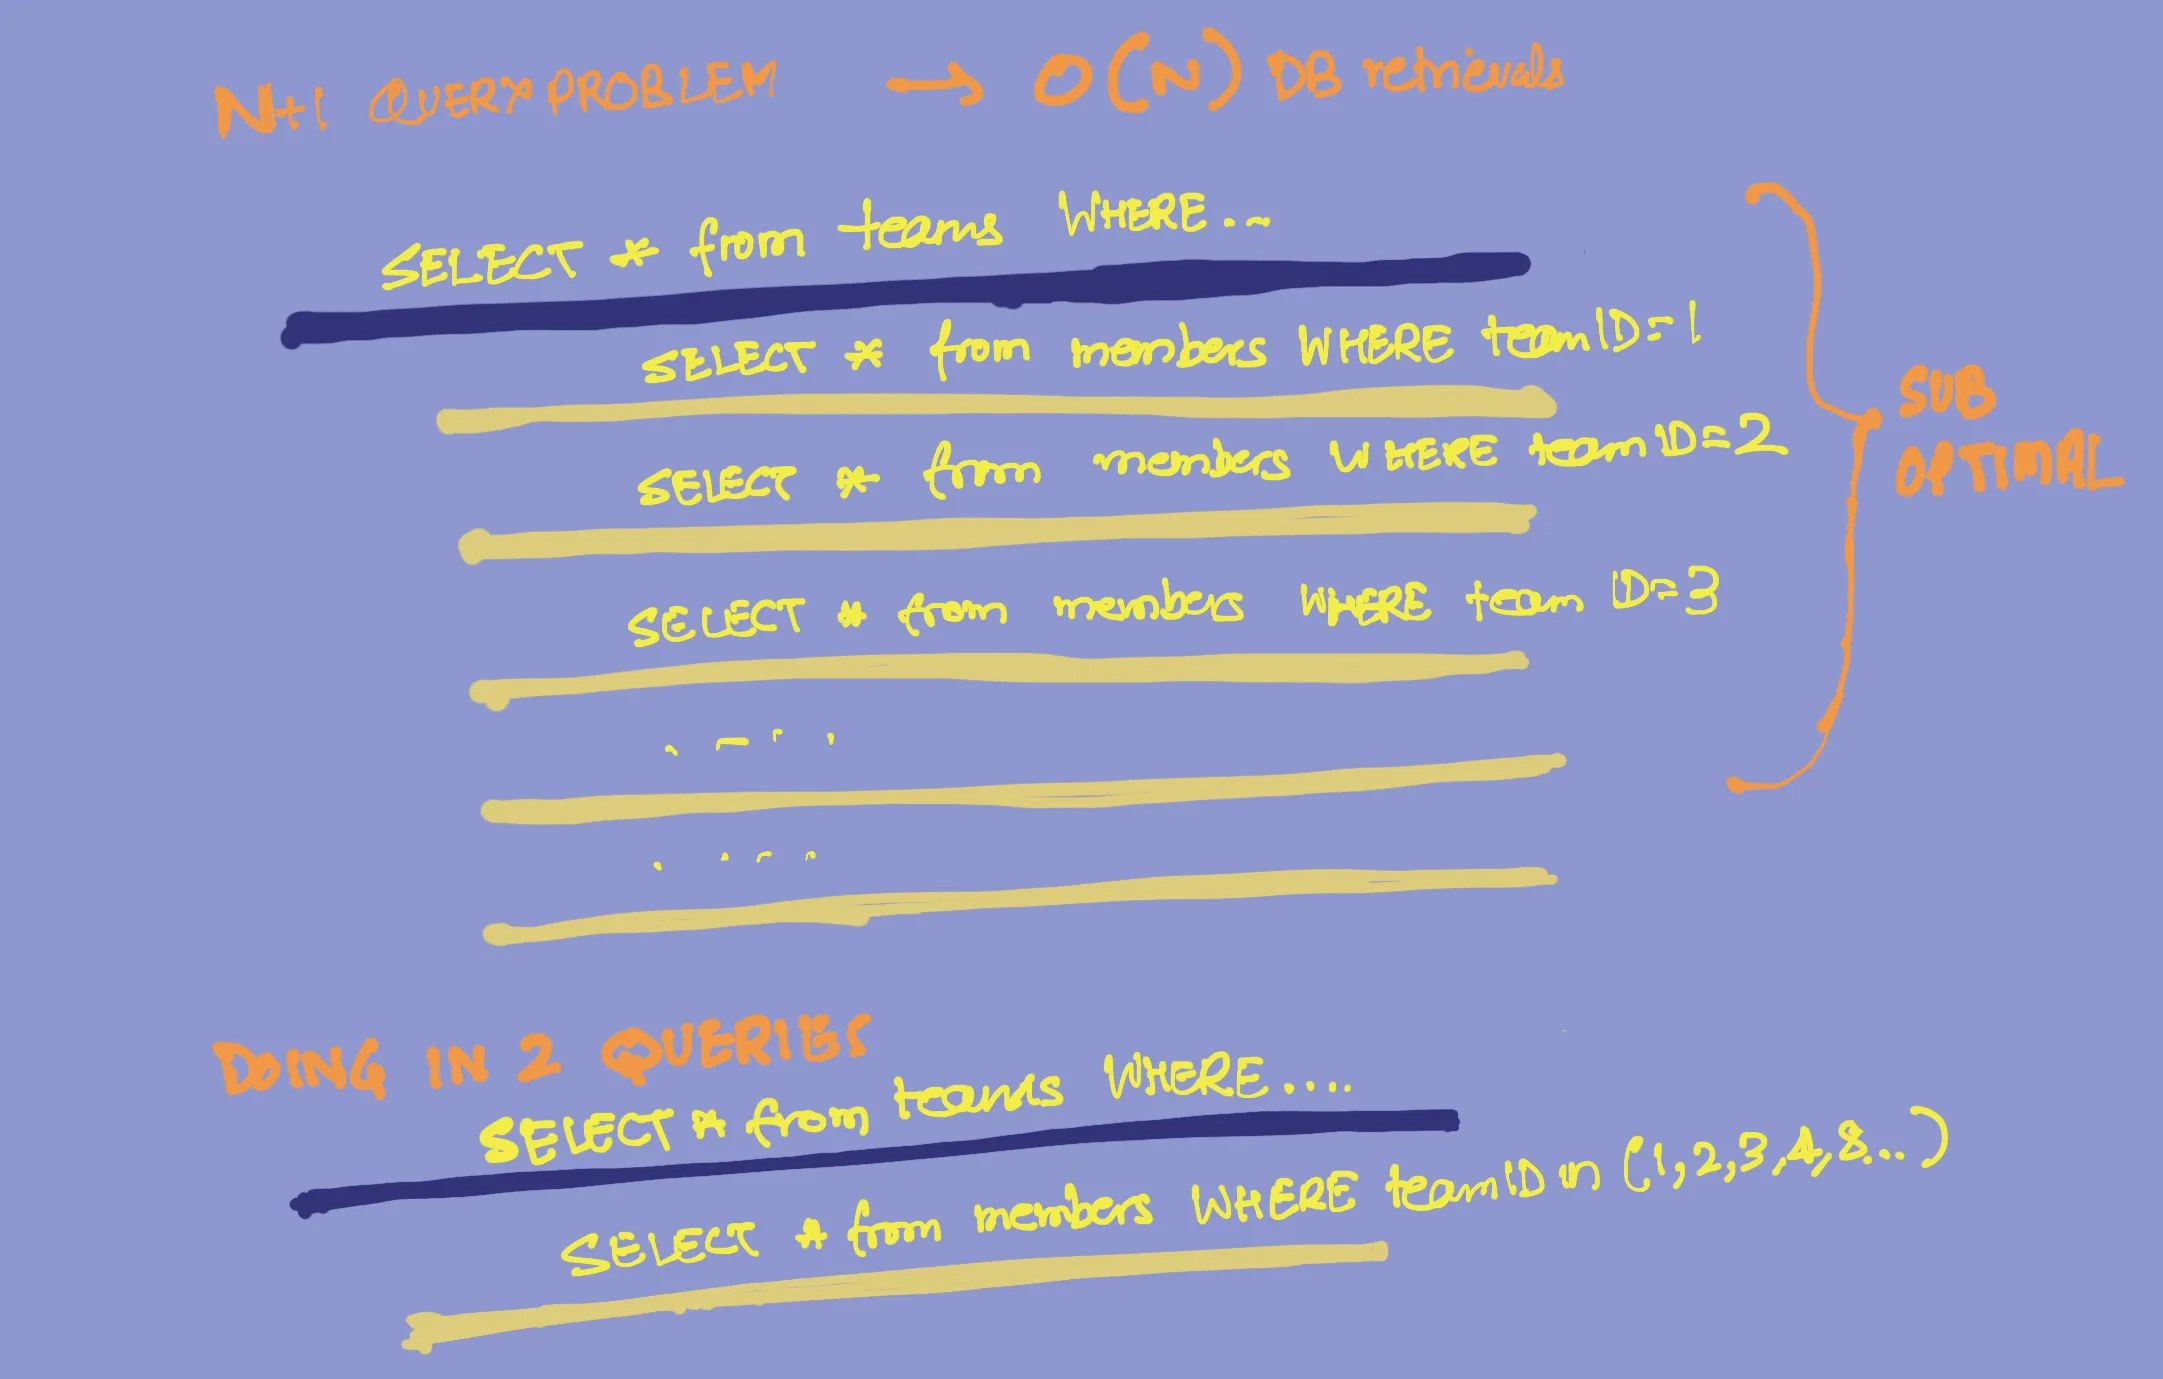
This can easily be solved by batching queries
SELECT * FROM teams WHERE ...
SELECT * FROM members WHERE teamID IN (1, 2, 3, 4, 5, ...)
As you can see, this only takes 2 queries to retrieve the required details, no matter how many teams you want to find members for.
You've removed the "N" part from the page's query plan and are no longer paying the overhead of issuing hundreds of extra queries.

How to prevent such performance anti-patterns creeping in your code
Well, a simple way is to have good code review practices and good engineers in your team who can catch such issues in the review phase itself.
But sometimes, developers use ORM to do DB queries which abstracts things to provide a common interface for multiple databases. Such unoptimised queries can be due to bad ORM implementations
And let’s face it, many teams don’t spend too much time in code reviews to detect performance anti-patterns that are not apparent in the first go.
So, what do you do?
This is where distributed tracing comes in handy.
What is Distributed tracing & how can it be helpful?
For those who have not heard about it, distributed tracing is a method to track user requests in their entirety as it travels across components of a distributed system. You can check more details about it here.
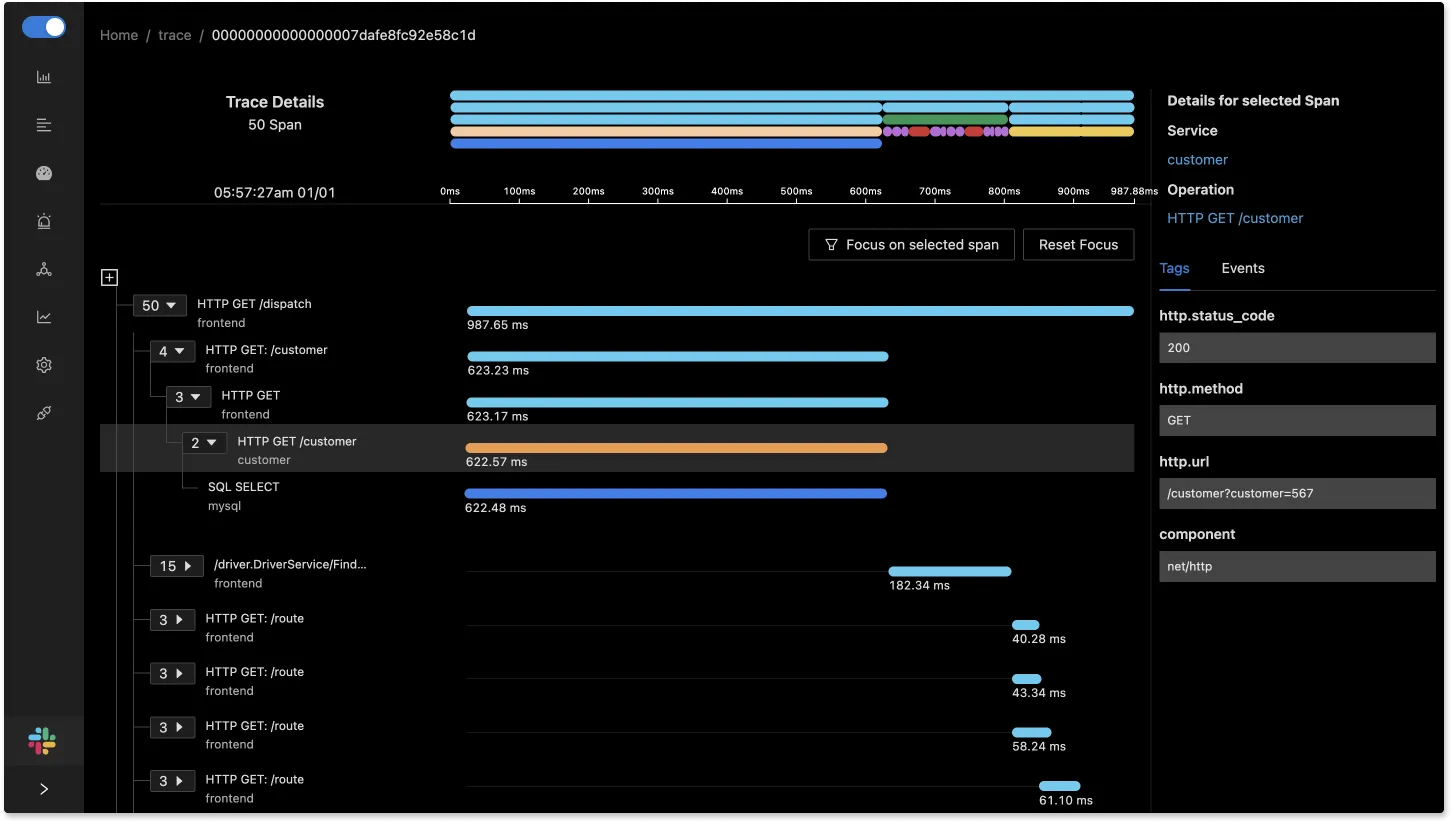
So, if you have distributed tracing implemented in your services and there are traces that are taking a long time, you can filter based on that and try seeing the calling patterns of these requests which are taking a lot of time.
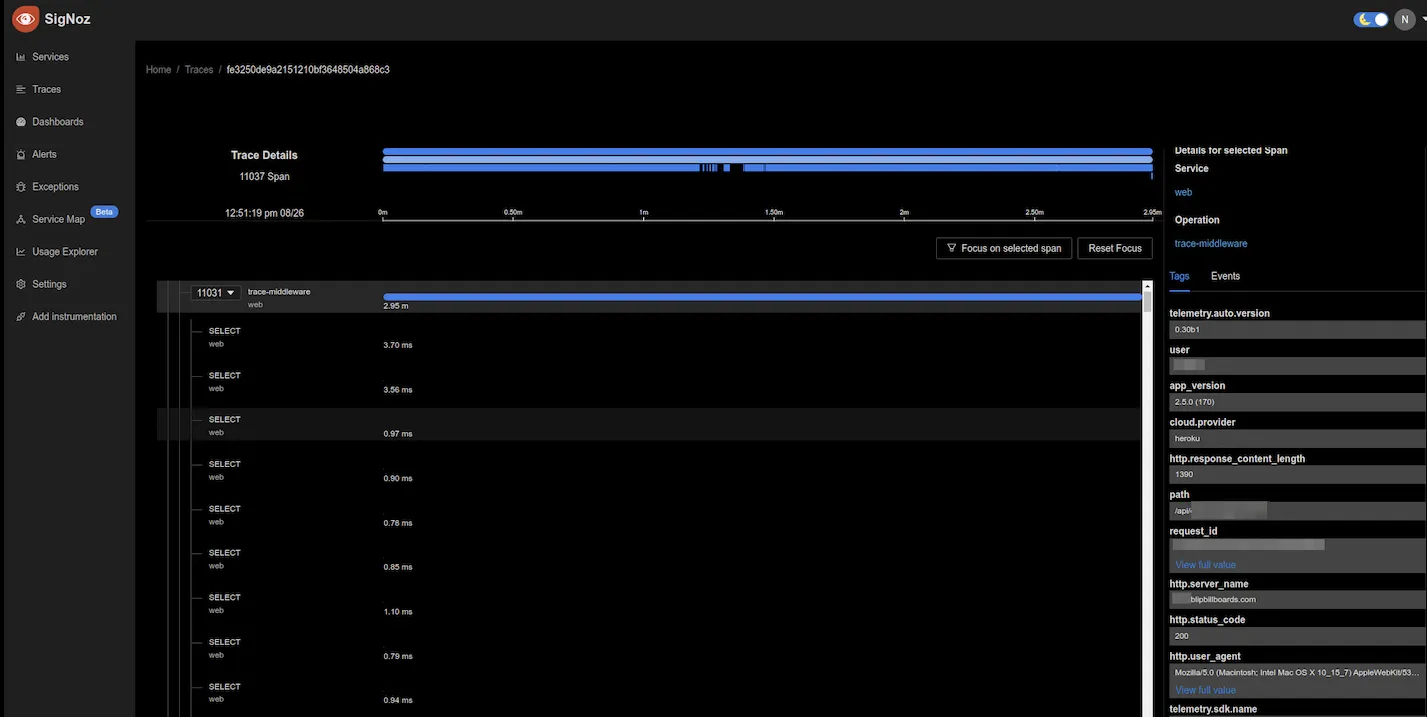
Once you see a pattern like the above, where a single request is fanning out multiple database requests, you know there is an issue of N+1 queries. You can head into your codebase and try to figure out where this is in originating from. As you can see in the above screenshot, a single request leads to 11000+ database calls which is a case of N+1 queries being made.
Why just logs may not be able to help you identify such issues
You may ask, can’t logs help me solve this? If I log each database call 🤔
Well, not really. What is essential, as you can see, is to get the structure of the calling patterns. Only when you see that a request is leading to multiple child spans, which are select queries on DB, can you confidently say that this is a case of N+1 query. It would be best if you had this hierarchical visualisation to pinpoint this.
Logs may give you details about each DB call, but they don’t have the exact hierarchical call sequence. This is one of the most remarkable things about distributed tracing and why you may want to take a look at it.
To share an example, one of users of SigNoz recently shared with us that they could detect such N+1 query issues in their code which led to reducing execution time for specific APIs from 180s to 2s.
A 90x improvement in performance 🤯
If you are thinking of trying out distributed tracing and finding such issues, check out our Github repo

Further Reading
