SigNoz - Logs Performance Benchmark


Logs are an integral part of any system that helps you get information about the application state and how it handles its operations. The goal of this blog is to compare the commonly used logging solutions, i.e., ElasticSearch (ELK stack) and Loki (PLG stack), with SigNoz on three parameters: ingestion, query, and storage.
Though the performance benchmarks in our tests represent a very specific scenario and use cases, our results seem to directionally agree with what other observability teams have reported, especially wrt. Elastic stack.
Many big companies like Uber and Cloudflare have been shifting to ClickHouse as their main workhorse for Logs management seeing much better performance. for e.g Cloudflare recently shifted from Elastic to ClickHouse and are seeing 8x improvement in memory/cpu resource requirement in ingestion.
Performance benchmarks are not easy to execute. Each tool has nuances, and the testing environments must aim to provide a level playing field for all tools. We have tried our best to be transparent about the setup and configurations used in this performance benchmark. We are open to receiving feedback from the community on what can be done better. Please feel free to create issues in the following repo.

We will go through how we have created the environment for benchmarking the different solutions and compare the results that can help you choose a tool based on your logging requirements. But before that, let’s give you a brief overview of the key findings.
Benchmark Key Findings: A summary
For any log management tool to be efficient, the following three factors are very important.
Ingestion
Distributed cloud-native applications can generate logs at a humungous scale. Log management tools should be efficient at ingesting log data at scale.Query
Logs help in troubleshooting, and troubleshooting should be fast. The end-user experience depends on how fast a user can query relevant logs.Storage
Storage is costly and logs data is often huge. Log management tools need to be efficient in storing logs.
Findings
- For ingestion, we found SigNoz to be 2.5x faster than ELK and consumed 50% less resources.
- For querying benchmarks, we tested out different types of commonly used queries. While ELK was better at performing queries like COUNT, SigNoz is 13x faster than ELK for aggregate queries.
- Storage used by SigNoz for the same amount of logs is about half of what ELK uses.
- Loki doesn’t perform well if you want to index and query high cardinality data. In our setup for Loki we were not able to push it to ingest high cardinality labels/indexes.
We saw Loki team has recently shared some improvements in querying speed, but this benchmark is not updated based on this update and we have not verified if it would help in high cardinality data. If anyone in the community has been able to get good performance for high cardinality data, we would love to learn more.
Benchmark Methodology and Setup
For the comparison, we have only considered self-hosted tools. We compared SigNoz with ELK(Elasticsearch, Loki and Kibana) stack and PLG(Promtail, Loki, and Grafana) stack.
Flog - Log Generator
For generating logs, we will be using flog. flog is a fake log generator for common log formats such as apache-common, apache-error, and RFC3164 syslog. We have tweaked this tool to add extra fields like traceId and spanId along with a dummyBytes field through which we were able to generate logs where each log size is greater than 1.5 KB and less than 2.0 KB.
Here is a sample log generated by flog:
{
  "host": "6.127.39.239",
  "user-identifier": "wisoky5015",
  "datetime": "09/Nov/2022:04:48:14 +0000",
  "method": "HEAD",
  "request": "/revolutionary/roi",
  "protocol": "HTTP/2.0",
  "status": 501,
  "bytes": 11466,
  "referer": "http://www.seniorrevolutionize.name/intuitive/matrix/24/7",
  "traceId": "3aee4c94836ffe064b37f054dc0e1c50",
  "spanId": "4b37f054dc0e1c50",
  "dummyBytes": "kingship grumble swearer hording wiggling dipper execution's crock's clobbers Spaniard's priestess's organises Harrods's Josef's Wilma meditating movable's photographers polestars pectorals Coventries rehearsal Arkhangelsk's Kasai barometer junkier Osgood's impassively illogical cardsharp's underbrush shorter patronymics plagiarises gargle's Chandra intransigent deathtrap extraneously hairless inferred glads frail polka jeez ohm bigoted sari's cannonades vestibule's pursuer vanity ceremony Kodaly's swaths disturbance's belt Samoan's invulnerability dumping Alfreda padded corrosive universal dishwasher's multiplier decisive selloff eastbound moods Konrad's appositive's reset's ingenuously checkup's overselling evens Darrin's supernumerary liberalism productivity's legrooms Lorenzo including Robbin savourier foxglove's buckshot businesswomen abalones tare Chaitin Stephenson's inpatients distinction cryings aspic empire's healed perspiring"
}
Deployment Details
For deployment and benchmarking, we have used four VMs. Three of the VMs are used for generating logs, and one will be used for deploying the logging solution where logs will be ingested and queried.
The three VMs for generating logs is c6a.2xlarge EC2 instance with 8vCPU, 16GB of RAM, and network bandwidth of up to 12.5 Gbps. While the VM used for deploying the logging solution is a c6a.4xlarge EC2 instance with 16vCPU, 32GB of RAM, and network bandwidth up to 12.5 Gbps.
All the configurations used for performing the benchmark can be found in the SigNoz Logs benchmark repo.
Preparing SigNoz
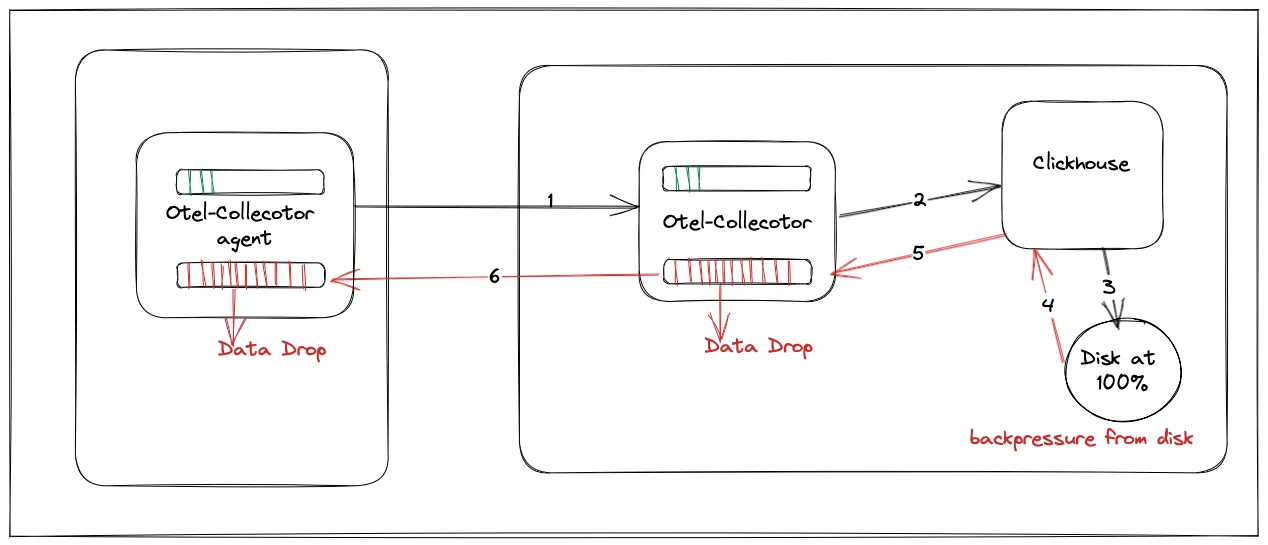
SigNoz cluster architecture for the performance benchmark looks as the following:
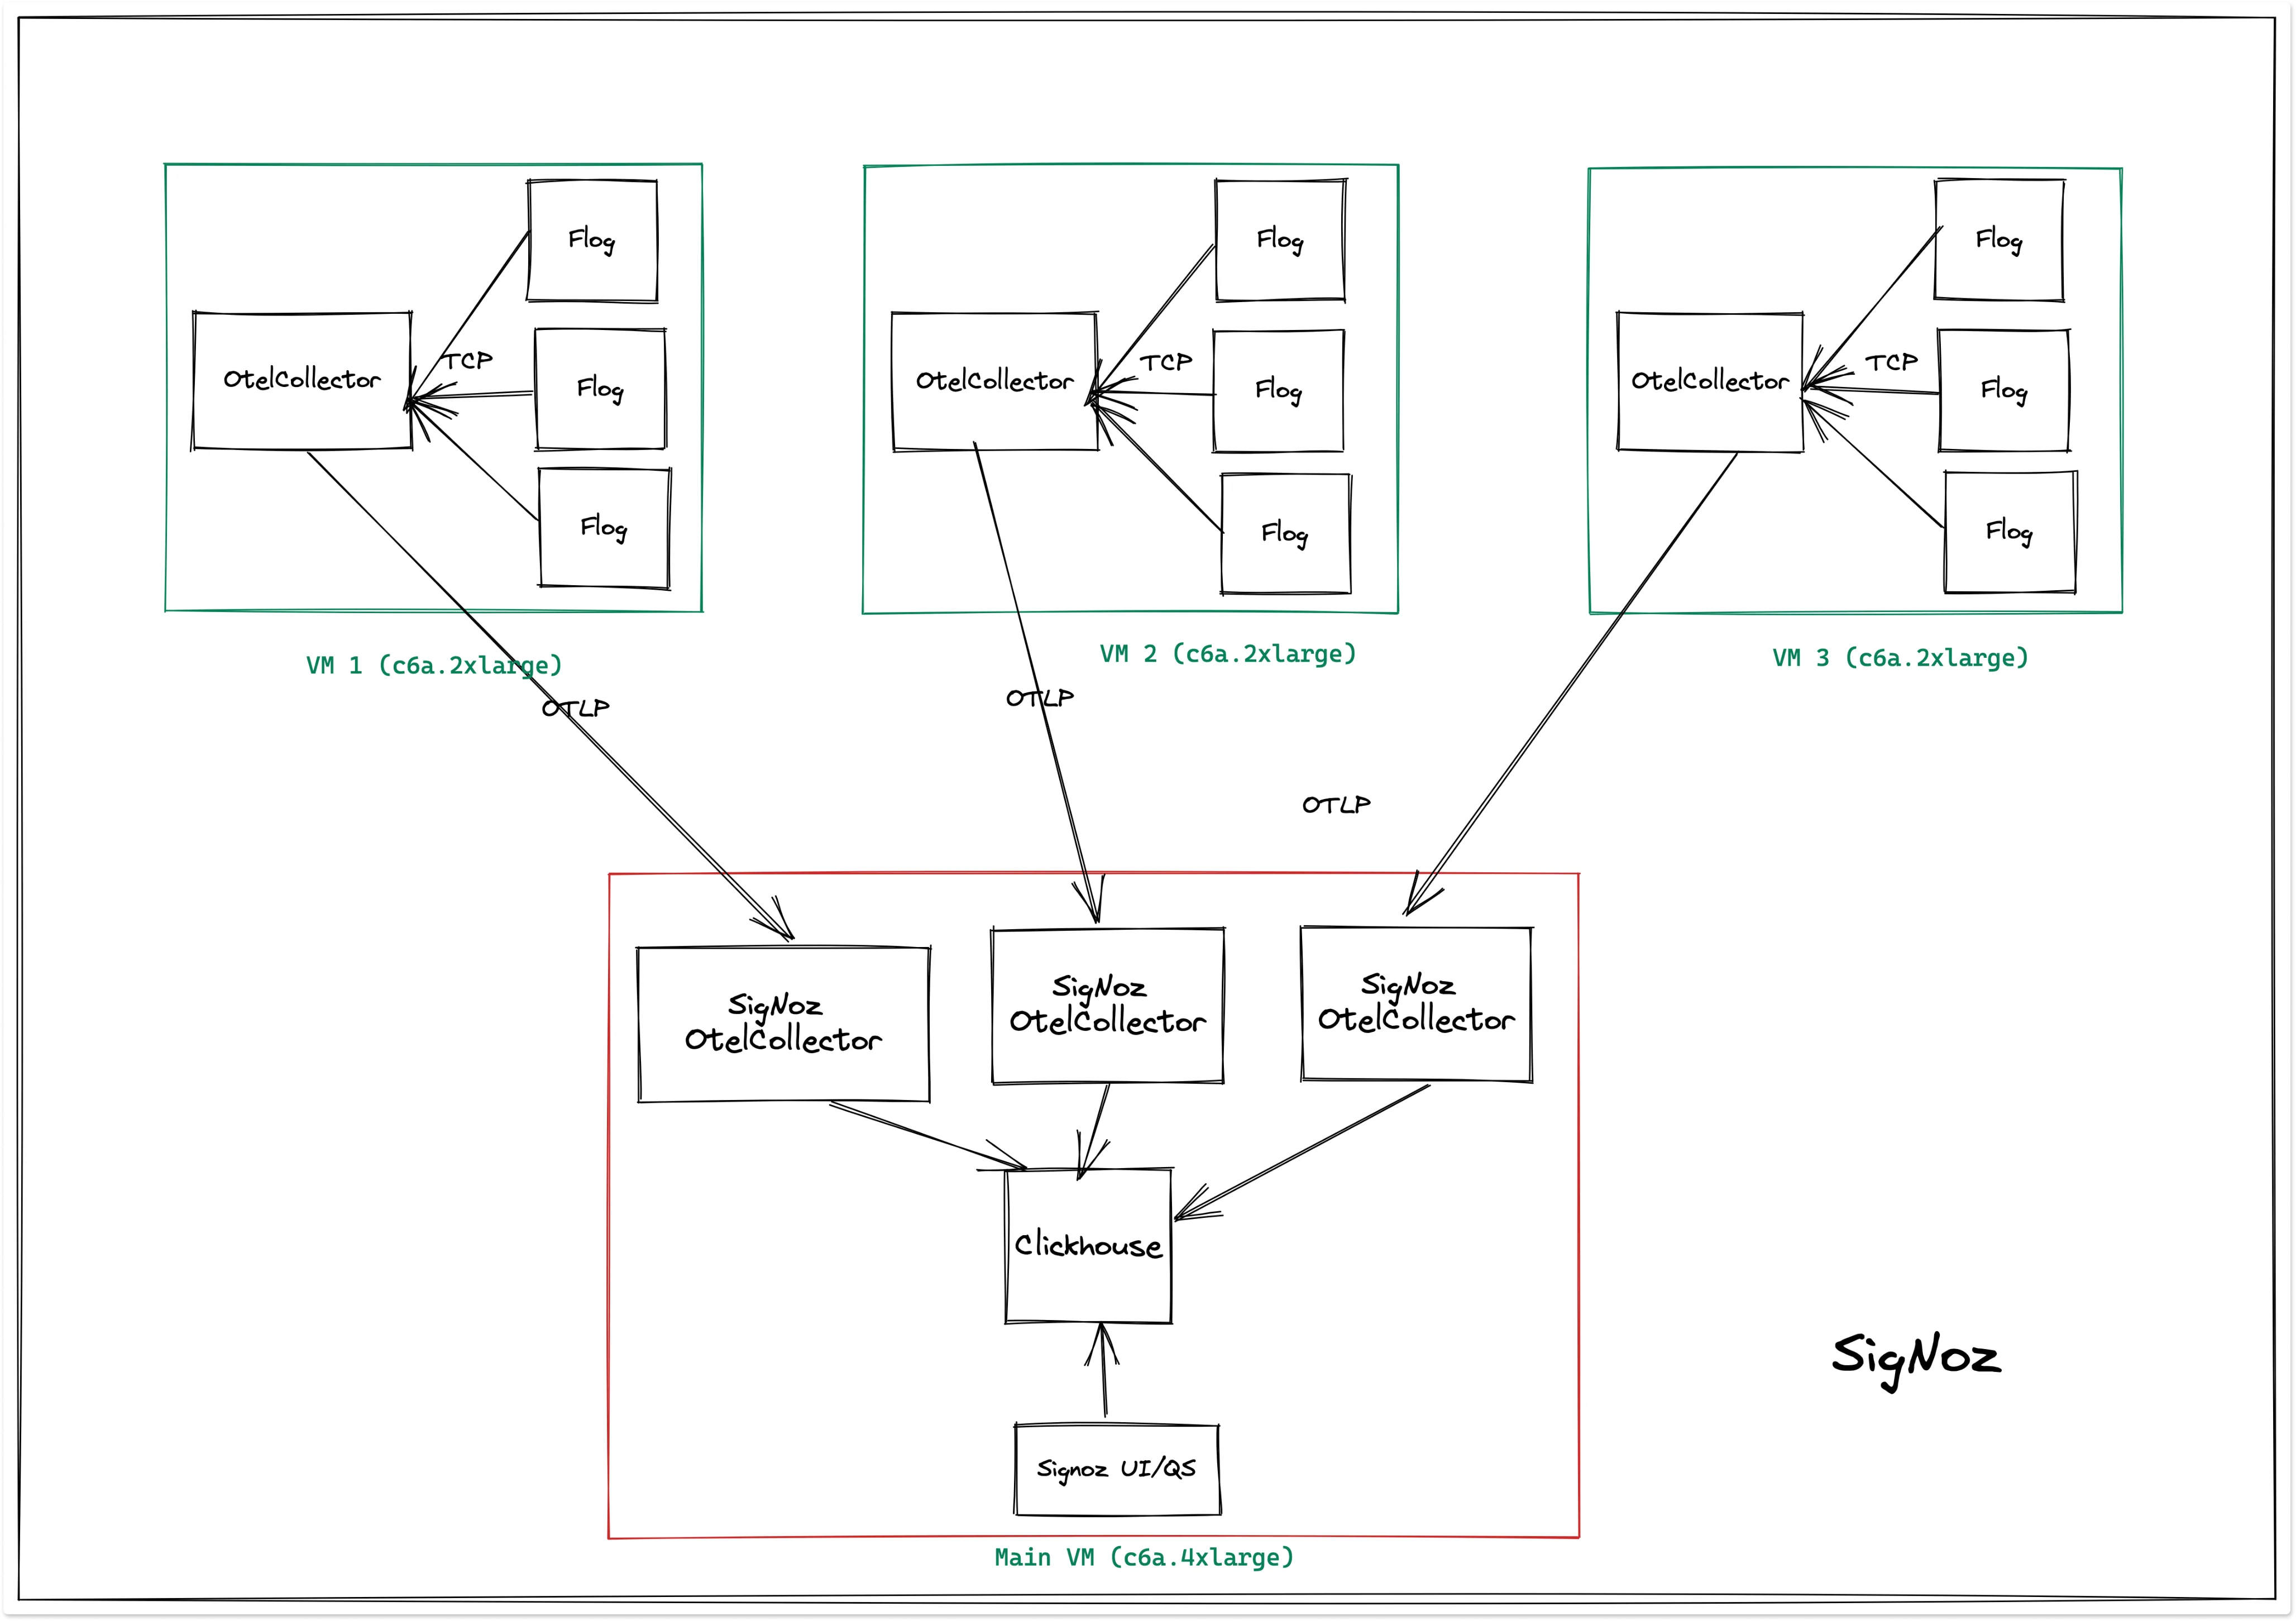
The three VMs are generating logs and sending it to signoz-otel-collector using OTLP. The reason we are using OTEL collectors on the receiver side instead of directly writing to ClickHouse from the generator VMs is that the OTEL collectors running in the generator VM's may or may not be the distribution from SigNoz.
In our otel collector configuration, we have extracted all fields, and we have converted all the fields from interesting fields to selected fields in the UI, which means they all are indexed.
Preparing Elasticsearch
For this benchmark, we used Elastic version 8.4.3 and Logstash version 8.4.3
Elasticsearch cluster architecture for the performance benchmark looks as the following:
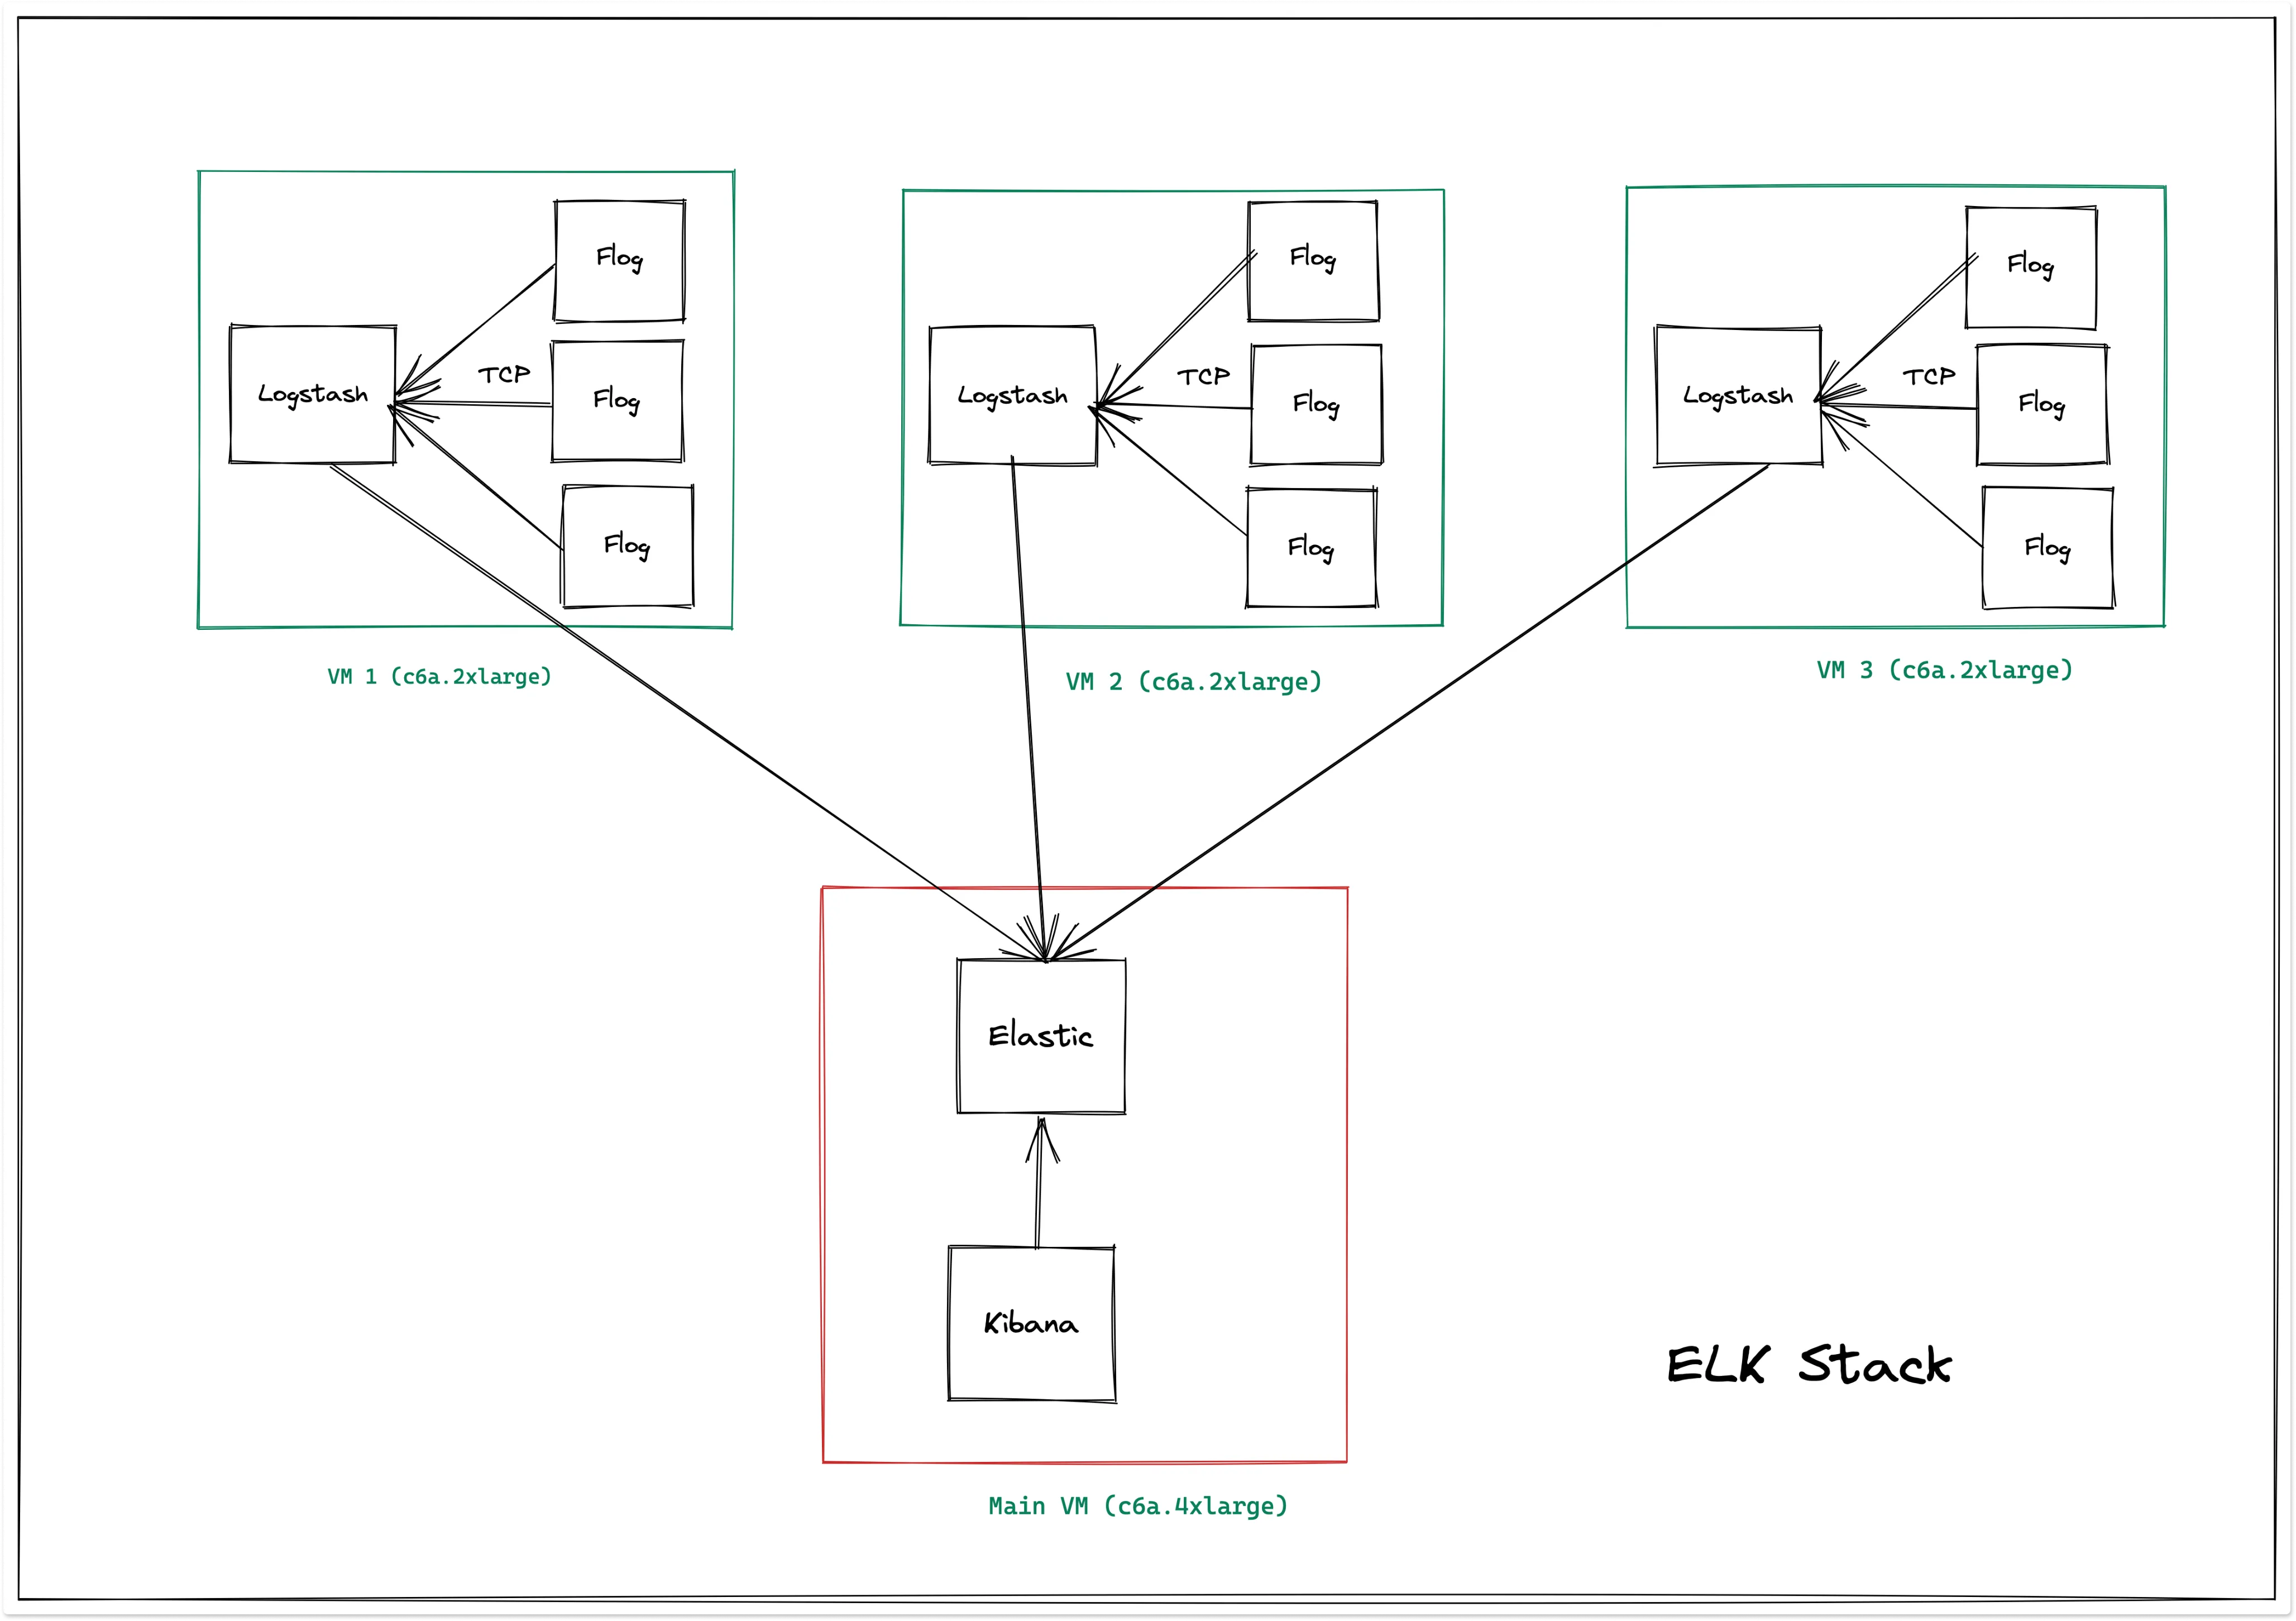
In the three generators’ virtual machines, the logs are generated using flog, and these logs are sent to Logstash in each of the VMs using TCP protocol. The Logstash agent in each virtual machine is writing the data to Elasticsearch deployed in the host VM. Here, Elasticsearch uses a dynamic indexing template to index all the fields in the logs.
Preparing Loki
For this benchmark, we used Loki version 2.6.1 and Promtail version 2.6.1
Loki cluster architecture for the performance benchmark looks as the following:
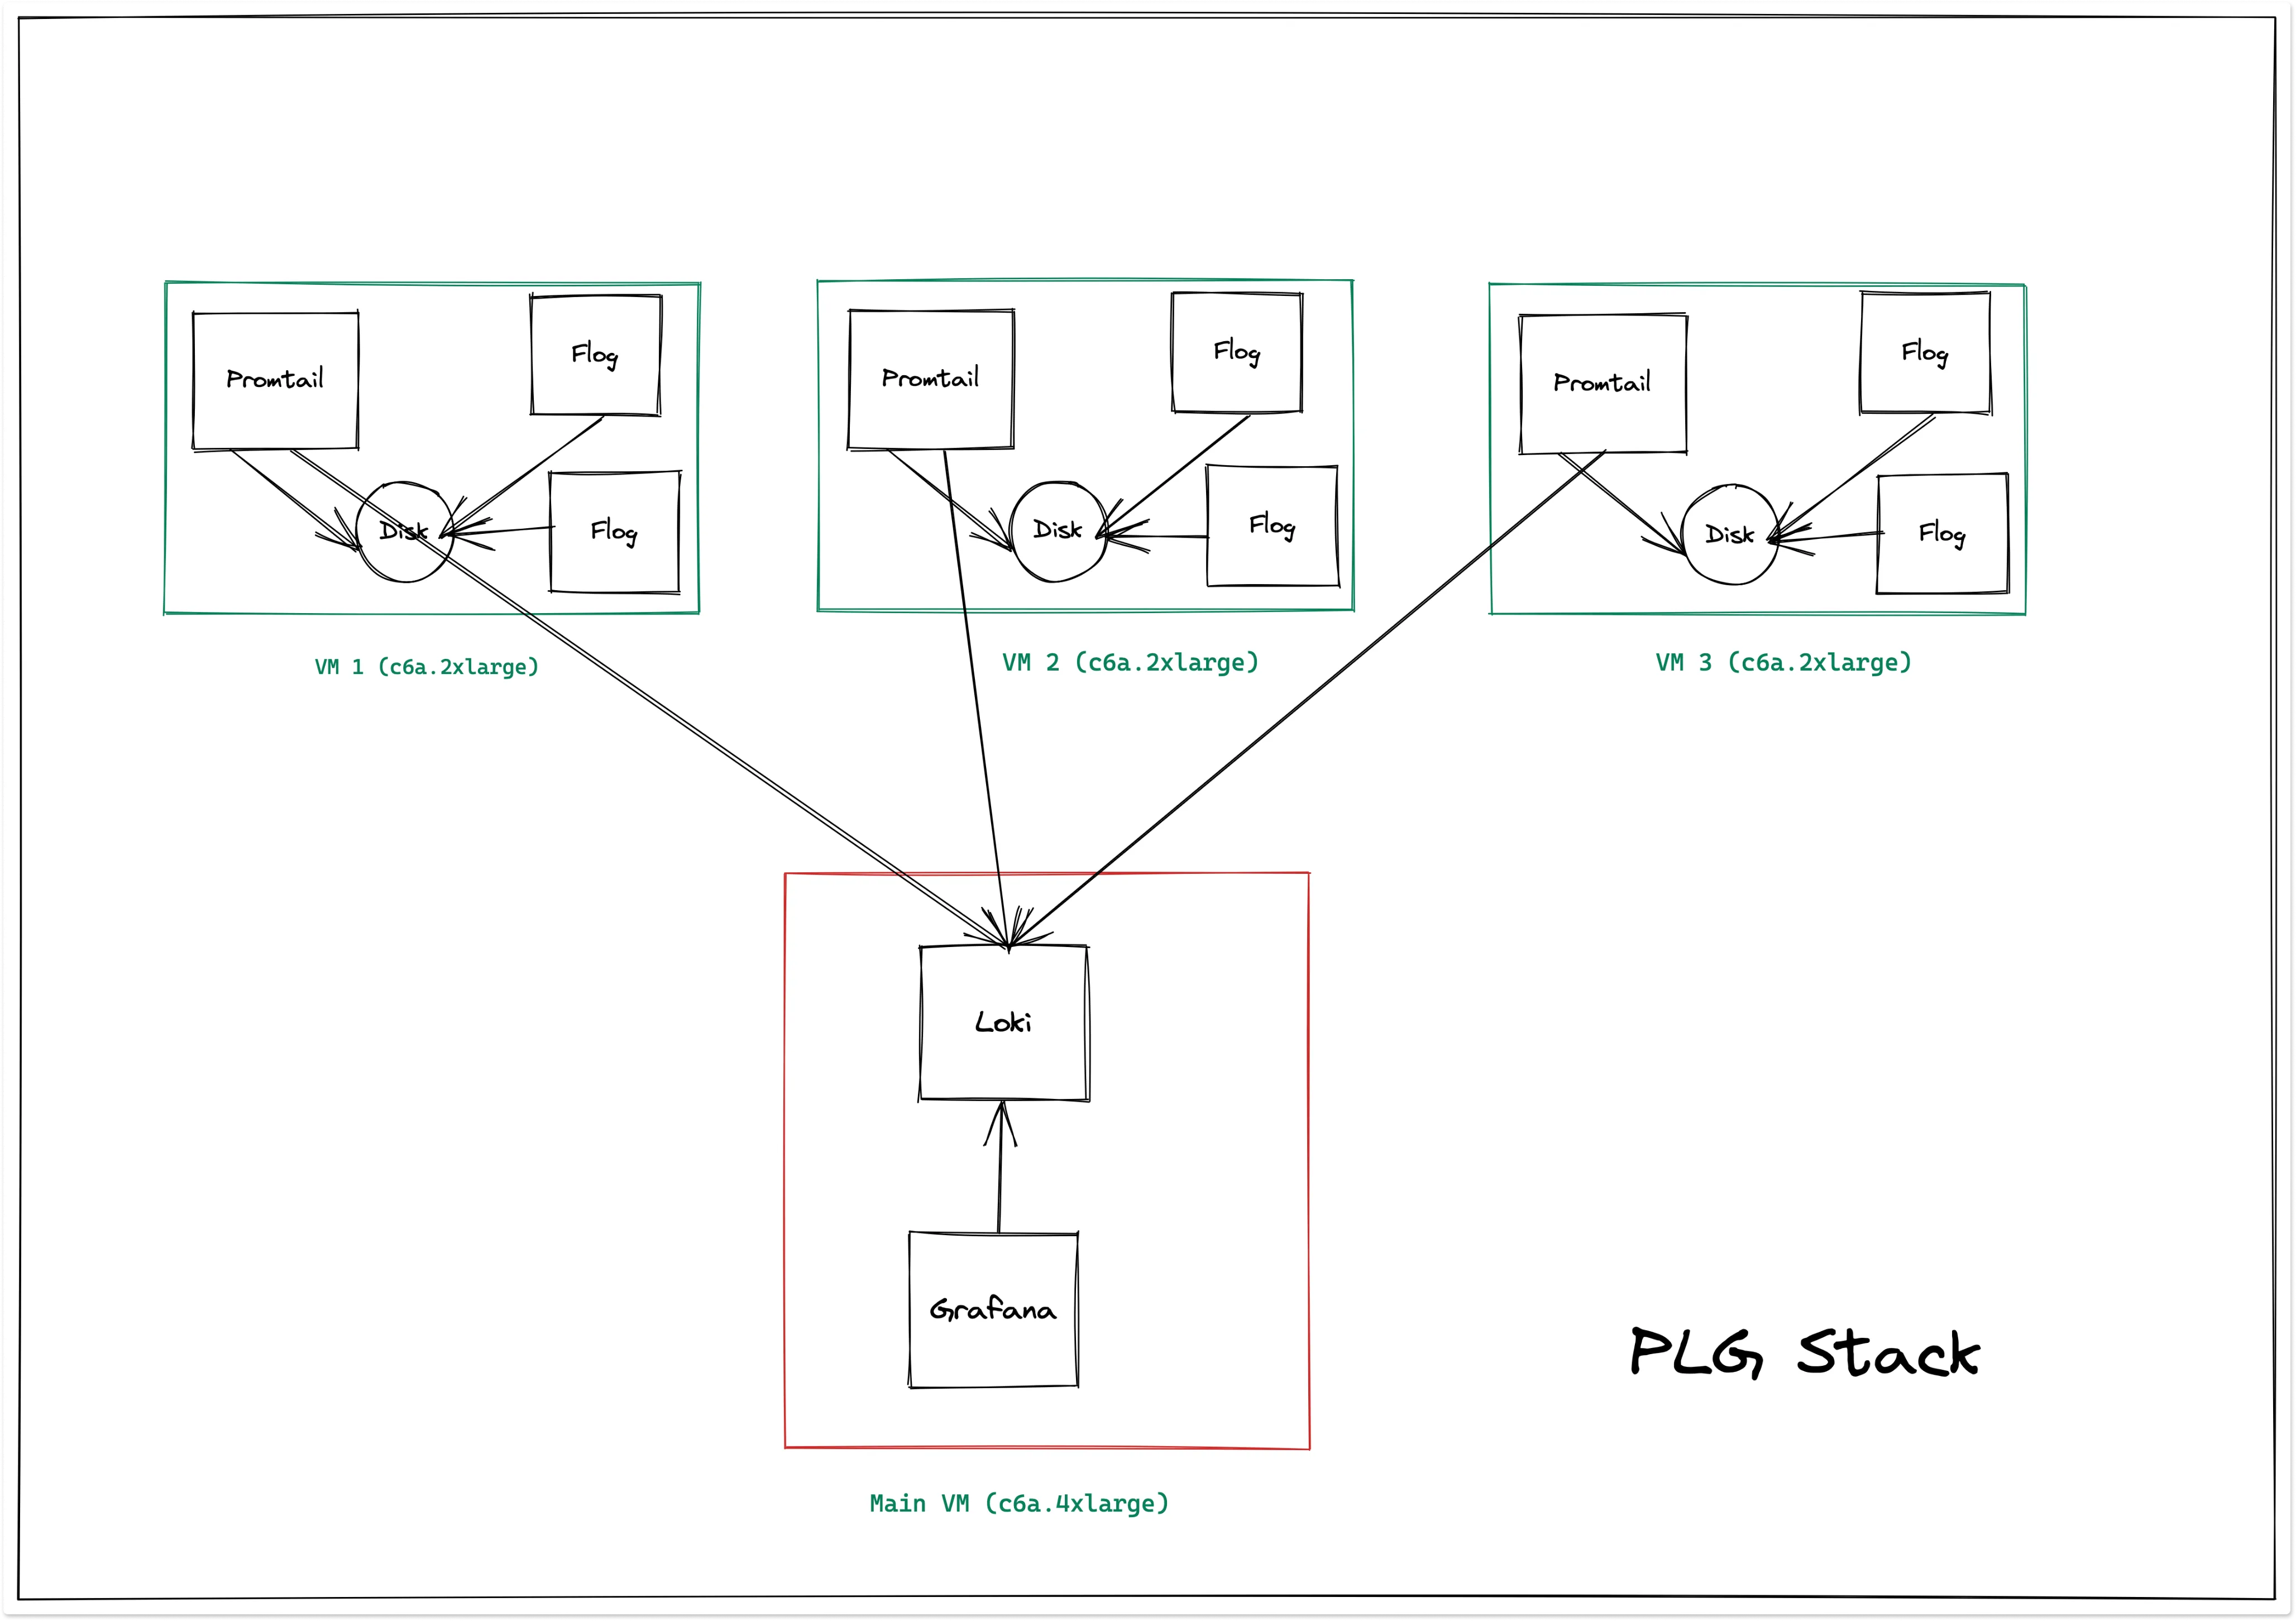
Here we have used only two flog containers for generating logs. If we try to increase the number of flog containers, Loki errors out with max stream errors as the number of files increases and thus resulting in a higher number of streams. Also we were able to only index two attributes which are protocol and method. If we try to create more labels, it reaches max stream error.
It is also recommended by Grafana to keep the number of labels as low as possible and not to index high cardinality data.
Ingestion Benchmark Results
The table below represents the summary for ingesting 500GB of logs data in each of the logging solutions.
| Name | Ingestion time | Indexes |
|---|---|---|
| SigNoz | 2 hours | All Keys |
| Elastic | 5 hours 27 mins | All Keys |
| Loki | 3 hours 20 mins | Method and Protocol |
Now let's go through each of them individually.
Number of logs ingested per second
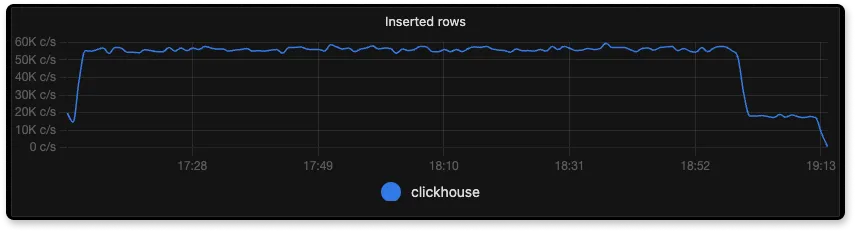
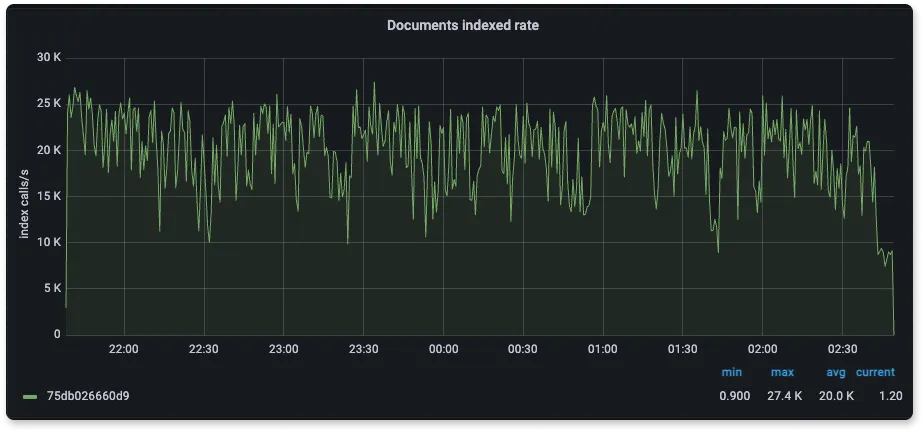
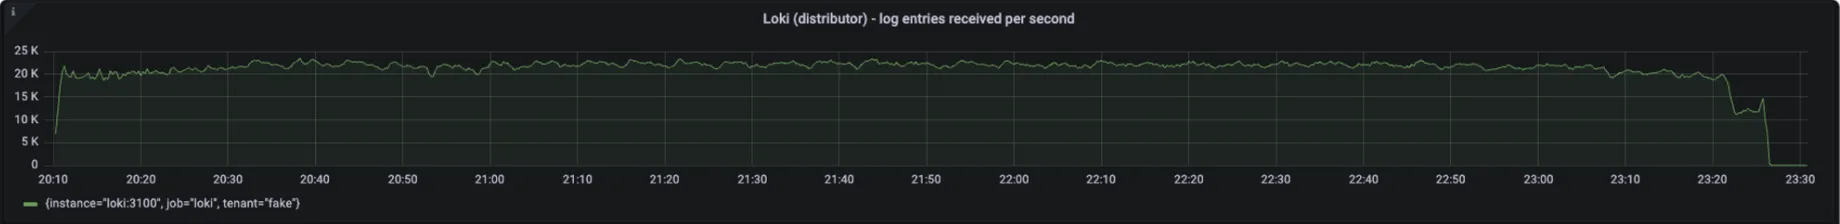
From the above three graphs of SigNoz, Elasticsearch and Loki we can see that the number of log lines inserted by each is about 55K/s, 20K/s, and 21K/s respectively.
Here ClickHouse is able to ingest very fast regardless of the number of indexes as it was designed for faster ingestion and uses skip index for indexing because of which the footprint is less. On the other hand, Elasticsearch indexes everything automatically which impacts the ingestion performance. For Loki, ingestion is mostly limited by the number of streams that it can handle.
CPU usage during ingestion
Many a times, ingestion processes are CPU intensive. In such scenario, an application which is more CPU efficient during ingestion allows you to handle the same data ingestion rate in a machine with smaller number of CPU cores.
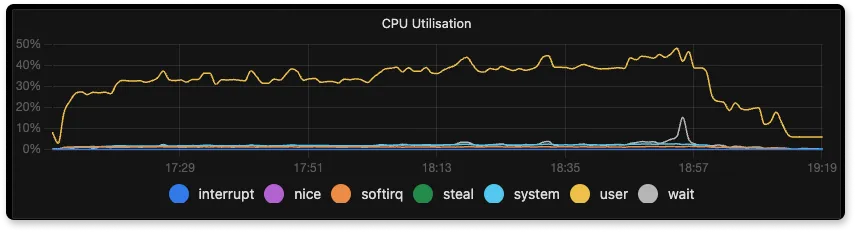
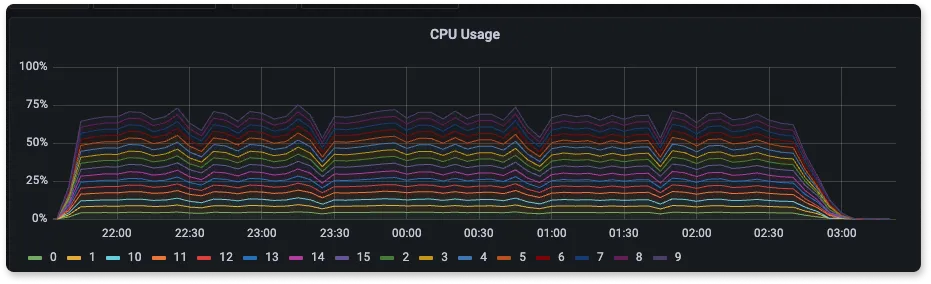
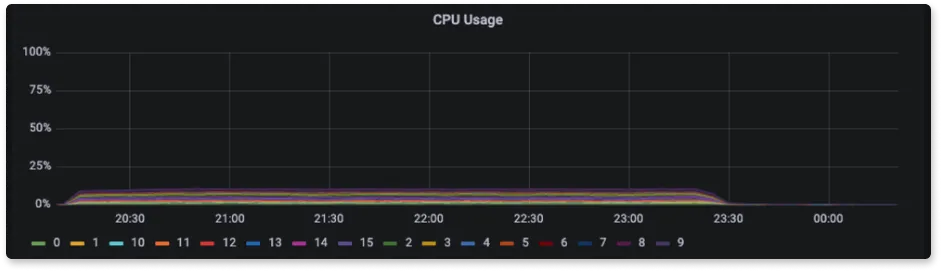
From the above three graphs of CPU usage for SigNoz, Elasticsearch and Loki we can see that the CPU usage was 40%, 75%, and 15% respectively. The high usage of Elasticsearch is mainly due to the amount of indexing and processing that it has to do internally. Since the number of indexes is lowest in Loki, it has to do the minimum processing because of which the usage is very low with respect to others. SigNoz CPU usage is the sum of CPU used by different components such as the three collectors used for receiving logs because of which it stands in a very good position with respect to Elasticsearch and Loki.
Memory usage during ingestion
Some terminologies on how memory is measured and what the graphs below indicate:
used: memory in use by the OS.
free: memory not in use.
shared / buffers : This shows memory usage for specific purposes, these values are included in the value for used.
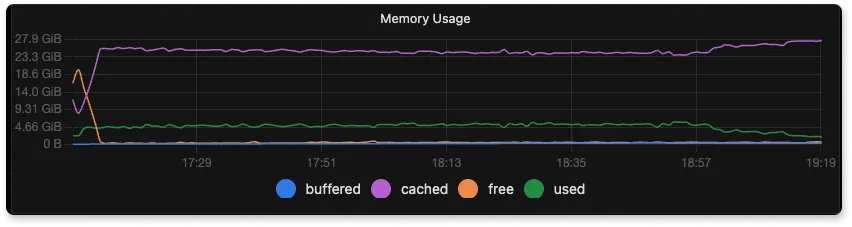
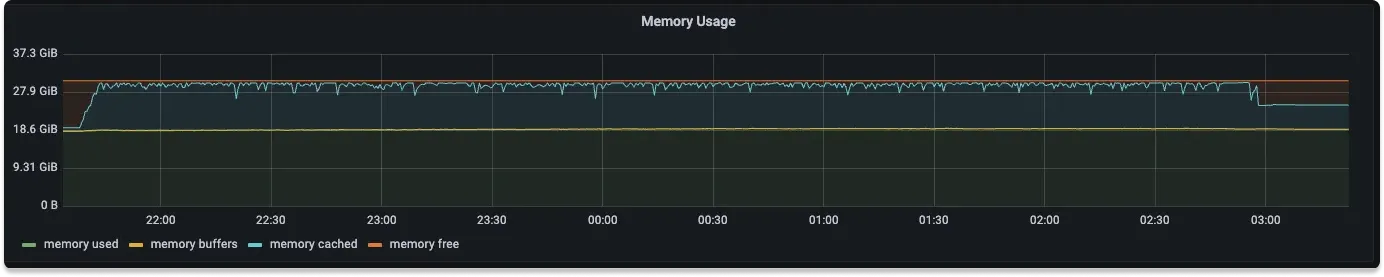
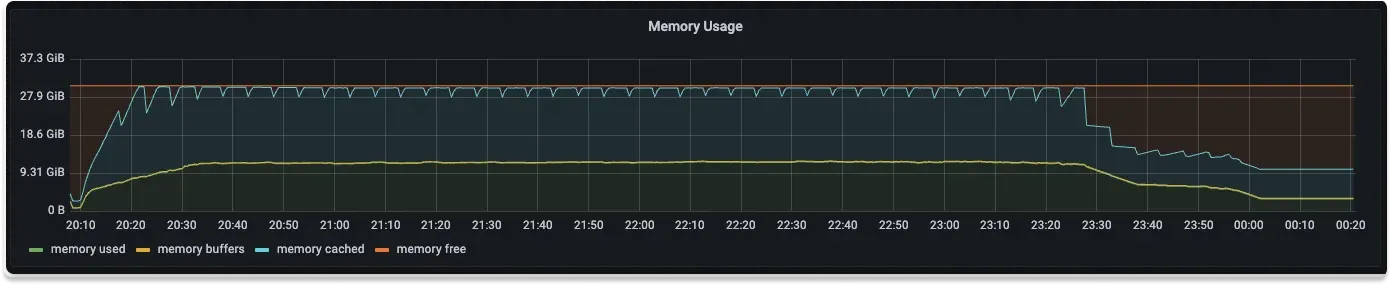
From the above graphs for memory usage of SigNoz, Elasticsearch and Loki we can see the memory usage to be 20%, 60%, and 30% respectively.
For this benchmark for Elasticsearch, we kept the default recommended heap size memory of 50% of available memory (as shown in Elastic docs here). This determines caching capabilities and hence the query performance.
We could have tried to tinker with the different heap sizes ( as a % of total memory) but that would impact query performance and hence we kept the default Elastic recommendation.
Disk usage during ingestion
During ingestion, we want to measure at what speed read and write speeds are performed at the node disk. A higher write speed means faster ingestion of data.
So, as you can see from the below disk utilization graphs, SigNoz is able to utilize more of the disk write speed.
Here we are using gp2 disk for all the ingestion. The max throughput for gp2 is ~250 MB/s
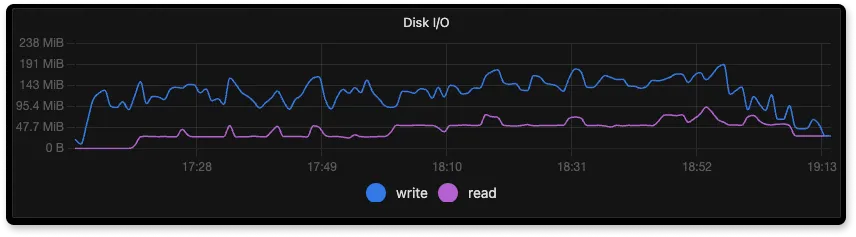
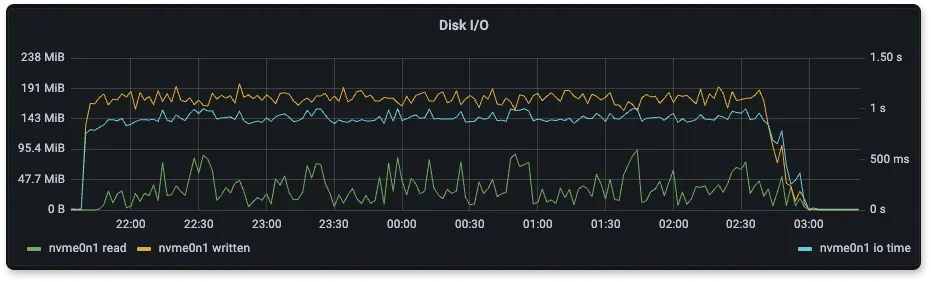
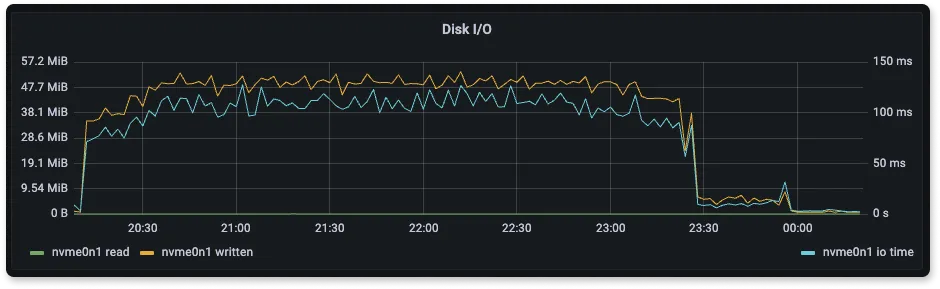
From the above graphs of Disk I/O we can see that Elasticsearch has higher disk I/O than SigNoz for less number of log lines ingested per second. One of the reasons why elasticsearch disk usage is high is because of translogs that get written to the disk. Elasticsearch writes all insert and delete operations to a translog, because of which there is extra disk usage.
SigNoz uses ClickHouse for storage. ClickHouse provides various codecs and compression mechanism which is used by SigNoz for storing logs. Thus it reduces the amount of data that gets written to the disk.
The disk usage of Loki is low because it has only four labels(indexes), and there is nothing else apart from it that is getting written to the disk.
Note on importance of high disk utilization
SigNoz and Elasticsearch are able to utilize the disk in a better way compared to Loki as they are able to process more data and write to disk.
This is also helpful because if your disk throughput is low, then it would keep more things in the buffer and utilize more of its RAM. So, a lower disk throughput is likely to hog more RAM and eventually lead to dropping of data.
Query Benchmark Results
Query performance in different logging solutions is very important as it helps us to choose a solution where we might or might not require certain querying capabilities. Systems that don’t have a high ingestion rate might need simple in-memory searching capabilities, while some might require aggregating billions of logs of data collected over days.
We chose different types of queries to compare.
- Perform aggregation on a value.
- Generate a time series while filtering for low-cardinality data
- Generate a time series while filtering for high cardinality data.
- Get the log corresponding to a high cardinality field
- Get logs based on filters.
| Query | SigNoz | ElasticSearch | Loki |
|---|---|---|---|
| Average value of the attribute bytes in the entire data (aggregate query) | 0.48s | 6.489s | - |
| logs count with method GET per 10 min over the entire data (low cardinality timeseries) | 2.12s | 0.438s | - |
| logs count for a user-identifier per 10 min over the entire data (high cardinality timeseries) | 0.15s | 0.002s | - |
| Get logs corresponding to a trace_id (log corresponding to high cardinality field) | 0.137s | 0.001s | - |
| Get first 100 logs with method GET (logs based on filters) | 0.20s | 0.014s | - |
At SigNoz, we believe that observability is fundamentally a data analytics problems and a lot of querying esp. for logs happen around aggregation and slicing and dicing of data.
Companies like Uber have found that in production environment, more than 80% of queries are aggregation queries, such as terms, histograms and percentile aggregations.
Hence, we think that fast aggregation queries will greatly improve the user querying experience in SigNoz compared to the ELK stack.
In all of our above test queries, Loki was not able to return results. This is consistent with some of the open issues in the Loki community around performance with high cardinality data.

Storage Comparison
We have ingested 500GB of logs data for each of the stacks. The table below shows us how much space is occupied by each of the logging solutions. While Loki is taking the least amount of storage, it has also not indexed anything apart from the method and protocol keys.
ClickHouse, which is the datastore for SigNoz, uses Skip Index while Elastic indexes everything, which increases the storage needed by Elastic.
| Name | Space Used | Document Count |
|---|---|---|
| SigNoz | 207.9G | 382mil |
| ElasticSearch | 388G | 376mil |
| Loki | 142.2G | unknown(query fails) |
Conclusion
- For ingestion SigNoz is 2.5x faster than ELK and uses 50% less resources.
- Loki doesn’t perform well if you want to index and query high cardinality data.
- SigNoz is about 13 times faster than ELK for aggregation queries.
- Storage used by SigNoz for the same amount of logs is about half of what ELK uses.
Related Posts