My 7 key takeaways from PromCon 2019
PromCon is one of the premier conferences on Prometheus and related tools like Grafana. This is held every year where developers from around the world gather to learn the latest in monitoring technologies.
This year PromCon was held in Munich from 7th-8th November. I couldn't attend the event in person, but thankfully the organisers live-streamed the conference - so that people like me who couldn't attend in person don't miss out on what's hot & happening.
The conference featured lots of talks - from detailed guidelines from practitioners in the field, to what's upcoming from the vendors and key people in open source projects.
Here's the schedule from Day 1. As you can see, it features a good mix from different type of people - from devs to project maintainers to vendor representatives.
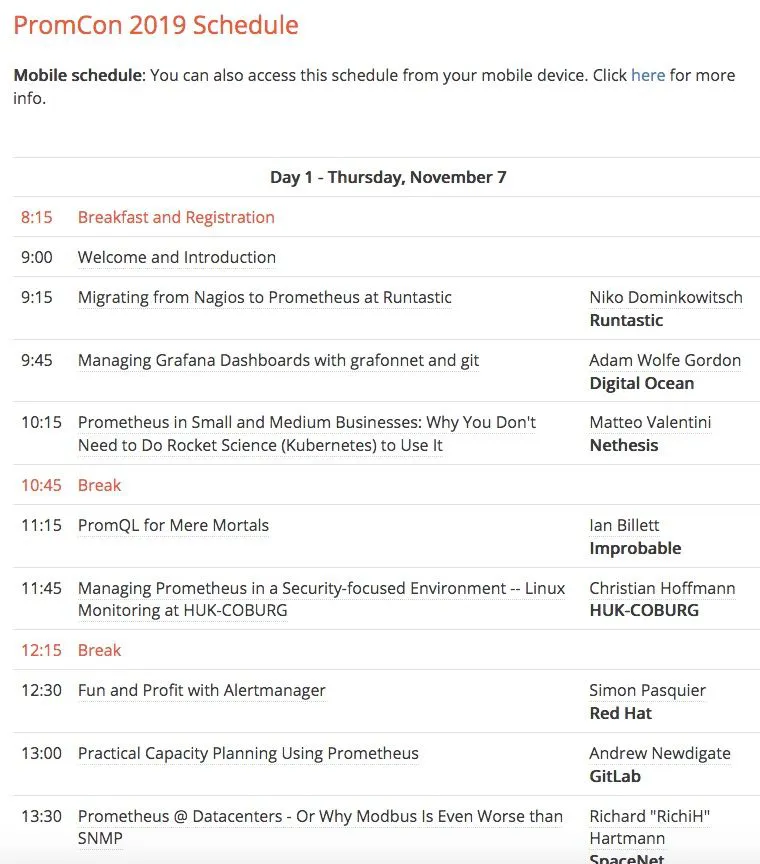 PromCon 2019 - Day 1 Schedule
We recently open-sourced our observability platform on Github.
Here are my top 7 key takeaways from the sessions presented in PromCon 2019
-
Managing Grafana Dashboards with git
Adam Wolfe from Digital Ocean gave a great talk on how Grafana dashboards can be created and managed using git, rather than manually editing the dashboards. He is a developer in the storage team and they use Grafana to monitor their metrics. His team had the problem of maintaining consistencies across dashboards and understanding who changed what.
Also, to deploy many dashboards - as they do, for monitoring different components - it becomes a time-consuming task to configure the dashboards manually.
To solve this, they used Grafonnet, which is a grafana jsonnet library to configure the dashboards. They would maintain the dashboards configuration as code which can then be easily tracked over git.
They also used Grafana snapshot API to create a point in time copy of the dashboard and use this to understand what was the performance of the system at any point in time.
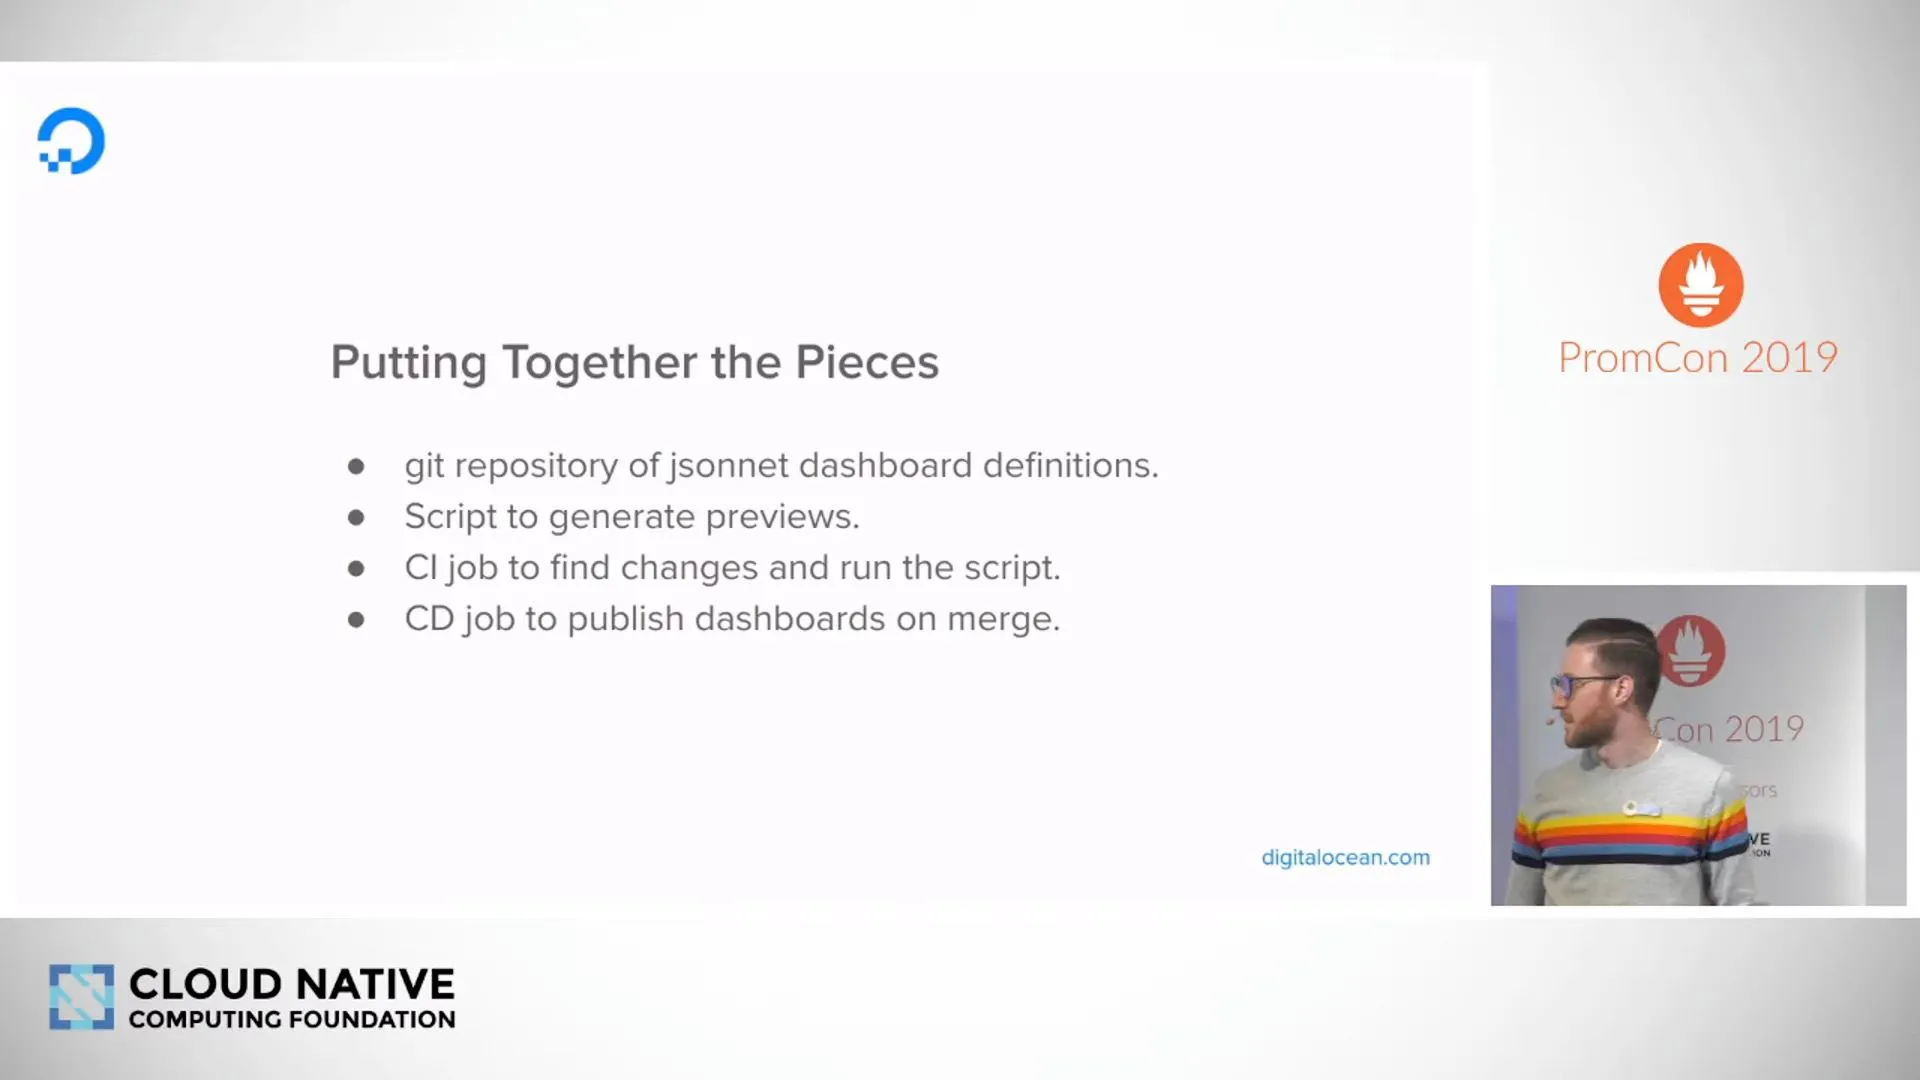 Figure 1 - Managing Grafana dashboards with grafonnet and git.
 -
Validate and test alert definitions before making them live
Simon Pasquier from Red Hat gave a great talk on details of alert manager, how to configure and validate them before making live in production environments. He is the maintainer for Alertmanager and* consul_exporter projects, * so what he says carries some weight.
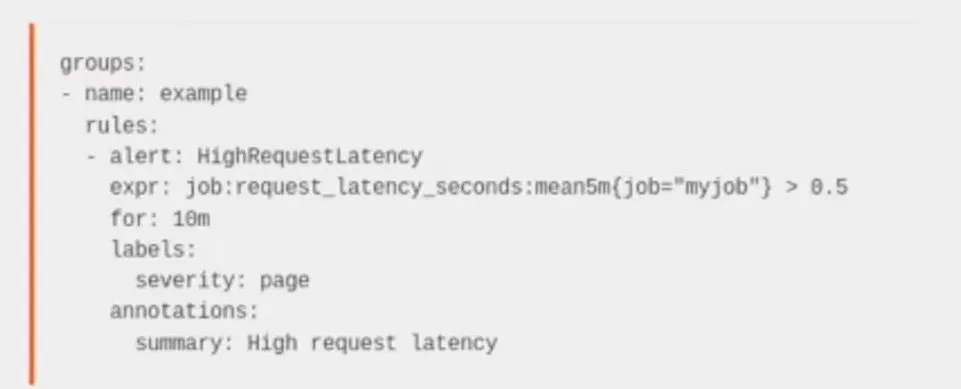 Fig.2 - Sample alert definition
Some guidelines on creating an alert definition
- Think about which labels to propagate
- "Complex" alerts can be harmful
- It's useful to spend time in learning the template language
- Differentiate between alerts that are urgent and those that can wait
- Alert should be tested and gone through some software validation - As any software is tested before shipping to production, alerts should also be tested before making live. This can be done by writing simple .yml test cases in tools promtool as shown in Fig.3
- Description can be implemented using variables which would give more informative annotations to the alert.
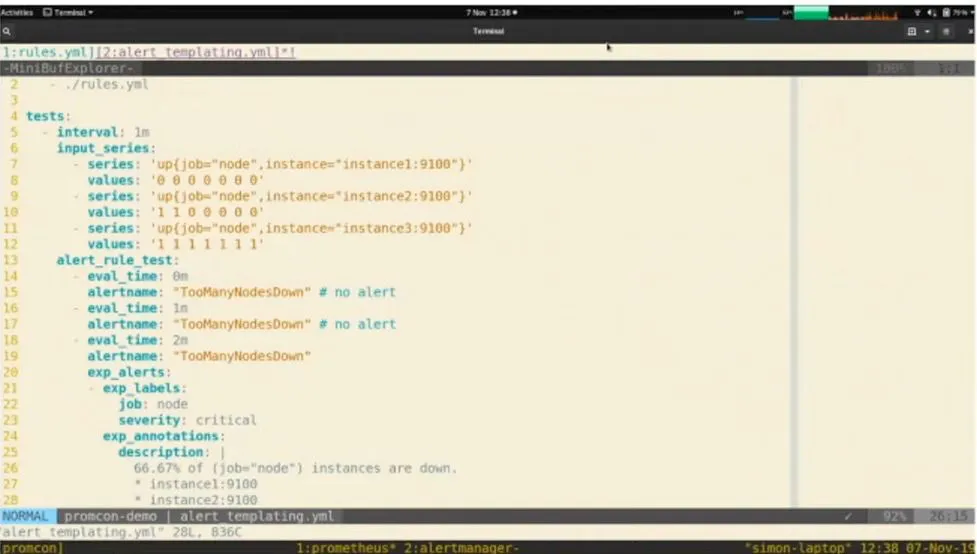 Fig. 3 - Tests can be written for alerts - as shown above
Once you write an alert expression, don't assume that alerts will be shown as soon as the condition is true. You need to understand how alerts are evaluated and what is the evaluation period and group_wait interval.
When will you receive an alert after an alert condition is satisfied? Figure below shows when.
There are scrape intervals, for conditions which come into play here. Evaluations should be true for 2 minutes after scraping for the alerts to start firing
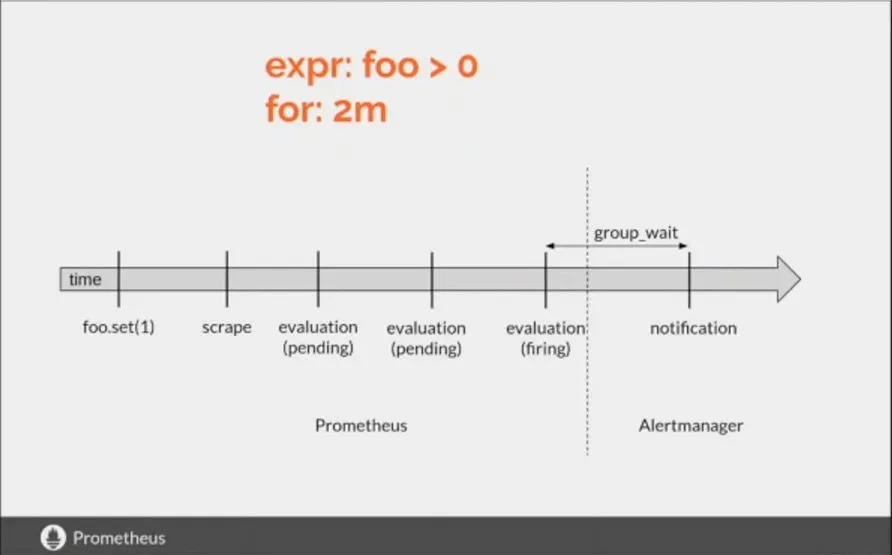 Fig.4 - Alertmanager trigger cycle
 -
Understanding Routing of alerts
Here are some guidelines from Simon's talk on how should your alerts be routed.
- Keep it simple
- First level routes should match services/teams
- Use amtool or routing tree editor to test/validate as shown in figure 5
- Group alerts together so that the notification is meaningful for the user
- Every service or team should manage its own paging/alerting cadence
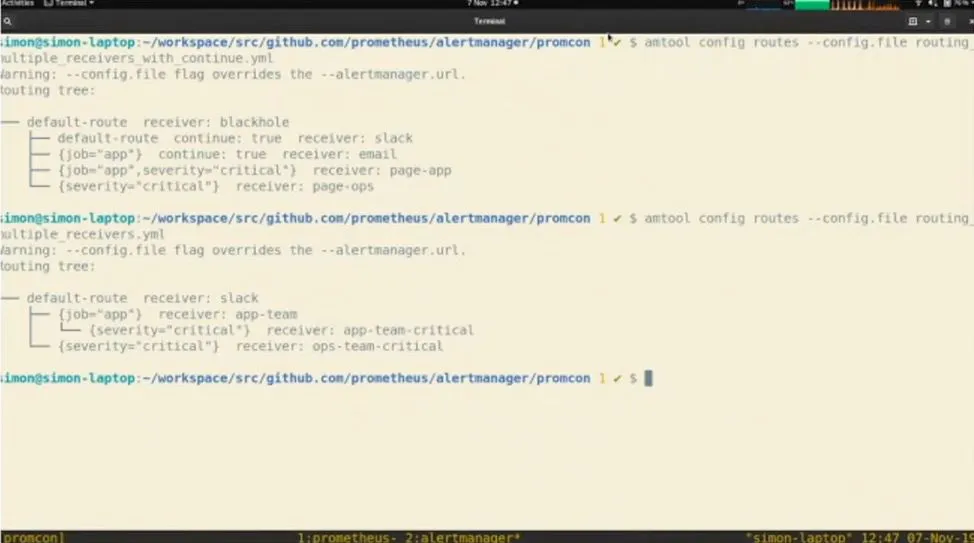 Figure 5 - Using amtool to visualise alerting rules
 -
Using Silence and Inhibitions when debugging issues | HA of alert manager
- Silences are used to not get alerted when an outage is known
- Inhibitions - If service B is down, then service A, which uses Service B, would also be down. In this case, the alert from Service A being down should be inhibited - as we already know the cause of it going down.
How do you ensure High Availability of alert manager?
-
Prefer notification to be sent twice, rather than not sending at all if the cluster is down or split (network partition)
-
Use gossip protocol to replicate all the information in the alert manager cluster- Based on the hashicorp/memberlist library
-
Broadcast silences and notification logs via gossip protocol so that duplicate notifications are avoided
-
Requires a dedicated TCP/UDP port
- UDP for small messages
(<= 700 bytes) - TCP otherwise
- UDP for small messages
-
-
Capacity Planning Using Prometheus
Andrew Newdigate from GitLab gave a great presentation on how their team used Prometheus to monitor issues caused because of resource saturation. Resource saturation could occur for any of the following resources:
- Server Workers : unicorn worker processes, puma threads, sidekiq worker
- Disk: disk space, disk throughput, disk IOPs
- CPU: compute utilization across all nodes in a service, most saturated node
- Memory: node memory, cgroup memory
- Database pools: postgres connections, redis connections, pgbounder pools
- Cloud: Cloud quota limits
Saturation Measurement Recording Rules
Setup a recording rule with two fixed dimensions (labels) service_component:saturation:ratio
Two fixed dimensions/label
- "service" - the service reporting the resource - e.g. web, postgres
- "component" dimension - the component resource we are measuring - e.g. memory, cpu
All series report a ratio between 0 and 1. 0 is (good) - 1 = 100% Saturated (bad)
Below is a graph on measuring saturation :
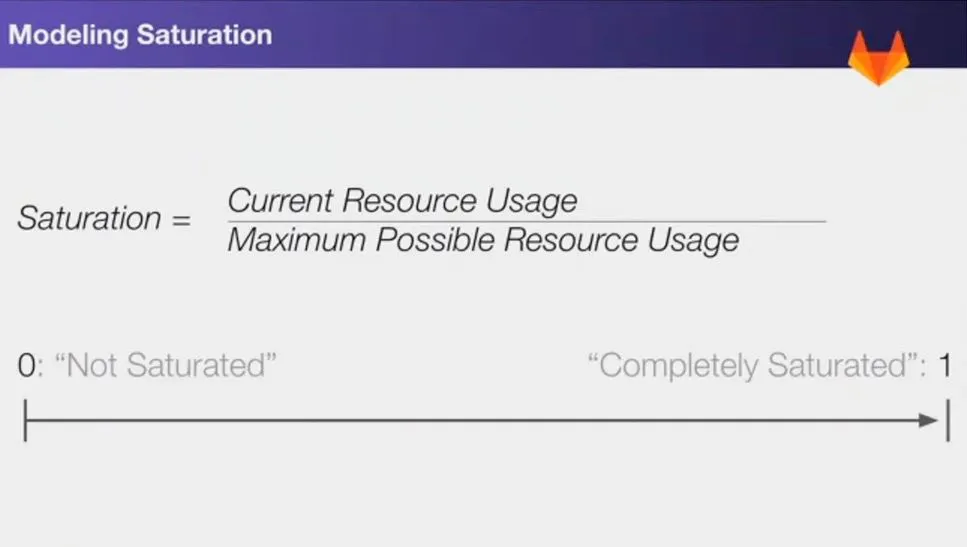
Figure 6 - Modelling Saturation
These metrics can be used to predict the saturation level of resources. Generally, we just need to monitor only the worst case prediction. Below is a PromQL query showing how this could be done.
Worst-Case Predictions in PromQL
record: service_component:stauration:ratio:predict_linear_2w

expr: >

predict_liner(

service_component:saturation:ratio:avg_over_time_1w[1w],

86400 \* 14 #14 days in seconds
   >)
Below is a snapshot of how Gitlab currently does its capacity planning. Any resources which is predicted to reach 100% saturation is looked into.
Capacity Planning dashboard used by Gitlab
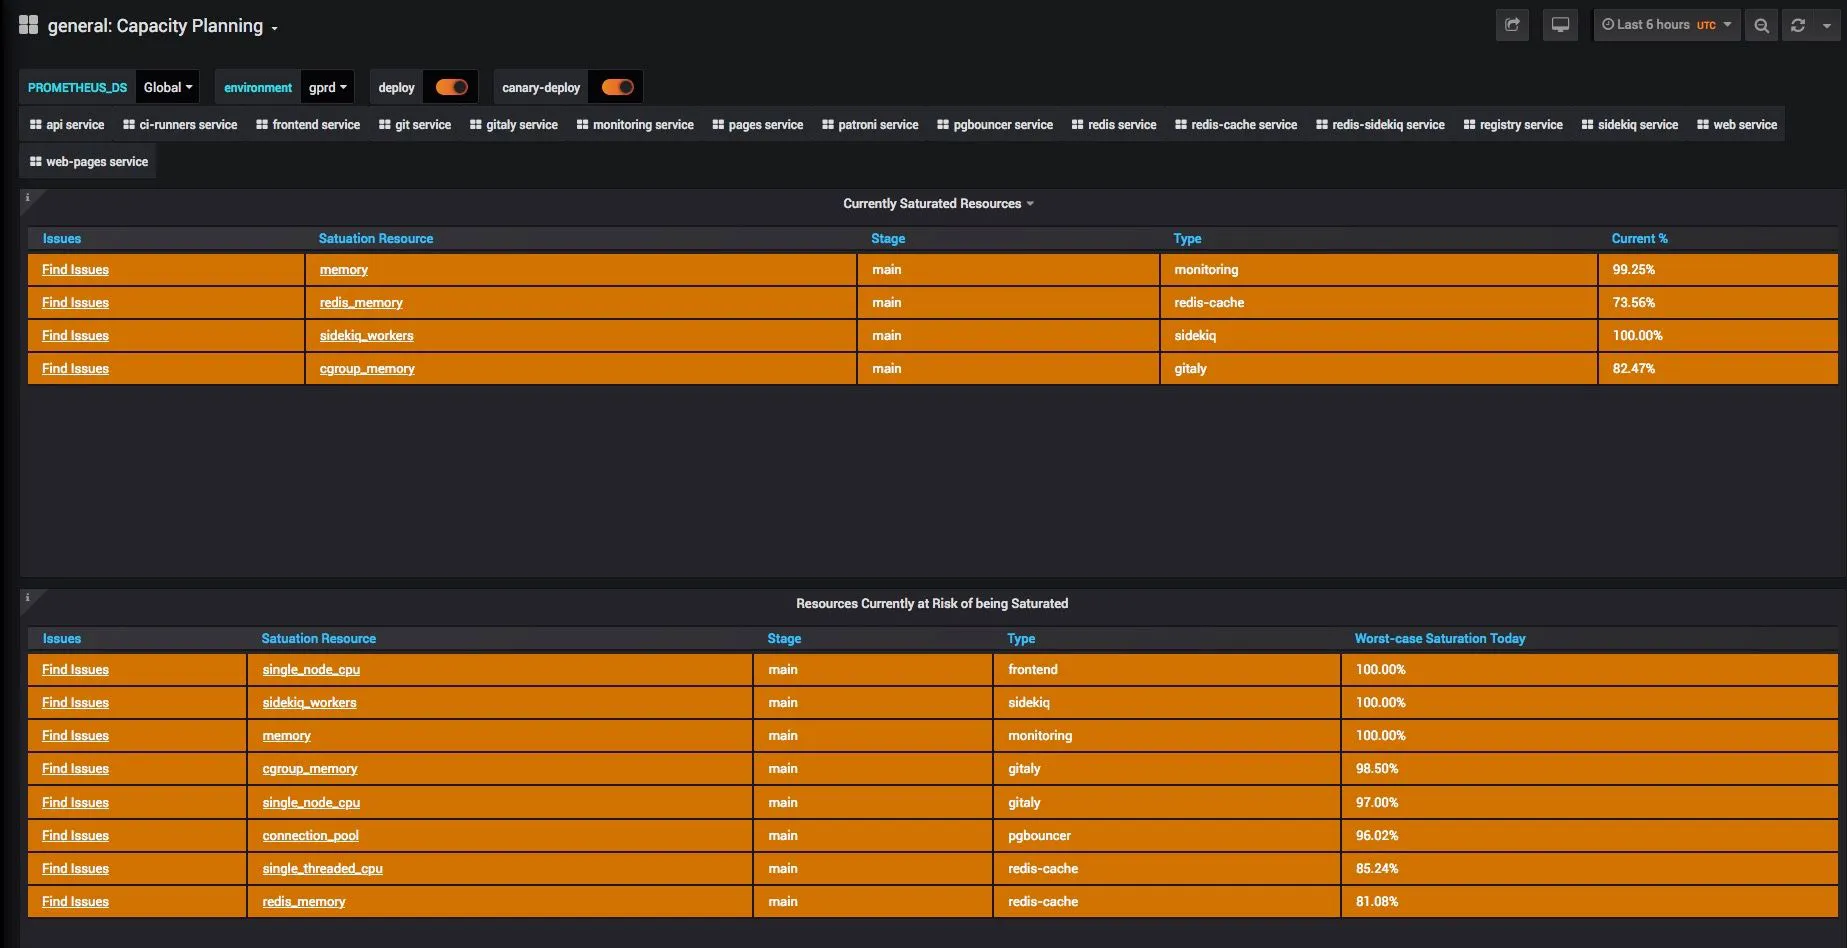 Figure 7 - Capacity Planning dashboard used by Gitlab
-
Failure is not linear in complex systems
Andrew also mentioned in the above talk that in complex systems like current microservices-based production systems, failure is not linear. For example, in the case of saturation metrics, error rates were at around 0 till saturation was at 90%, but suddenly as saturation increased from 90%, error rate spiked up and quickly shot up to 100%.
In such cases, linear interpolation based prediction is useless as the underlying system behaves non-linearly. A more robust, worst-case based prediction system should be made which rather than predicting actual saturation level, predicts the worst-case error. In his experience, this is a much simpler heuristic to look at - than building linear predictive models.
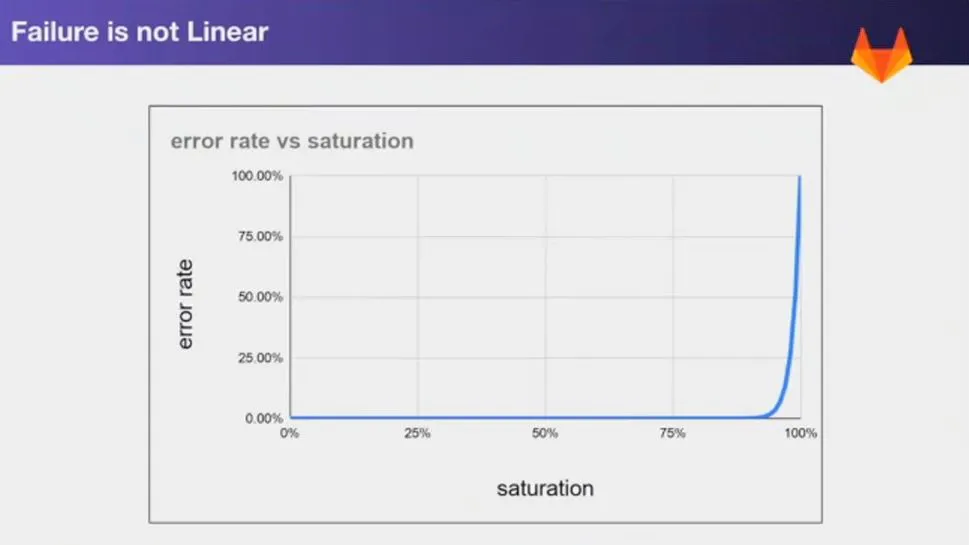 Figure 8 - Error rate increased non-linearly with saturation
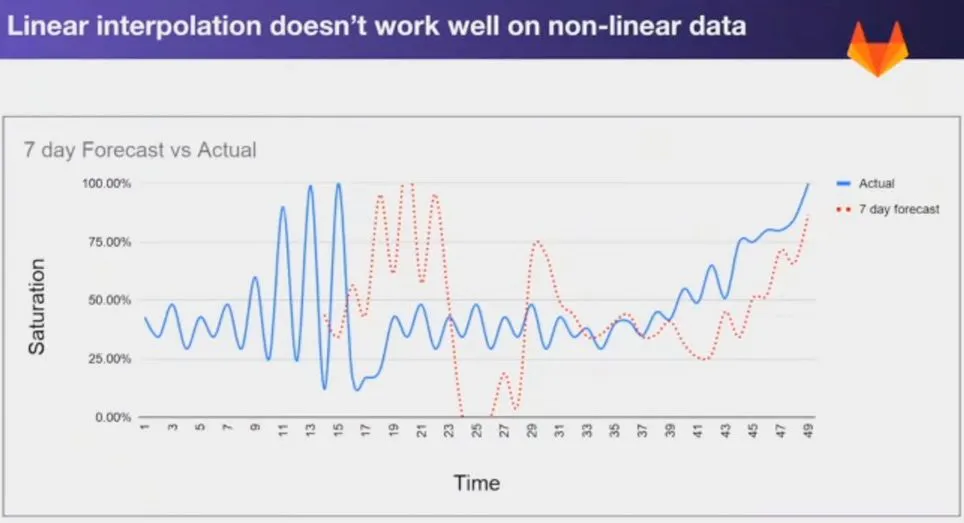 Figure 9 - Linear interpolation doesn't work for saturation prediction
 -
Prediction rather than alerting is the way to go
Andrew mentions in his talk that, prediction rather than alerting is the way to go for monitoring complex systems. As the error rates grow non-linearly, alerting ~95% benchmark of a metric doesn't help, as it reaches 100% mark in no time, once it has reached 95% and an alert has been issued.
Forewarning in such a situation helps a lot and that is what Gitlab is building.
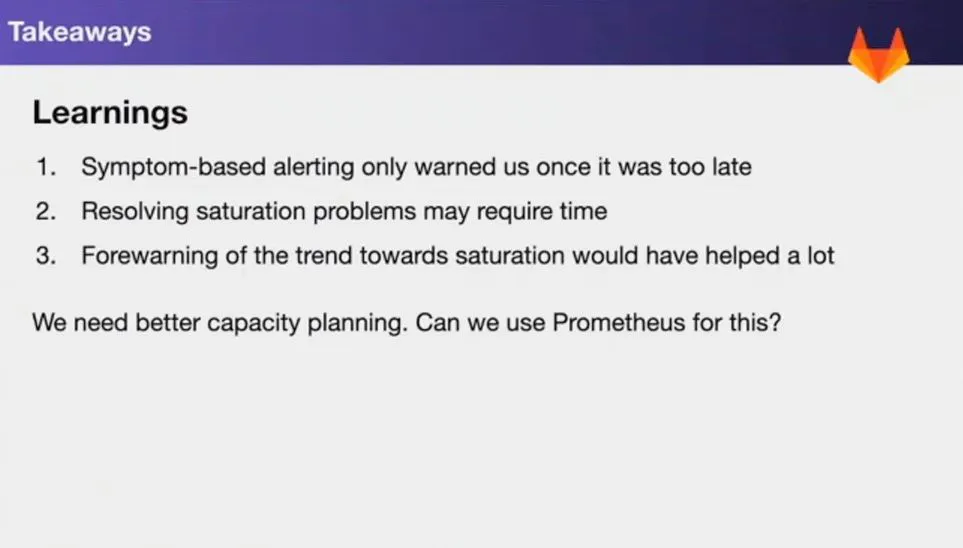 Figure 10 - Key Takeaways
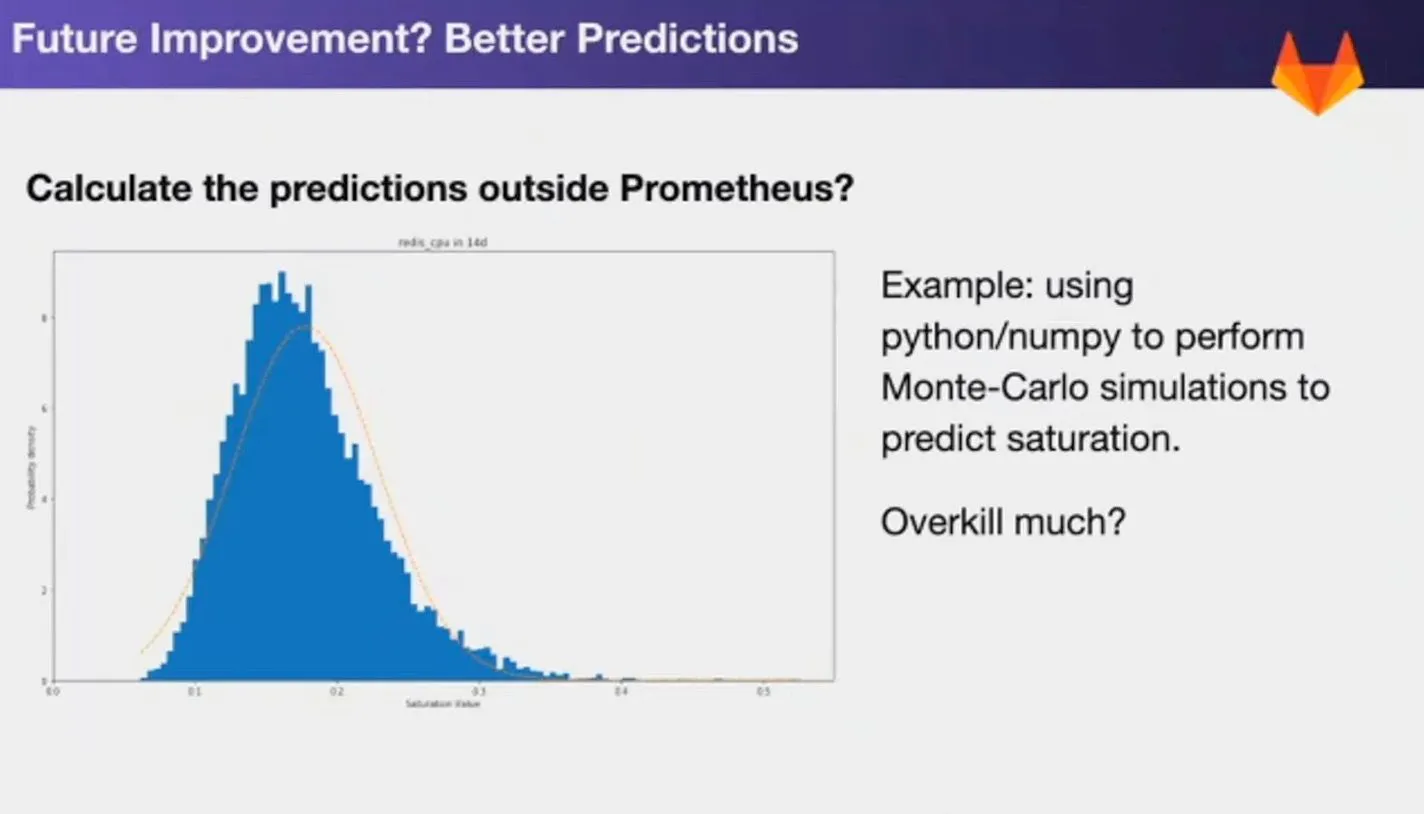 Figure 11 - Future improvements
Bonus:
Prometheus and Jaeger work well together
Gautham from GrafanaLabs gave a good talk on. I couldn't get into the details of it, but the broad takeaway from the talk is that Prometheus and Jaegar work quite well, and should be explored in more detail. Though not many people currently use Jaegar or distributed tracing, I think this will soon become very important.
Overall, I think it was a great conference with lots of interesting discussions around Prometheus. I definitely want to attend this conference in person, next time around.
Do let me know what did you like or not like in the above blog post?
At SigNoz, we are building a next-gen platform for APM for k8s with zero instrumentation. Interested? Drop me a note at pranay+blog@signoz.io and I will write back to you with more details.
