Latest top 21 APM tools [open-source included]
Application Performance Monitoring (APM) tools are a critical component of distributed applications now. But choosing the right APM tool can be tricky. In this article, we go through a list of the top 21 APM tools including open-source APM tools which can help monitor and improve your application performance.
What is application performance monitoring(APM)?
Application performance monitoring is the process of keeping your application's health in check by tracking key performance metrics. APM tools enable you to be proactive about meeting the demands of your customers. With distributed systems, performance metrics can be gathered from various components of your application:
- Services
- Infrastructure
- Network
- Hosts and containers
- Third-party APIs
- User Interactions
Performance monitoring enables engineering and IT teams to resolve issues quickly and ensure system availability, maintain SLAs, optimize service performance and improve response times for a better user experience.
Why are APM tools needed?
A robust APM tool can provide your engineering teams the much-needed visibility and context into the inner workings of your application. Modern distributed systems have enabled scale at a global scale but at the same time have increased the complexity of an application.
A few essential APM benefits in solving performance issues are as follows:
- Gives a centralized context and visibility into the app's inner workings across a distributed system
- Allows you to proactively identify issues that can cause breakdown and solves latency issues
- Helps you to meet end-user expectations and demands
- Increase revenue by protecting against downtime and user churn
- Saves engineering bandwidth in debugging and troubleshooting
List of latest top 21 APM tools:
- SigNoz
- Dynatrace
- New Relic
- AppDynamics
- Jaeger
- Instana
- DataDog
- Prometheus
- Honeycomb
- Lightstep
- Zipkin
- Graphite
- Splunk
- Grafana Labs
- Elastic APM
- Pinpoint
- Apache Skywalking
- AppOptics(Solarwinds)
- AWS X-Ray
- LogicMonitor
- Stackify Retrace
Top 21 APM tools [open-source included]
SigNoz
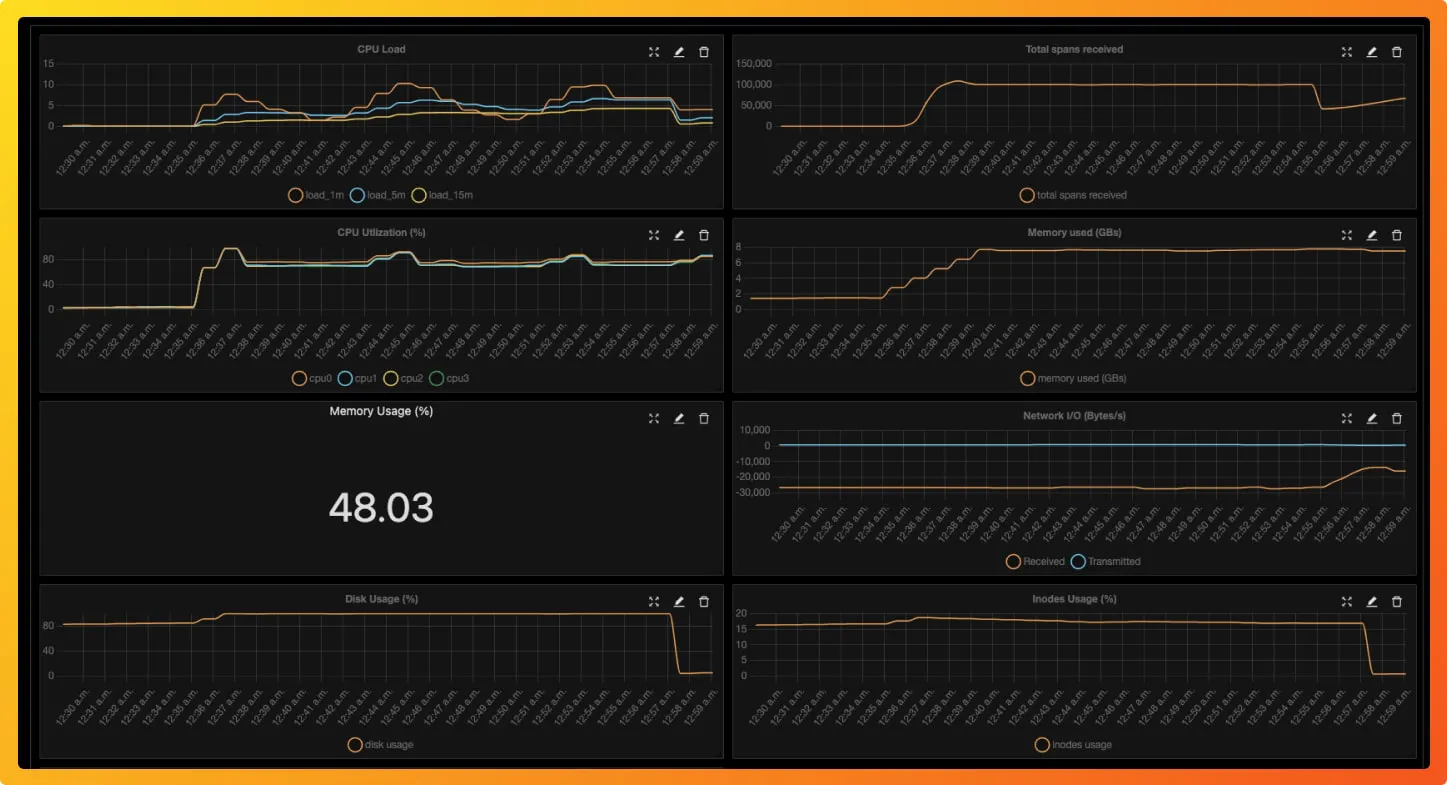
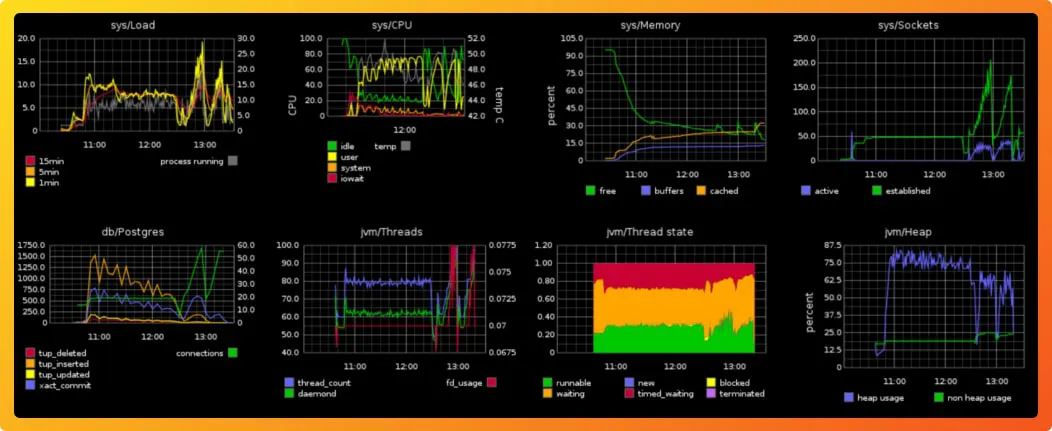
SigNoz is a full-stack open-source APM and observability tool. It provides a unified UI for application metrics and traces so that there is no need to switch between different tools like Jaeger and Prometheus. It also provides infrastructure metrics like CPU Load Average, CPU Utilization, System Memory Usage.
Using SigNoz, you can track things like:
- User requests per second
- 50th, 90th, and 99th percentile latencies of microservices in your application
- Error-rate of requests to your services
- Slow endpoints in your application
- Infrastructure metrics like CPU load average, system memory usage
- User requests across different microservices using distributed tracing
An open-source tool with the capabilities of SaaS vendors, SigNoz is a great choice for a robust application performance monitoring tool.


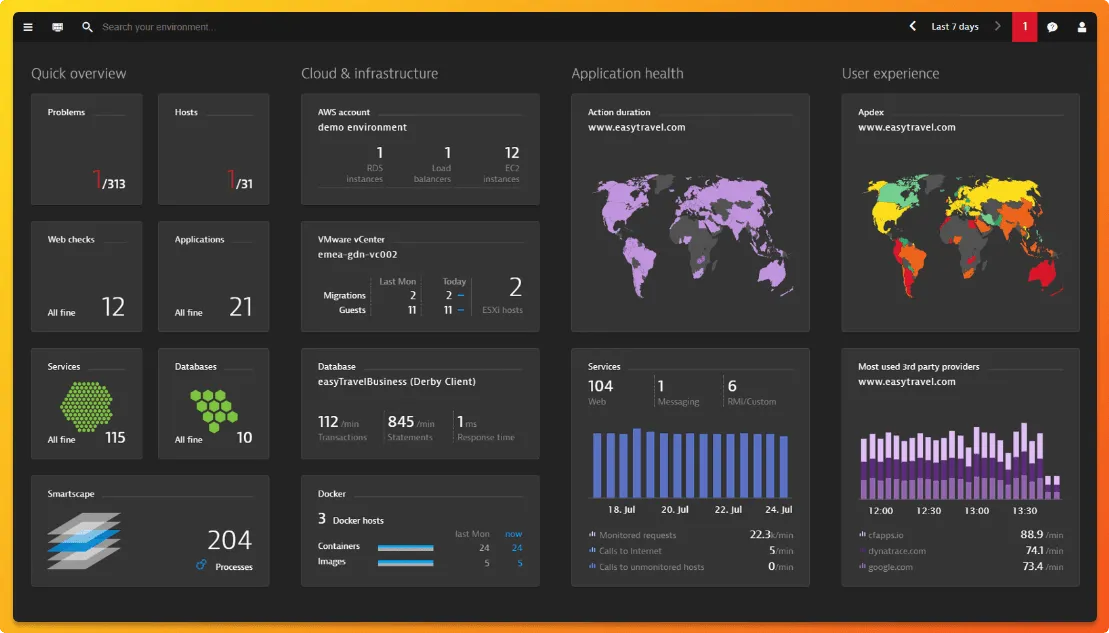
Dynatrace
Dynatrace is an extensive SaaS enterprise APM tool targeting a broad spectrum of monitoring needs of large-scale enterprises. It provides an AI engine called Davis to automate things like root cause analysis and anomaly detection.
Dynatrace also provides a different solution for infrastructure monitoring, application security, and cloud automation. The pricing depends on the product you want to opt for.
Full-stack monitoring, the product aimed to provide observability for apps, is priced at $69 per month for 8 GB per host if billed annually.
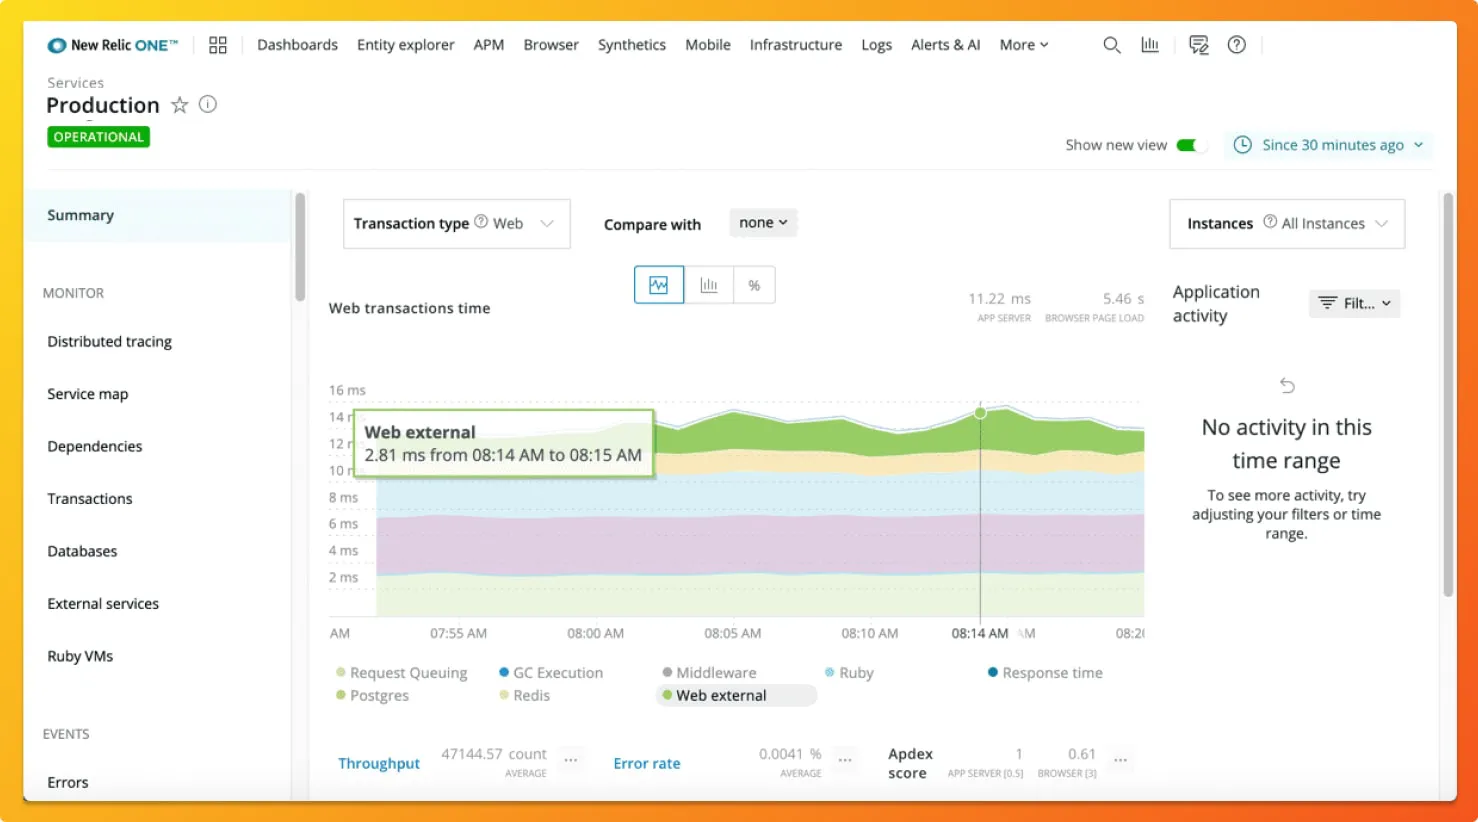
New Relic
New Relic is one of the oldest companies in the application performance monitoring domain. It offers multiple solutions to enterprises for performance monitoring.
Some of the key features of the New Relic APM tool includes:
- Language support for Java, .NET, Node.js, PHP, Python, Go and Ruby
- Distributed tracing and sampling options for a wide range of technology stack
- Correlation of tracing data with other aspects of application infrastructure and user monitoring
- Fully managed cloud-native experience with on-demand scalability
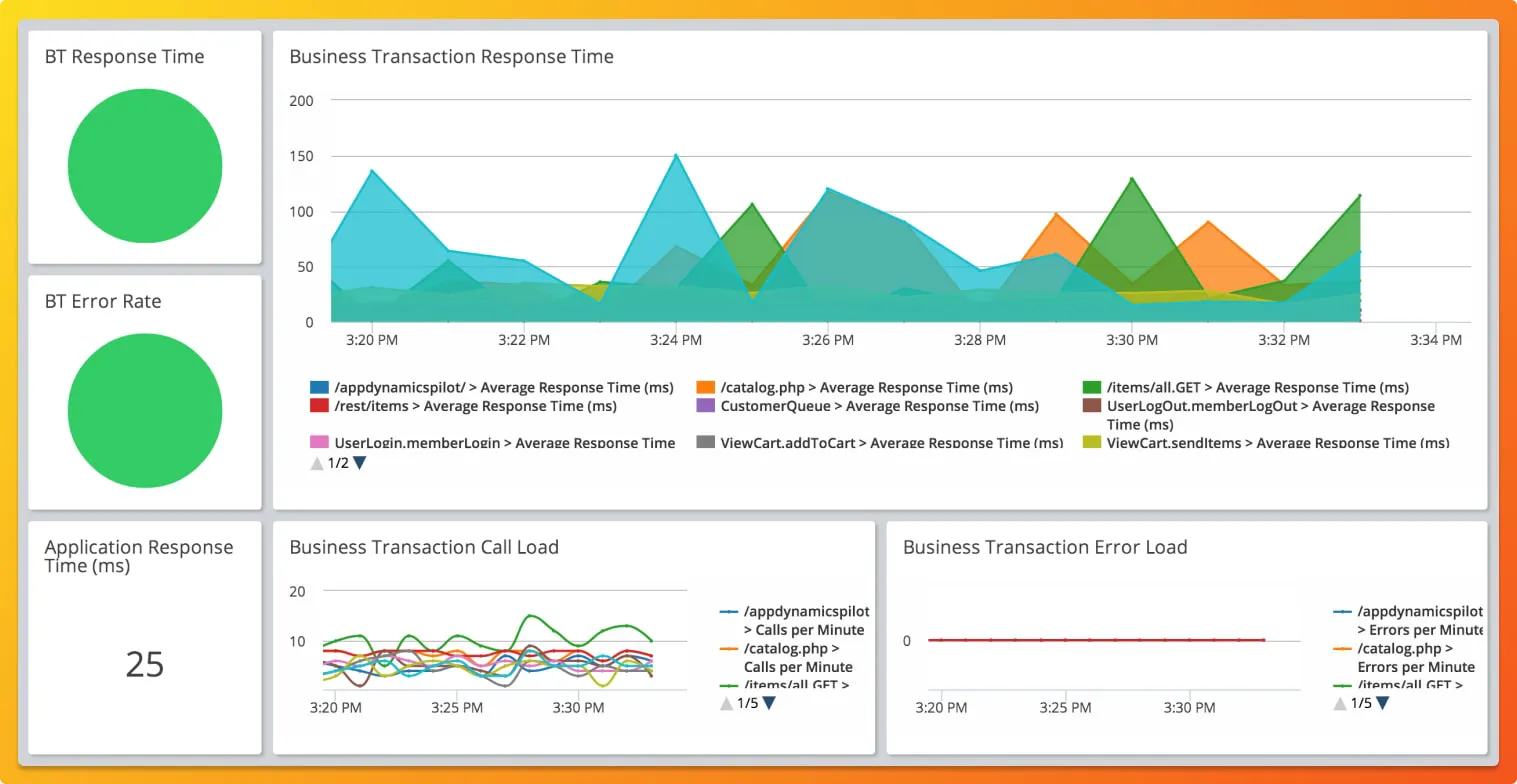
AppDynamics
AppDynamics is an extensive SaaS tool that promises to correlate business metrics and application performance metrics. Its platform includes an APM tool that provides code-level observability.
Some of the key features of the AppDynamics APM tool includes:
- Language support for Java, .NET, Node.js, PHP, Python, C/C++ and more
- Troubleshoot issues like slow response times and application errors
- Discover application topology automatically
- An alert system to alert you to issues in the context of business transactions
- Pricing starts at $60/month per CPU core
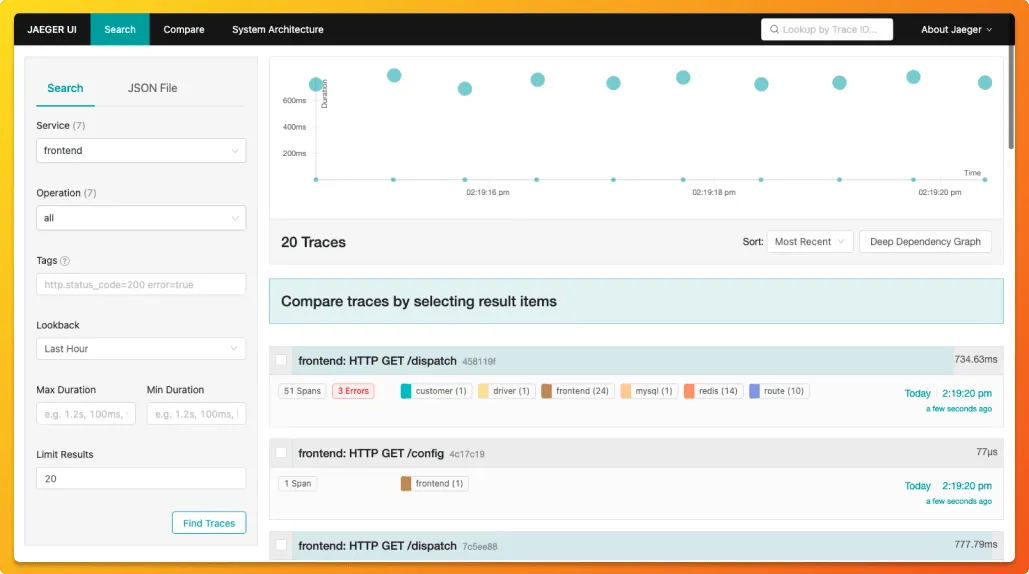
Jaeger
Jaeger is an open-source APM tool developed at Uber, which was later donated to Cloud Native Computing Foundation(CNCF). Inspired by Google's Dapper, Jaeger is a distributed tracing system.
It is used for monitoring and troubleshooting microservices-based distributed systems. Some of its key features include:
- Distributed context propagation
- Distributed transaction monitoring
- Root cause analysis
- Service dependency analysis
- Performance / latency optimization
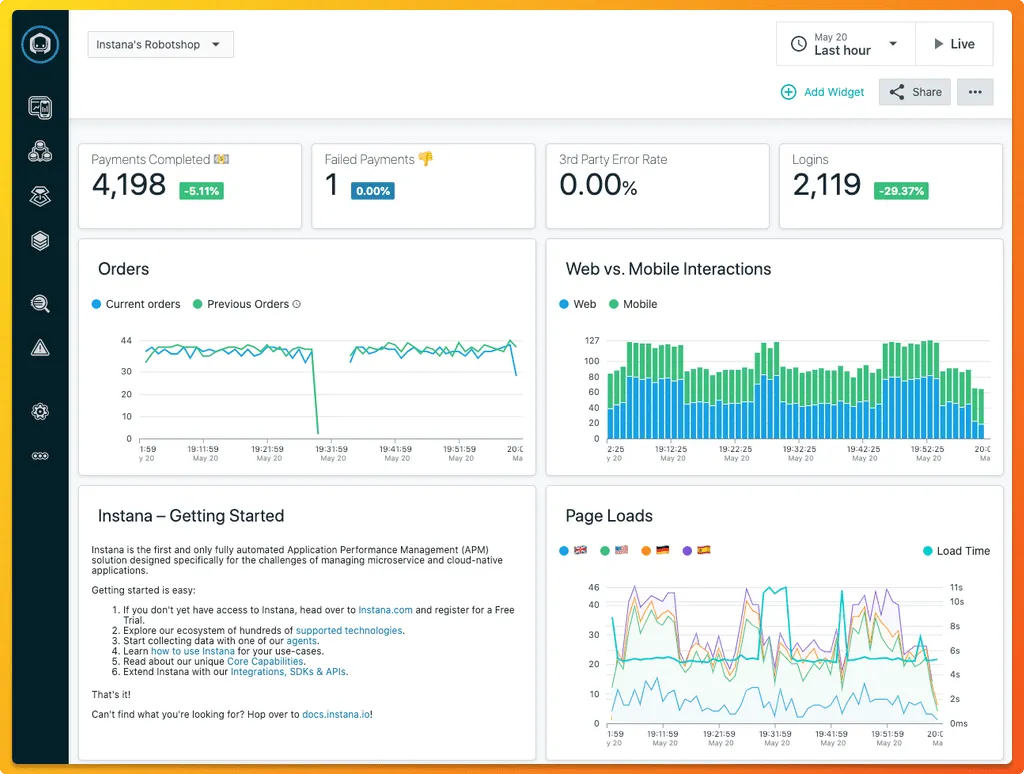
Instana
Instana is an enterprise observability and automated APM tool. It uses an agent to discover and monitor components. This agent needs to be installed on every host that is to be monitored.
The agents deploy sensors crafted to capture data from different technologies. Sensors automatically collect configuration, changes, metrics, and events.
Instana charges $75 per host/per month if billed annually. It also supports open standards like Prometheus, StatsD, OpenTracing, and Opencensus.
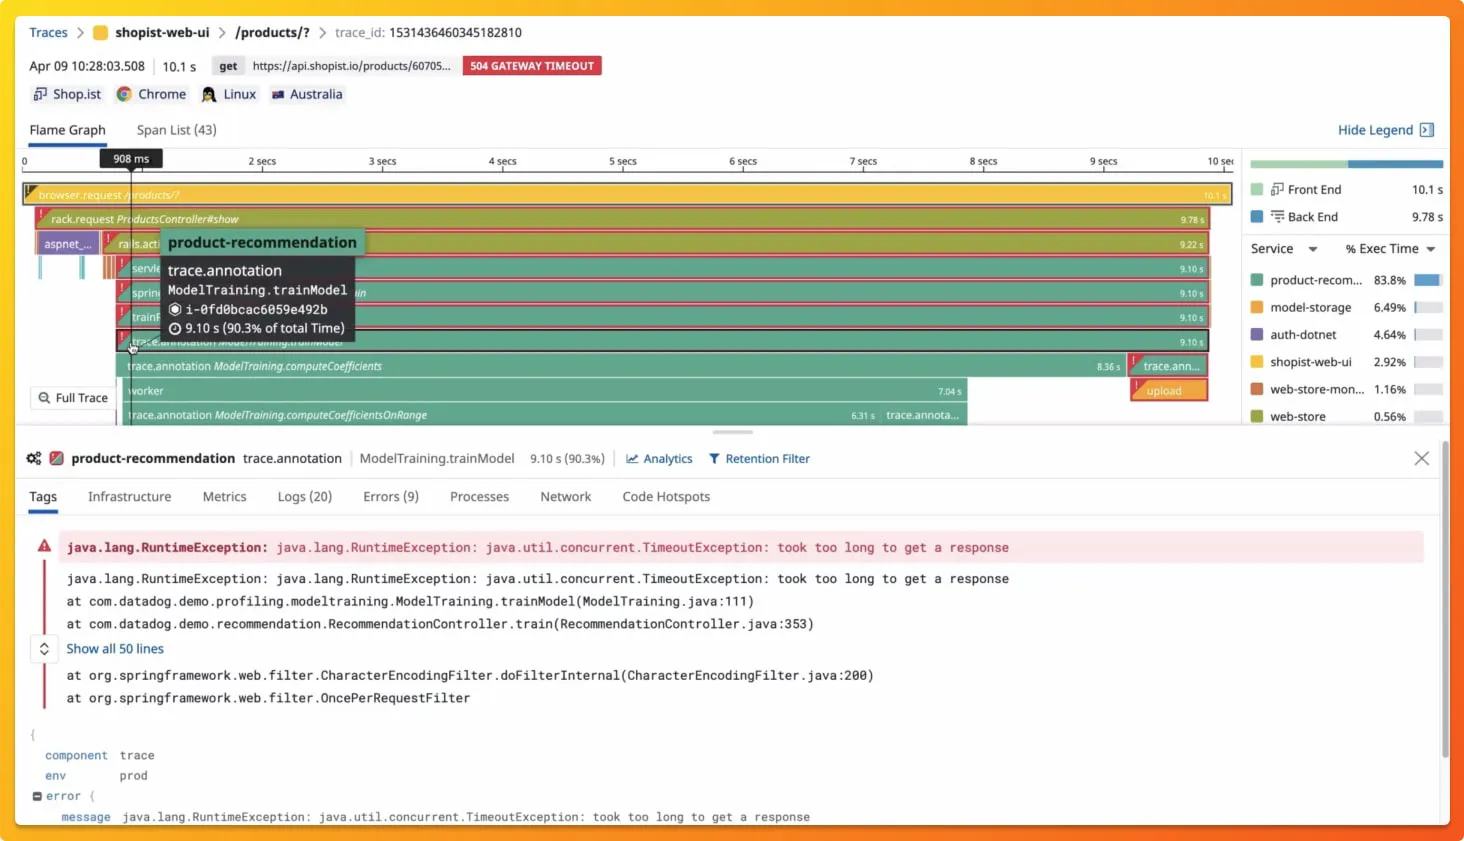
DataDog
DataDog is an enterprise APM tool that provides monitoring products ranging from infrastructure monitoring, log management, network monitoring to security monitoring. Its application performance monitoring tool provides end-to-end distributed tracing from frontend devices to databases.
Some of the key features of the DataDog APM tool includes:
- Out of box performance dashboards for web services, queues, and databases to monitor requests, errors, and latency
- Correlation of distributed tracing to browser sessions, logs, profiles, network, processes, and infrastructure metrics
- Can ingest 50 traces per second per APM host
- Service maps to understand service dependencies
Pricing starts at $31 per host per month if billed annually. It also has an on-demand option which starts at $36.
Prometheus
Prometheus is an open-source tool used to capture time-series data as metrics. These metrics can be aggregated to give insights into the behavior of our systems.
It was initially developed at SoundCloud in 2012 before being released as an open-source project. It was the second project to graduate from CNCF after Kubernetes. Prometheus can only be used to capture metrics, and nothing else.
Prometheus monitoring stack includes the following components:
- Prometheus server
- Client Libraries & Exporters
- Push Gateway
- Alertmanager
- Visualization Layer
The visualization layer of Prometheus is basic, but it is generally used with Grafana, a visualization tool to create charts and graphs.
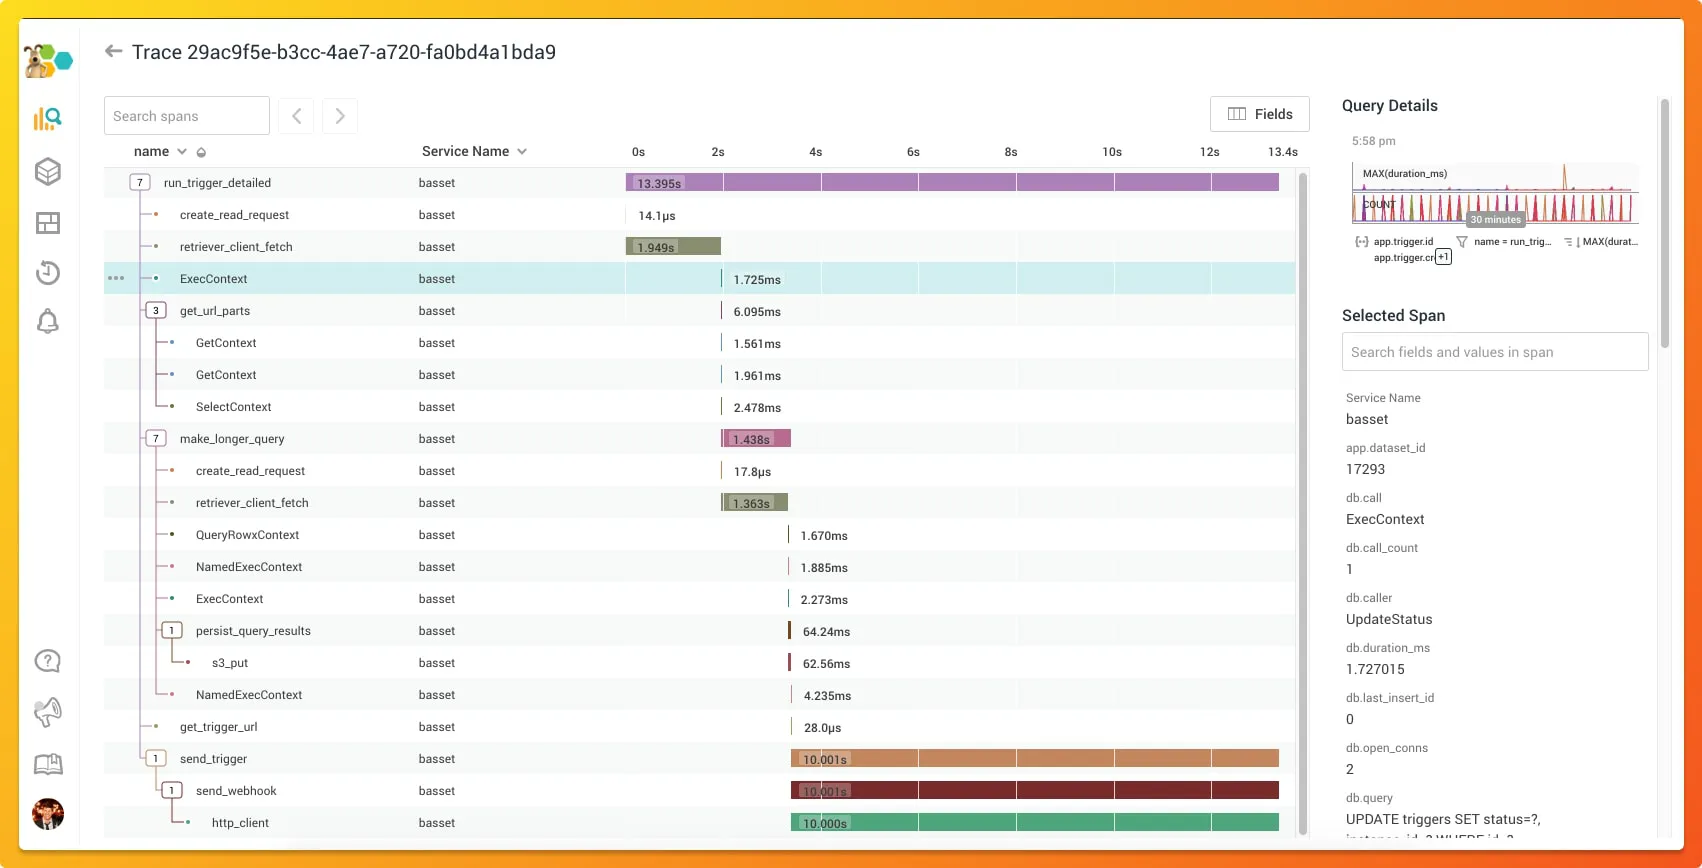
Honeycomb
Honeycomb is a cloud-based APM tool with support for events, logs, and traces. Honeycomb provides an easy-to-use performance monitoring tracing solution.
Some of the key features of the Honeycomb APM tool includes:
- Quickly diagnose bottlenecks and optimize performance with a waterfall view to understand how your system is processing service requests
- Full-text search over trace spans and toggle to collapse and expand sections of trace waterfalls
- Provides Honeycomb beelines to automatically define key pieces of trace data like serviceName, name, timestamp, duration, traceID, etc.
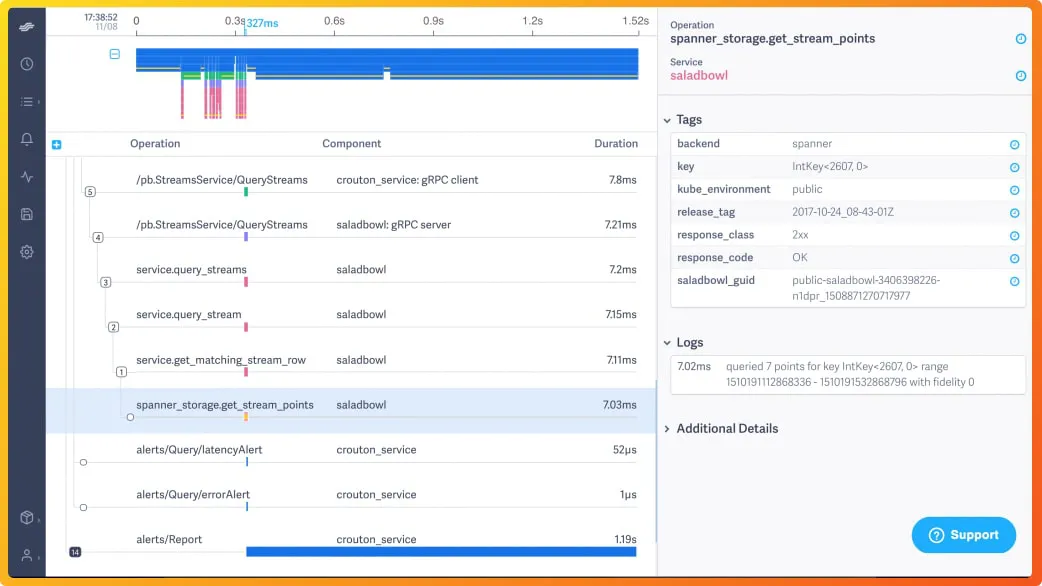
Lightstep
Lightstep is an APM tool focused on distributed tracing. It provides complete visibility to distributed systems based on microservices and multi-cloud environments. It uses open-source friendly data ingestion methods and is built to support applications of any scale.
Some of the key features of the Lightstep APM tool includes:
- Move seamlessly from a high-level view of dependencies to specific services, operations, traces, or any other signals contributing to issues in production
- Provides full-context root cause analysis with exact logs, metrics, and traces to simplify and solve complex investigations
- Auto-instrumentation libraries powered by OpenTelemetry, an open-source standard for code instrumentation
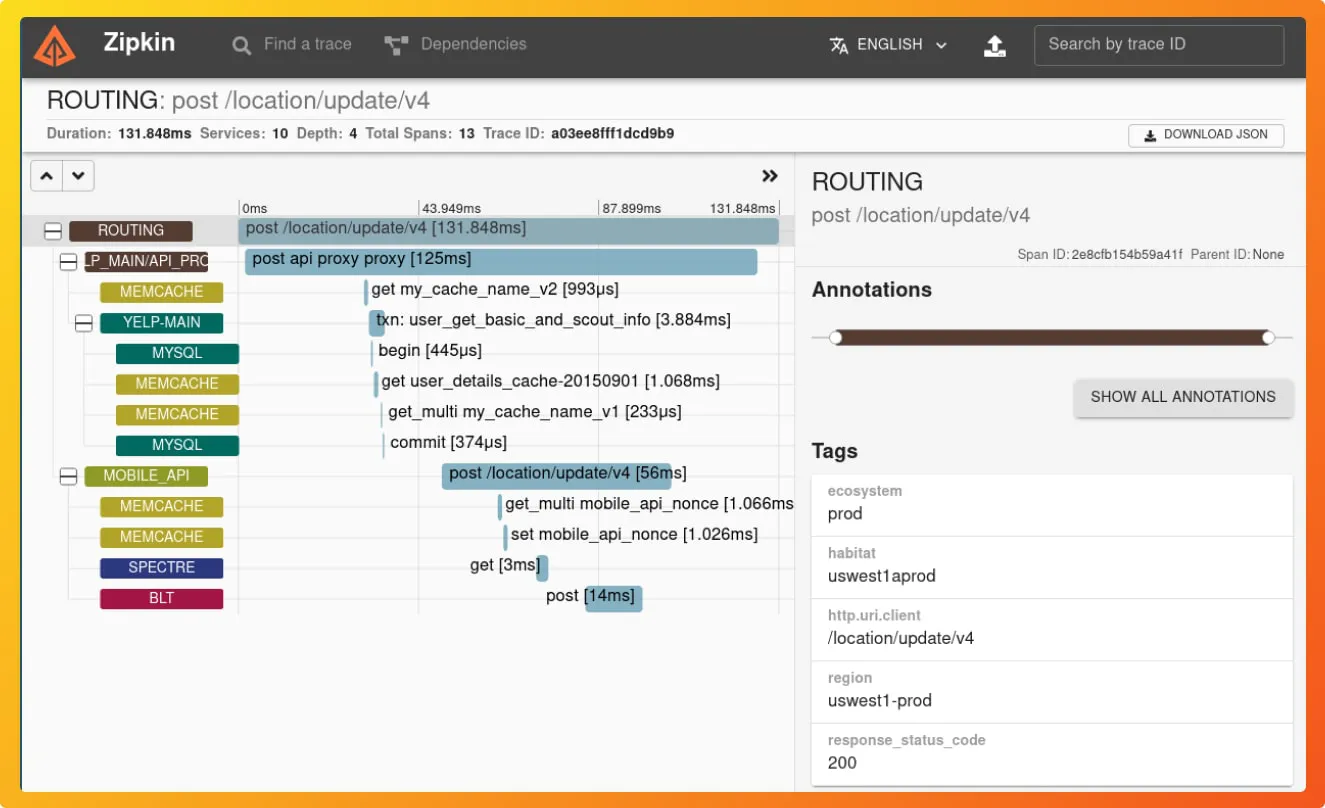
Zipkin
Zipkin is an open-source APM tool used for distributed tracing. Zipkin captures timing data need to troubleshoot latency problems in service architectures. In distributed systems, it's a challenge to trace user requests across different services. If a request fails or takes too long, distributed tracing helps to identify the events that caused it.
Zipikin was initially developed at Twitter and drew inspiration from Google's Dapper. Unique identifiers called Trace ID are attached to each request which then identifies that request across services.
Zipkin's architecture includes:
- Reporters to send data to Zipkin
- Collectors which persist trace data to storage
- API to query data
- UI
Graphite
Graphite is a time-series monitoring tool that was released in 2008. Graphite consists of three software components:
- carbon - a service that listens for time-series data
- whisper - a database library for storing time-series data
- graphite-web - Graphite's user interface & API for rendering graphs and dashboards
The primary purpose of Graphite is to store numeric time-series data and render graphs of this data. Time-series data is a sequence of data points for a particular metric indexed over time. It can give you insights into the performance of any application, process, or service.
Graphite does not do data collection. Instead, your app needs to be configured to send data to Graphite which passively listens for data using Carbon - a Twisted daemon. Carbon then sends the data to Whisper to store the time-series data to a filesystem.
Graphite comes with an in-built UI, but that is fairly basic. Usually, for visualizations, Graphite is clubbed together with Grafana, which is an open-source visualization tool.
Splunk
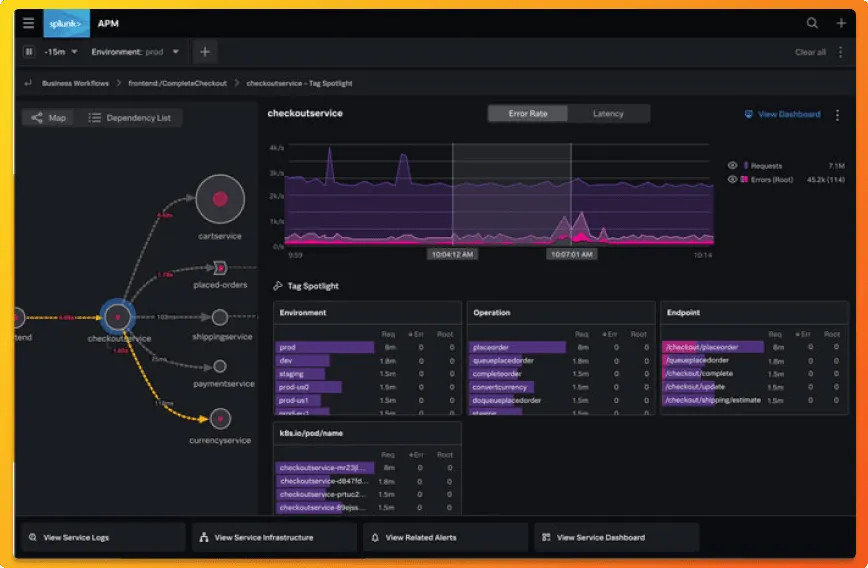
Splunk provides a comprehensive APM tool that is built for cloud-native enterprises. Splunk APM allows you to collect all traces instead of a sample set. It also provides service maps to offer DevOps teams visibility into interactions between different services, dependencies, and performance.
Some of the key features of Splunk APM tool includes:
- Full-Fidelity Trace Ingestion and Retention
- Service Mapping to understand dependency among your services
- Grouping of traces with tags to filter out common business workflows
- Alert system to alert DevOps teams based on static thresholds, sudden changes, or historical anomalies
Splunk APM pricing starts at $55 per host per month, billed annually.
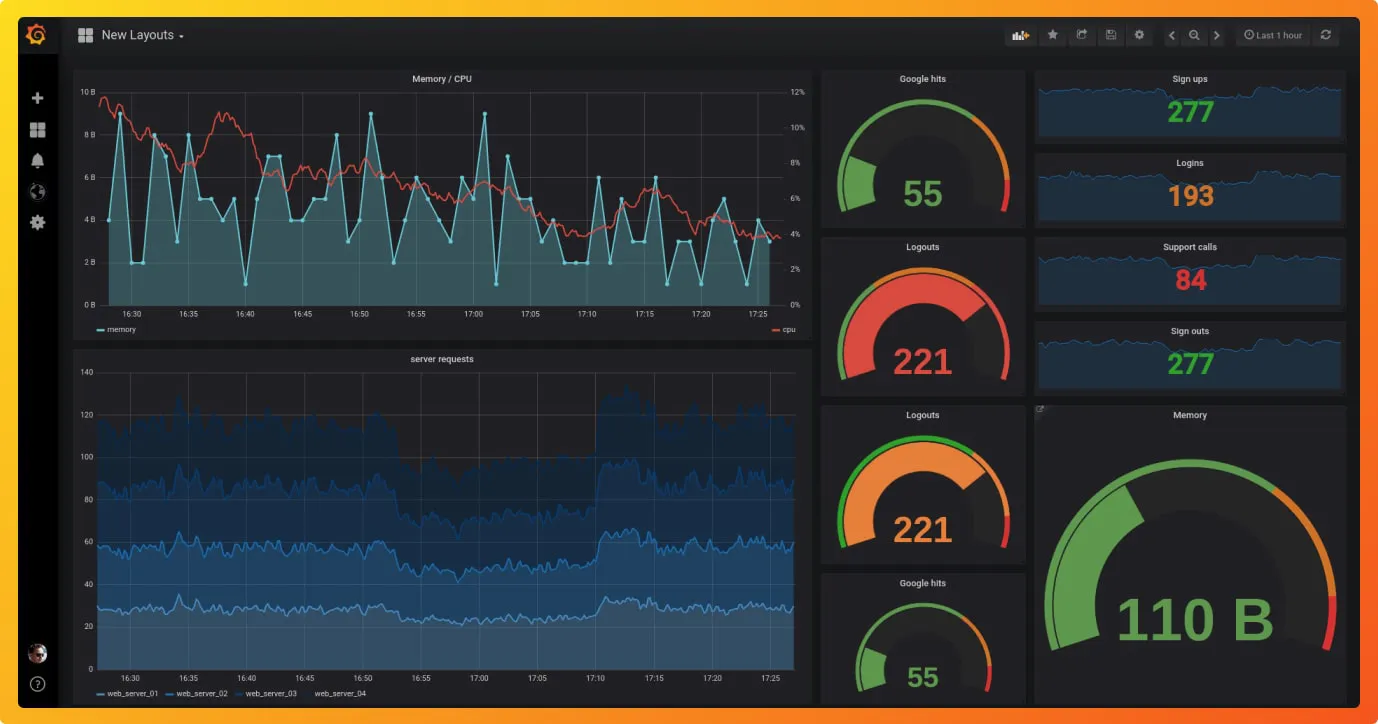
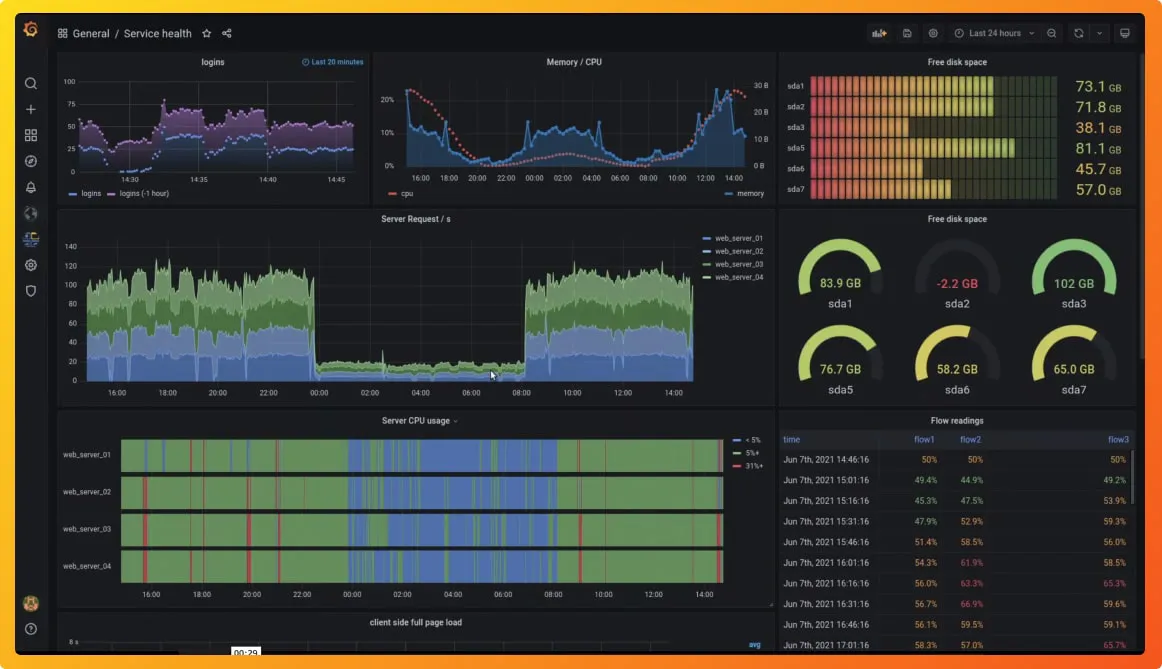
Grafana Labs
Grafana is popular open-source analytics and interactive visualization web layer. It supports many different storage backends for time-series data. It can be connected to data sources like Graphite, InfluxDB, ElasticSearch, Prometheus, and many more. For traces, it supports Jaeger, Tempo, X-Ray, and Zipkin data sources.
Grafana offers plugins, dashboards, alerts, and different user-level access for governance as an APM tool. In addition, it provides two versions of services:
- Grafana cloud - You can send your data to Grafana cloud dashboards. It provides solutions such as Grafana Cloud Logs, Grafana Cloud Metrics, and Grafana Cloud Traces.
- Grafana Enterprise stack - It provides support for metrics and logs with Grafana installed within your infrastructure. It also comes with expert support.
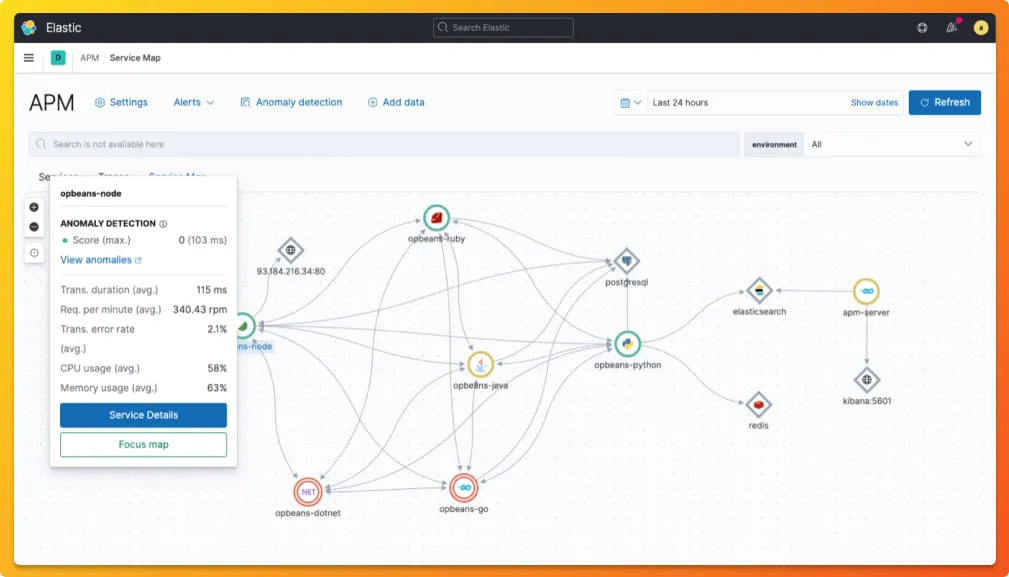
Elastic APM
Elastic APM is an Application Performance Monitoring system built on the Elastic Stack - ElasticSearch, Logstash, and Kibana.
Some of the key features of the Elastic APM tool includes:
- Root cause investigations using ElasticSearch
- Service maps to see how services are connected
- Distributed tracing to identify latency issues
- Anomaly Detection with machine learning
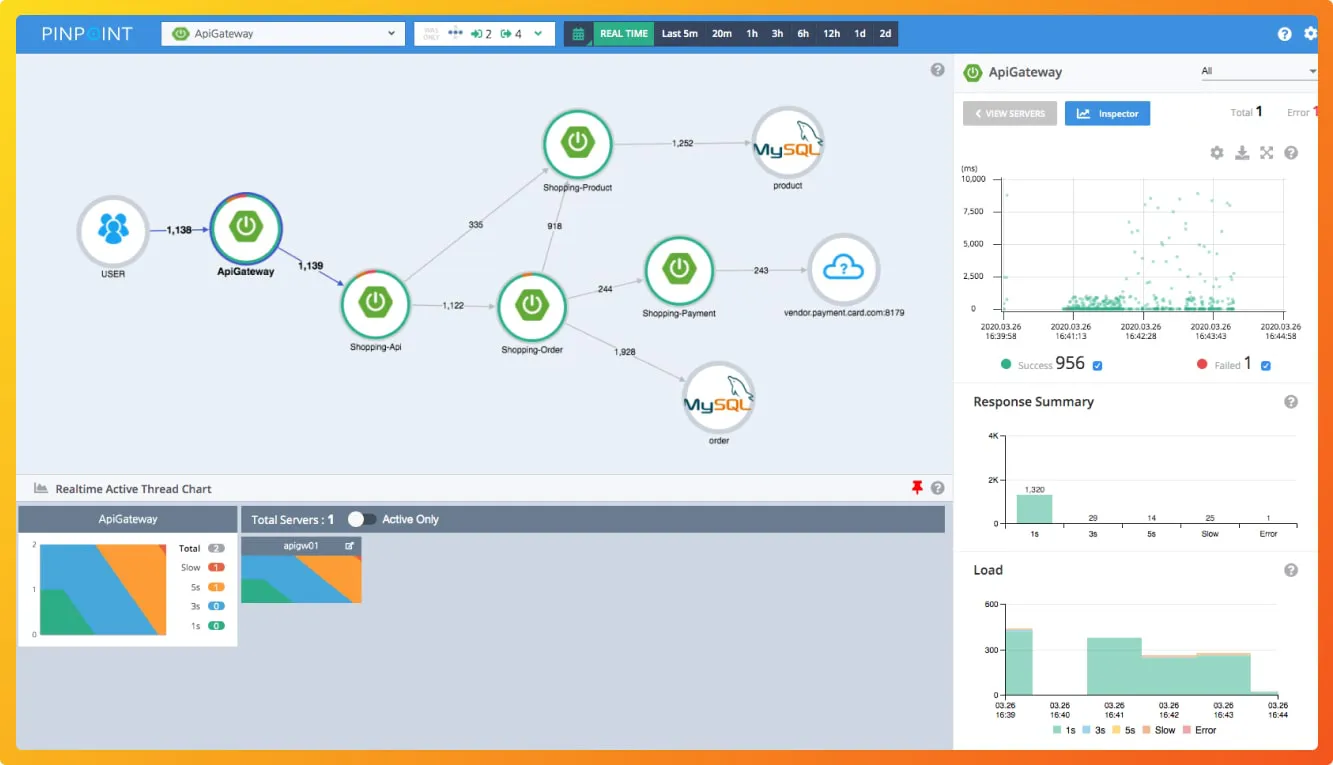
Pinpoint
Pinpoint is an open-source APM tool meant for large-scale distributed systems written in Java, Python, or PHP. This project is inspired and modeled after Google's Dapper. It traces transactions across different components of an application and provides insights to identify potential issues.
Some of the key features of the Pinpoint APM tool includes:
- Application topology at a glance
- Real-time application monitoring
- Code-level visibility to every transaction
- APM agents which require minimal changes to code
- Minimal impact on performance
The main purpose of the Pinpoint APM tool is to identify and track how transactions flow between different components of a system. It does not track logs and metrics.
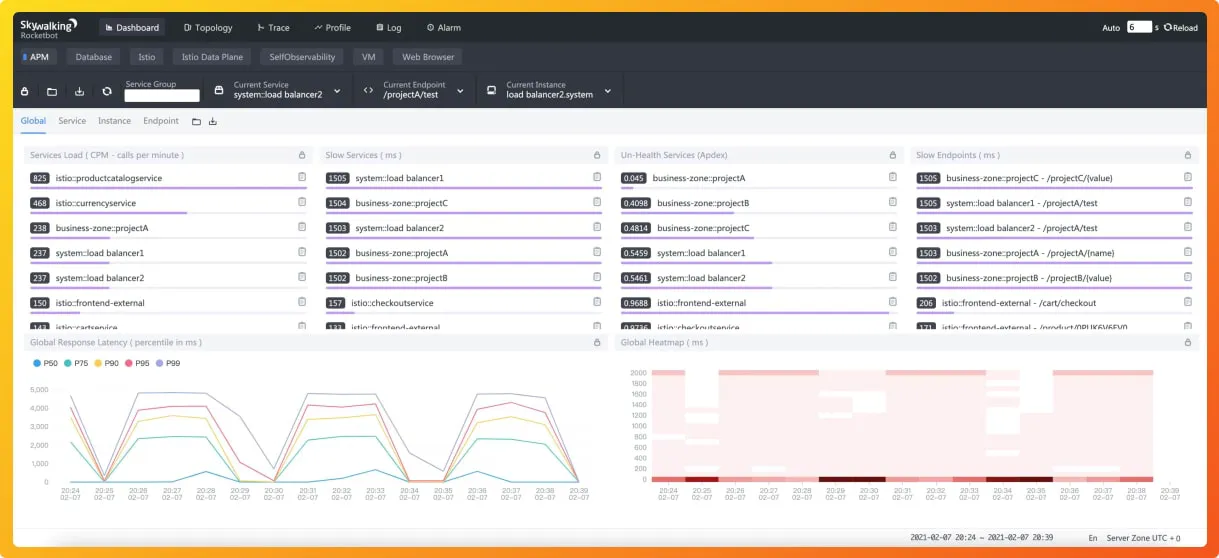
Apache Skywalking
This open-source APM tool is focused on monitoring distributed systems, including microservices, cloud-native, and container-based architectures.
Some of the key features of the Apache Skywalking APM tool includes:
- Service, service instance, endpoint metrics analysis
- Root cause analysis with code profiling
- Service topology map analysis
- Slow services and endpoint detection
- Distributed tracing and context propagation
Skywalking also supports the collection of telemetry data in multiple formats.
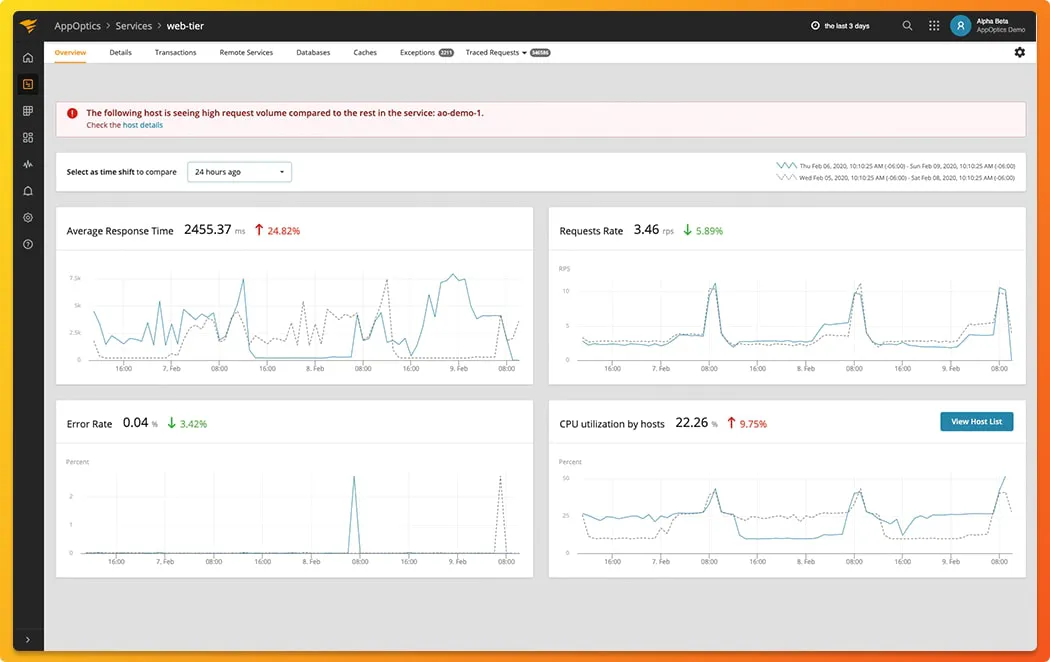
AppOptics (Solarwinds)
AppOptics is a SaaS-based APM tool used for hybrid and cloud-native environments. Some of the key features of AppOptics APM tool includes:
- Language supported: .Net, Go, Java, Node.js, PHP, Python and Ruby
- Application service topology maps
- Identify the root cause of performance issues
- Distributed tracing, host and IT infrastructure monitoring with dozens of integrations
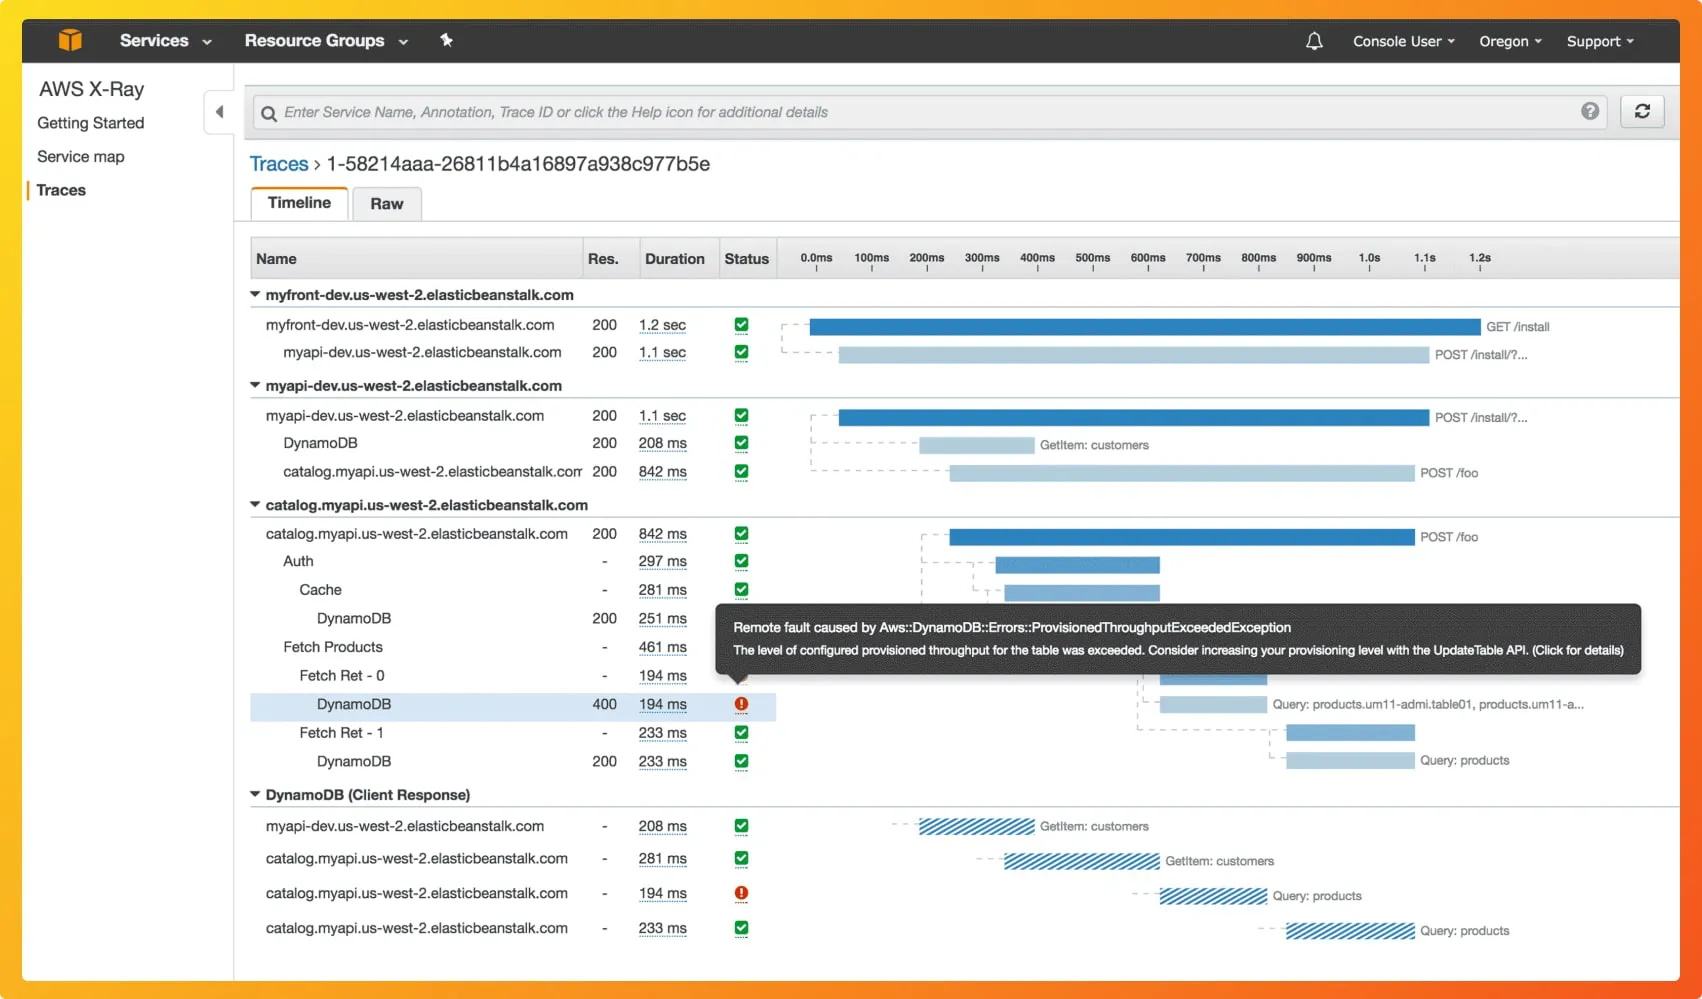
AWS X-Ray
AWS X-Ray helps developers to analyze and debug distributed applications in production. AWS X-Ray can only be used with applications running on Amazon EC2. Using AWS X-Ray, you can identify the root cause of performance issues and errors.
Some of the key features of AWS X-Ray includes:
- Provides end-to-end tracing by gathering data from individual services and presenting a cross-service view
- Service Maps to give you an overview of how services are connected in the application architecture
- Server and client-side latency detection
- Data annotation and filtering to add business-specific metadata to traces
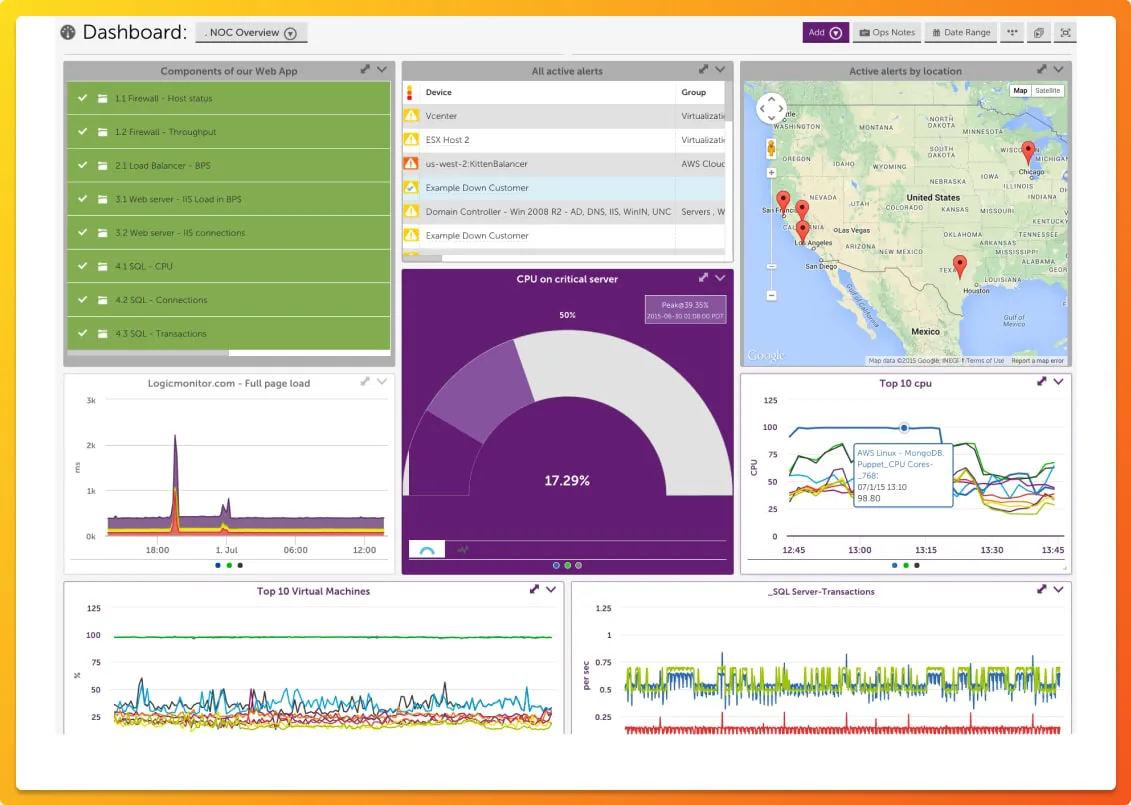
LogicMonitor
LogicMonitor is an APM tool suited for enterprises and MSPs. It provides multiple monitoring services including:
- Infrastructure monitoring
- Cloud monitoring
- Network monitoring
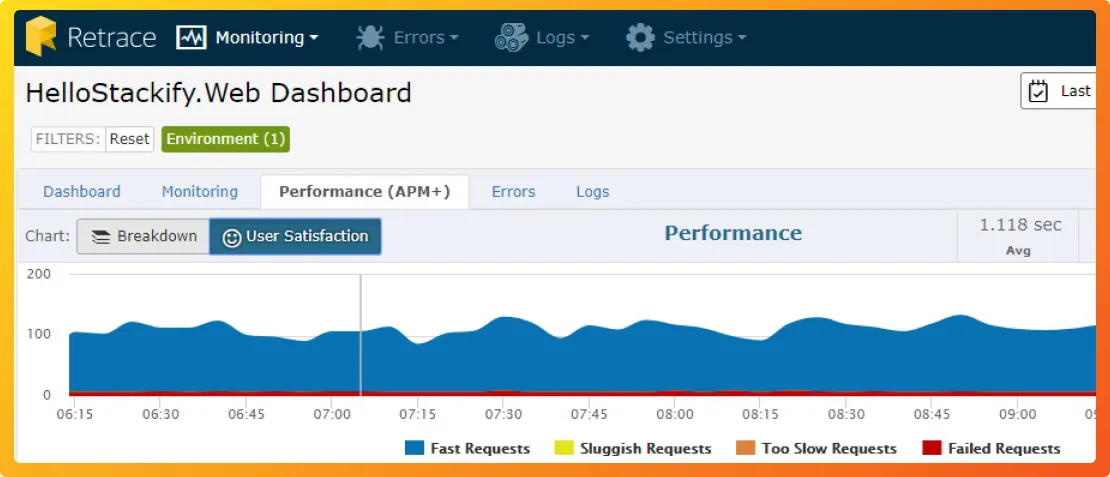
Stackify Retrace
Stackify Retrace is an APM tool that integrates code profiling, error tracking, application logs and more. Some of the key features of the Stackify Retrace includes:
- Language support: .NET, PHP, Node.js, Ruby, Python, or Java stack
- Centralized logging and error-tracking
- Application and server metrics
- Identify bottlenecks in your tech stack by seeing top web requests, slow web requests, SQL query performance
How to choose the right APM tool for you?
APM tools are now a critical service for any digital business of decent size and scale. User expectations are sky-high, and a few milliseconds can cost you millions in revenue. APM tools provide engineering times the right insights to resolve issues quickly. A robust modern-day APM tool can also help engineering teams to be proactive about identifying potential bottlenecks.
In our view, APM tools should be developer-first tools. As developers directly utilize these tools in critical situations, the codebase of the tools should be open-source. Open-source is the future of all software tools.
Transparency and collaboration are some key benefits of open-source software tools. Developers want to see the code first hand, and if there are issues they want to address, they prefer to reach out to an active developer community than a customer support team.
At the same time, most open-source tools don't provide the same user experience as provided by SaaS vendors. But it doesn't have to be that way. With that objective, we created SigNoz.
SigNoz is a full-stack open-source application performance monitoring and observability tool. It provides a unified UI for both metrics and traces. Log management is also in the product roadmap and will be launched seen.
You can check out SigNoz's GitHub repo here 👇
If you're specifically looking for distributed tracing tools, have a look at top 11 distributed tracing tools.
