We often get asked, what's the best place to get started with OpenTelemetry - host metrics, traces, or even logs?
Hosts Nočnica Mellifera and Pranay will talk about taking your first steps to gathering OpenTelemetry data
Below is the recording and an edited transcript of the conversation.
Find the conversation transcript below.👇
Nica: Good morning, everyone. This is the next in our OTel webinars. The topic for today is “Getting Started with OpenTelemetry”. A large audience for these webinars has been the SigNoz community, and this may be a little more basic than what the community needs.
If you are already considering dashboards and how you store your data, this may not be the information you need. However, I am joined today by Pranay, co-founder of SigNoz. Pranay, what do you hope people will take away from this starter guide?
Pranay: We decided to create this guide because we saw that many people in the SigNoz community already understand what OpenTelemetry is and have been using it. We also run an OpenTelemetry end-user group for the APAC region, and we see that many people have initial questions like, "How do I get started with OpenTelemetry? Is the log stable? How do I start sending my application tracing data?"
These are the basic questions that any team needs to answer before investing in OpenTelemetry. So, we thought we would create a guide that covers some of the more basic topics so that people who are just starting out with OpenTelemetry can get an overview and a sense of where the project is headed. We will then go back to more technical questions in the future.
We plan to alternate between more technical questions and more beginner-friendly ones so that people who are just starting out with OpenTelemetry have something to work with.
Nica: It has been interesting for me to learn about the availability of beginner and advanced information for OpenTelemetry. OpenTelemetry is not intended as a beginner's tool, but rather as a tool for those who need to do distributed tracing through complex architectures. Since its inception, much of the material has started by diving deep into the topic.
Speaking of more advanced topics, I wanted to answer a question that was asked in chat: "Hey, we talked about Kafka with OTel in the later webinar, when's that going to happen?" The webinar will be held next month because we are going away for our whole staff meeting. I will announce the date and time in the topic and message you directly when we are ready. We wanted to do it this week, but it turned out to require a little more research.
I think I now know most of how to do it. I may or may not go and do all the work to set up a local Kafka queue to test it out, but that is a more advanced topic. I would love to talk about it, especially as it relates to sending OpenTelemetry data into a queue within your network. Nishant has just mentioned that the live webinar hours are not great for us, and we will be shifting those around a bit.
Yes, I do want to make it possible for people from all over the world to join our webinars. I am located on the west coast of the United States, so this time slot is ideal for me. However, I may start offering an evening time slot in the future.
Pranay: I believe that this webinar was primarily focused on our community in the US. We will explore options for India or the APAC region ecosystem in the future.
Nica: If you are watching this webinar replay, please feel free to comment below with your questions. We will answer them as we go along. So, let's get started.
So, a pretty common question that we see, especially people who are dipping into the OpenTelemetry, "What's the first thing that you should instrument withOpenTelemetry?" Now in my presentation, I have an answer to this, but I'm curious Pranay, how you would answer this question of what's the first thing you'd instrument?
“A common question, especially among new DevOps engineers or SREs who want to add some observability: “What’s the first thing I should instrument with OpenTelemetry”
Pranay: Indeed, it depends on who is asking the question. For an application developer, the most interesting thing might be APM, or application performance monitoring. If you are writing code and want to understand whether your code is performing well or has high latency, you might start with APM or distributed tracing to see the latency of your APIs. Are your database calls or external calls taking longer than usual?
However, if you are part of the platform team or DevOps team, the first thing you might want to look at is infrastructure metrics. These are the most important metrics to track, as they can tell you whether your machines are running smoothly and whether your CPU, memory, and other resources are being used efficiently.
Configure some alerts on top of that, and so it depends really on the person who is trying to get started the OpenTelemetry. If you're a JavaScript developer, you can instrument your NodeJs application and just get started with the latency.
Nica: I concur. Indeed, there are people who are currently evaluating a full migration to OpenTelemetry. They are trying to determine whether it is better than the closed-source SaaS tool they are currently using. In this case, it may make sense to focus on the type of application performance metrics or APM that they will be getting.
It is important to answer this question early on, because if they are fundamentally unable to do their jobs without automatic instrumentation of a particular Java method, then this may be a deal-breaker for them.
I think I'm going to briefly step through this just because it's kind of a basic idea of what is and isn't inside the OpenTelemetry project.
The first thing to look into with Open Telemetry is Infrastructure metrics. After all it's free.
-CPU usage, RAM, disk I/O metrics
I recommend starting with infrastructure metrics if you want to understand the OpenTelemetry project. Do not start with Kubernetes by trying to spin up five namespaces that talk to each other through a synchronous data store. Instead, start with something that is easy to debug, easy to look at, and where data collection will work right off the bat.
The OpenTelemetry collector is a good choice for this because it is well packaged and easy to run anywhere. It is also easy for the collector to gather basic host metrics, and the OpenTelemetry operator can grab a bunch of info metrics off of your cluster easily. In short, start with something simple and easy to manage, and then work your way up to more complex systems.
I also appreciate these metrics because the purpose of these metrics is obvious when thinking about them. This may seem like a basic concept, but I believe it is worth discussing that, when considering something like a CPU, all of the OpenTelemetry processor steps are easy to understand.
Why do we do things a certain way? Do we want to average across? Do we want to report every X number of cycles? Do we want to average across that cycle, or do we want to report each time we have a report within there? Do we want to add up that value or not?
It is easy to see that we do not want to add up the amount of RAM that we are using. However, we will be able to solve some basic questions. One thing that I have seen is that even trying to make those very basic dashboards make sense and be useful in the long term is a challenge in itself.
I have observed that some people have expressed concern about setting up alerts for memory usage when they upgrade their memory later. They worry that they will start receiving alerts when they are only using 50% of their memory, simply because they have allocated more memory.
This should encourage you to think carefully about all the steps involved in gathering metrics and sending them out. It is worth taking the time to do this properly.
Once we have collected the data, we need to decide where to send it. This is where I would like to discuss what is and is not included in the OpenTelemetry project.
I believe that even for those of us who are already using OpenTelemetry, it would be beneficial to review what is and is not included in the project. Pranay, did you have anything to add about gathering information metrics or things that people should think about on day one or day two?
Pranay: Yes, I think a general piece of advice is that if you are starting to use a new project or tool, the easiest way to get started is often the right way. You can start with the basics, such as understanding what the project does. This is very easy to do, and once you have done that, you will start to see some of your data in a dashboard. This will give you more confidence.
So I think what you said was very accurate, that you should start with infrastructure metrics. This is easy to do, most people know how to do it, and by playing around with it, you will learn some of the OpenTelemetry ecosystem. You will also have some success under your belt, so you can say, "Okay, I know how to configure infrastructure metrics, now let's move on to application metrics."
Nica: I am tempted to open up the collector diagrams from our previous webinar to illustrate a point. I have seen people dive in and grab the SDK, only to realize that the SDK allows them to feed in the endpoint they are sending each metric call to directly. They then drop lines into their Java code to send the data across the wire and hard-code the URL of where they want to pick up the OpenTelemetry data.
This does not make a lot of sense. It would be much better to have a collector running within the pod, within that architecture, that would then send on the data.
It is not necessary to send a web request every time a metric increments. It is acceptable to have blind alleys and say, "We pursued this for a little while, but it turned out not to be the right way to do it."
However, I believe that this is another reason why I encourage thinking about host metrics or info metrics first. This will allow you to establish the collector and ensure that it can send data to whatever kind of data backend you want to set up. Then, when you instrument your application code, you will simply be talking to the collector that you have already set up. This is much easier.
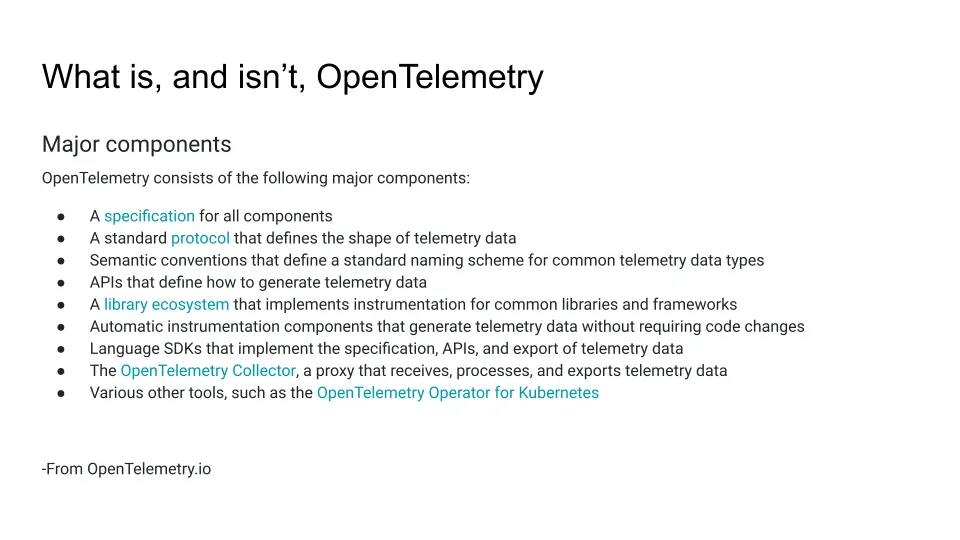
OpenTelemetry is a project that provides:
- A specification for all components, including a standard protocol that defines the shape of telemetry data and semantic conventions that define the standard naming scheme for common telemetry data types. For example, the naming standard would specify whether duration is labeled in nanoseconds or microseconds.
- APIs that define how to generate telemetry data. These APIs would allow developers to send telemetry data to the Collector.
- A library ecosystem that implements instrumentation for common libraries and frameworks. This is critical, as it allows developers to instrument their applications without having to write their own instrumentation code. OpenTelemetry is not a tool or a framework. It is a project that provides the building blocks for other tools and frameworks.
So, that’s better and worse in different languages I won't even say better and worse, it is more and less automatic in different frameworks, and that's usually pretty rational to how those frameworks work, right? Java is notoriously very easy to automatically instrument because you can do it at build time and bytecode manipulation to do this kind of stuff.
And then others are more difficult. Automatic instrumentation components that generate Telemetry data without requiring code changes.
What is a set of libraries to say, "Hey, you can just make a call right from your Ruby code or right from your Java code” to say “I want to send this metric, I want to log this line, I want to add this span to a trace." But then also want automatic instrumentation and then language SDKs implement the specification APIs and the export of telemetry data.
So these are kind of a Troika there and then The OpenTelemetry collector, a proxy that receives processes, and exports telemetry data. So a question I used to get all the time is, "Can we do this without the collector?" And the answer is, technically yes, but you're hurting me by doing this. You're causing me harm, and that's kind of what I was referring to as generally a process with no collector or with a collector.
You know, just the SigNoz collector or just telemetry hub's collector or just the honeycomb collector, but you're sending data straight out from your code, that nobody's gonna tell you to do that.
So, it's okay for your tests on your Dev environment, and then Various other tools such as the OpenTelemetry operator for Kubernetes. That's the list of what is inside the project. I think it's interesting that auto instrumentation is inside the project, but data backends, as we're going to talk about, are not inside the project.
Pranay: Yeah, I think one of the core parts here is defining the specs and the APIs. So that's an independent part of what the project defines, and then it also provides an SDK, which sort of implements it.
So that you can get started very quickly, and they have, by default, auto instrumentation components so that you don't have to worry too much about “Are you instrumenting the right libraries, or are instrumenting the right frameworks”
You install that auto instrumentation SDK, and then it will automatically detect the libraries for which there's OpenTelemetry instrumentation available and then install those libraries. That's, I think, pretty powerful.
Primarily if you look into OpenTelemetry, it's got two parts. One is specs and APIs to send data, and the second part is the OpenTelemetry collector. So broadly speaking, these are the two big pieces, and in the specs and APIs to send data, there are multiple languages and frameworks, which implement each language. So that's how broadly how I see the scope for OpenTelemetry.
Yeah, absolutely. And so if you're having trouble sending data from your language, that is something that should be handled within the project. And in general, all the way out to REST, in terms of obscurity, not the REST obscure, REST is great, we love you so much, REST. But you know, this is covered, the sending of data, "Hey, I want to go in and edit my code and send application data," is covered.
I will be curious, I don't know about auto instrumentation in REST projects, but you know, certainly that level of, "Hey, I can make calls right from my code where I'm not having to go to negotiate an HTTP connection to send my metrics data," that should all be handled.
Okay, so this gets me to this slide about “Then you need to send your data somewhere”. So that's, I think, the thing that stands out as being outside of the project and is actually on that page, is the next thing, it's, "Hey, how the data is stored, particularly and how it's presented to you”, are not part of the project. So, you know, a counter-example is Jaeger, which covers things end to end.
So it's, "Oh, you can run a Jaeger server which will store data, which will present those traces to you." But again, that's very tracing-specific. It's not necessarily for all types of data, but yeah, that's a different project's spec.
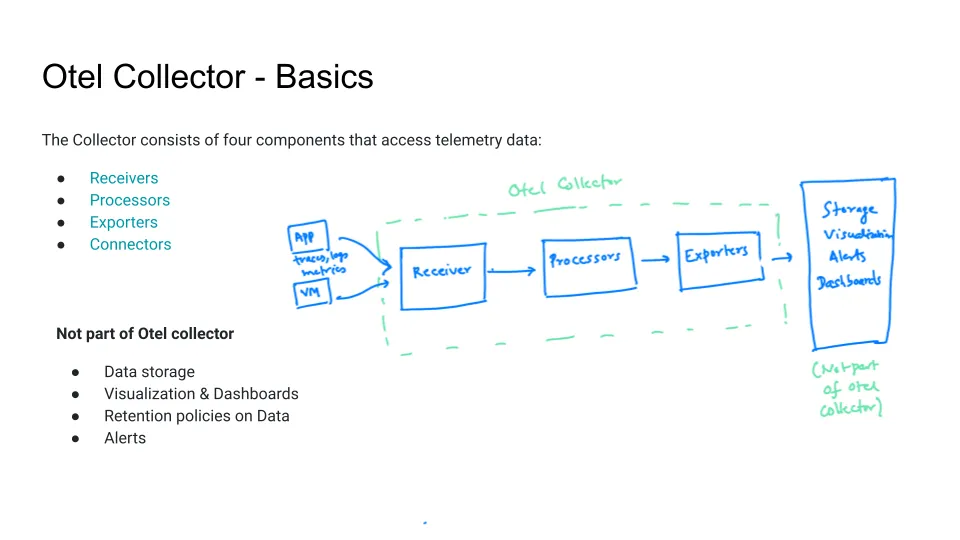
So here we go with that conceptualization. This is from last week's webinar to think about “What is part of the OpenTelemetry collector?” Where you say, "Hey, it's doing these three steps to your data, but they're still going to need some kind of storage background and also some kind of query and visualization thing.
The big one is these three steps. Let's talk about that for sure.
Receivers, which is the ability to pick up data, let's put it into the OpenTelemetry collector. There's a big project around that. We'll talk about that more in a minute.
Processors are a few things at a basic level, compression and batching of data, but also things, "Hey, I want to pull out personally identifying data, I want to normalize, I have two services; they're implemented a little differently, I want to normalize that data a little bit." Things like parsing, where you have unstructured logs; you want to do some parsing of that data before you send it on.
And then finally, the exporter is, "Where's it gonna go?" Which can be very simple. It could be just, "Hey, that's just going to go right into another OpenTelemetry collector or a sort of OpenTelemetry ecosystem."
But obviously, the closed-source boys are still out there. The SaaS people are still out there, and so they have their exporters and you absolutely can say, "Hey, I have a great experience with collecting this data, but I love this existing SaaS tool so much," and they will certainly accept that data from you. And there's pretty broad acceptance of that. I would say, where's the export? You can't do it.
My understanding is that you can't move your distributed trace into AWS X-Ray, for example, into some of the cloud-specific monitoring tools. But that limitation probably would make some sense. Obviously, for any large observability platform, those exporters exist.
Pranay: I'm also not sure. I think the key point here is that some things are not part of the OpenTelemetry project. For example, the visualization layer, alerts, setting dashboards, setting retention policies, and for that, you use a backend like SigNoz or any other SaaS vendors or tools like Grafana, etc.
Some of the time I see people getting confused, "Hey if I use OpenTelemetry, do I also share dashboards?" So that's not really in the scope of the project.
Nica: And so, we don't cover very much in this talk, but, while it's very straightforward to use a tool SigNoz or Prometheus or Grafana, to do a basic dashboard and say, "Hey, I'm going to track the CPU metrics," it's a good place to start.
I think we can all understand that then you get to more advanced cases, and you're gonna want to evaluate a tool or two, right? To look at, does it give me the data that I need? What are we using from our observability tools now, and where do we want that to go?
Once you're collecting these hosted infrastructure metrics, a good second step is thinking about logging.
And again you can have your path through here, but just it's worth considering, thinking about how we're handling logging. It should be pretty doable as a project, and you can also use some of that collector power to do some of your log parsing which might improve your experience a little bit.
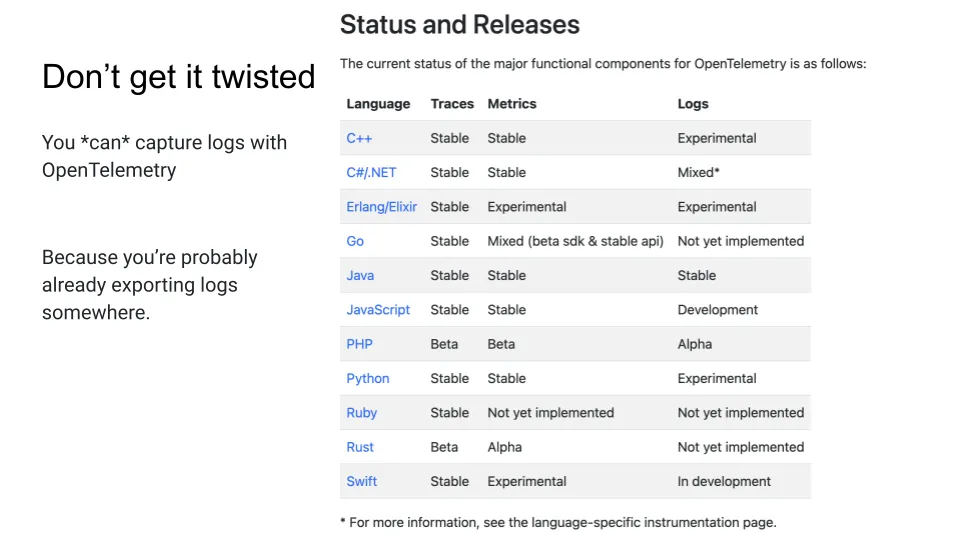
Now I want to make one note here. This is my first big mistake when I started writing about OpenTelemetry about three and a half years ago. I'm not sure the exact time that was, but I said, "Well, you might not want to do this because logs are not yet implemented." And I think I saw just as this is the current version of the status chart and "Oh, and metrics are not implemented, Ruby's not ready for Prime Time.
The metric situation is a little complicated on Ruby, and I'm not good to speak to that, but the logs are what we're talking about here because this sort of makes it look as if you have Ruby or you're on Rust or what have you, that you have no support for sending in your logs to this OpenTelemetry endpoint.
But that's probably not the case, right? So, the issue here is we’d like to have full SDK support within each of these frameworks, to be able to say, "Okay, from the start, I'm going to do OpenTelemetry logging, so I'm going to install the Ruby OpenTelemetry SDK and make a call to that SDK every time I want a log", which would be rad, and I agree, we'd to see that implemented.
But you are already sending your logs somewhere. I hope your logs are not just getting dumped into the console and killing your instance. So, given that you've already done that work, again, there's that thing with the collector, right? That it has its ways to import data. It has multiple projects to import data. If you look at the contrib repo for the OpenTelemetry collector, you can look at these receivers.
Link - https://github.com/open-telemetry/opentelemetry-collector-contrib/tree/main/receiver
There are tons for whatever logging tool that you may wish. So, the point is that if you are sending logs currently by some method, there's the free level of Splunk that sends logs, and there's absolutely a way to grab those logs and it's supported by Splunk.
They're, "Hey, you can send these logs anywhere”. Of course, you can send them to the OpenTelemetry collector.
Pranay: I think the two modes of sending logs are always available. One is writing something in a file and then reading from those files. So, there's a file log receiver in OpenTelemetry, which you can always use.
OpenTelemetry also supports these log collectors, for example, I think they support FluentD, Fluent Bit, and Logstash. So, if you already have a pipeline set up with any of these three log collectors, you can configure the OpenTelemetry collector to get logs from there.
You don't have to do any work, you just can start configuring whatever is configured in your log collector, so you can just start sending that data to the OpenTelemetry collector.
So, Nica was pointing out that OpenTelemetry official site lists as logs are not implemented, saying “Is there a Ruby SDK to send logs directly?” But as you know, there are other ways to send logs.
Nica: It is crucial to be aware that there are more options available than simply using the SDK. It is very likely that you already have some kind of logs exported. If you do not, and you are starting from scratch, doing this as a student, or your observability efforts are a bit of a technical debt, you can absolutely do it. You can write your logs to a file, read from them, batch them with the collector, and send them out.
However, you are probably already sending logs somewhere, and you should be able to leverage that. Conceptually, the goal of OpenTelemetry is to provide a unified way to collect and export telemetry data, regardless of the source. This means that you should be able to use OpenTelemetry to collect logs from any source, even if it is not currently supported by the SDK.
Pranay: There's a question
Can you say that it's another SIEM tool alternative to Splunk?
Nica: I do not know the definition of SIEM, so now I want to know that.
Pranay: I'm going to take this up.
Nica: Security Information and Event Management. Go ahead.
Pranay: OpenTelemetry is not primarily focused on security. Splunk, for example, has an observability product and a security product. However, OpenTelemetry's primary focus is on observability, which is ensuring that production systems are running smoothly and debugging issues quickly.
The data that OpenTelemetry SDKs send, such as tracing data, can be used for more advanced security analysis. For example, if you see a certain type of payload in trace data, you can analyze it to determine if it is a security vulnerability.
The data is there, but the project is not currently focused on security use cases. The vendors are also more focused on observability. Therefore, OpenTelemetry is not currently suitable for security use cases.
Nica: Yeah, I would say, in terms of just using the OpenTelemetry project to do a ton of security, you're not gonna have some of the things you would expect as you have in a basic security tool.
I just wanted to point out this talk from Ron Vider at Oxeye, who is using OpenTelemetry to do security monitoring, and there are some other examples out there.
Talk link - https://www.youtube.com/watch?v=hz3ncpPKzUs
The OpenTelemetry community is doing very innovative work with context propagation. Many of these tools also work with other context propagation tools, such as Jaeger. These are interesting use cases that are not part of the core OpenTelemetry project.
If you join the CNCF Slack or the SigNoz Slack or other communities where OpenTelemetry is discussed, security is not likely to be the first topic of conversation. However, it is an important consideration.
That's a great question. Thank you so much.
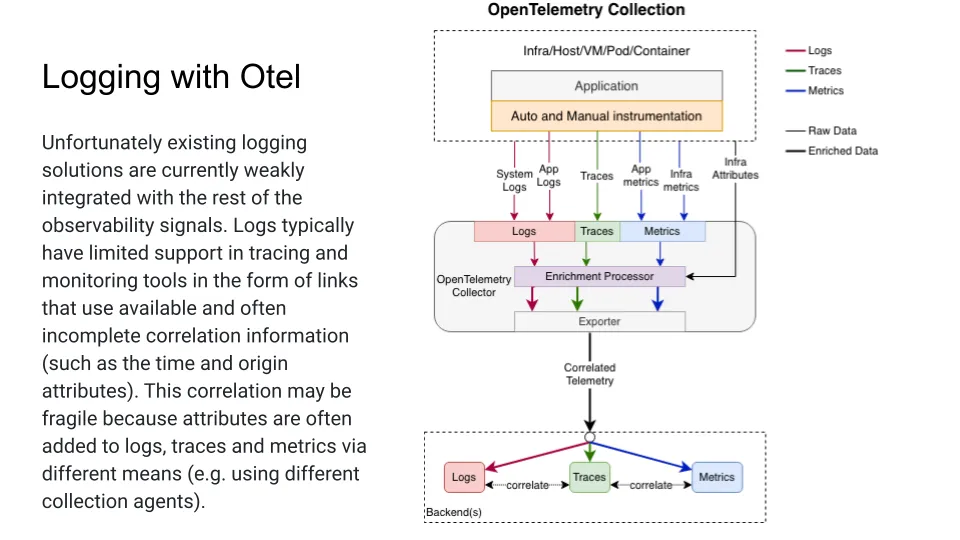
Unfortunately, existing logging solutions are currently weakly integrated with the rest of observability. SigNoz logs typically have limited support in tracing and monitoring tools in the form of links that use available and often incomplete correlation information. This correlation may be fragile because the attributes are often added to logs, traces, or metrics via different means, e.g. using different collector agents.
The current state of logging is discussed in this section. It is noted that the current state is rather basic, and that there is no need to go into every step of the chart. However, the idea is that it would be beneficial to have a more cohesive solution for tagging all of the parameters on logs.
This would allow for logs that are not just structured, but that are also implicitly connected to both the time spans of tracing and the metrics that are being gathered. In other words, consistent naming and consistent structure of event data would be desirable.
And so, this is a little bit of vision for the future and also why it may make sense, even if you're doing a little bit of work right now for logging that feels almost the repetition of what you've done before, connecting a logging tool. It may make sense to be thinking about OpenTelemetry in the future.
Pranay: I would like to add that it is now possible to add log data to traces. While the other way around is not as simple, it is still possible to add trace data to logs. We recently shipped a feature in SigNoz that allows you to view related logs on a trace page.
This is possible because if you pass the context of the log to the trace, you can determine which logs were emitted during the request propagation of the trace. This information can be viewed by simply clicking a link.
I encourage you to check out this feature in SigNoz. I believe that the project is headed in a positive direction because it has defined a uniform resource layer and a concept of baggage, which allows for context propagation across signals, metrics, traces, and logs.
I believe that the project is headed in a direction where it will be able to correlate metrics, traces, and logs much more deeply. One way that this can be achieved is through the use of resources.
Nica, this would be a good topic for you to discuss, as you are familiar with how resources work in OpenTelemetry.
I think any OpenTelemetry native tools like SigNoz, will be leveraging those features to make this much easier, correlation across SigNoz.
Nica: I believe the fundamental challenge is in connecting the dots when someone says, "We gather or show you OpenTelemetry data." There should be a clean, correlated telemetry signal. However, this is a difficult task.
I want to remain unbiased in this discussion. SigNoz does not have a monopoly on a good way to do this. However, I believe it is important to be aware that some very large, very expensive SaaS tools are not OpenTelemetry. I am willing to be biased in favor of the OpenTelemetry project because these tools struggle with this.
This is not a solved problem. Someone can say to you, "Single pane of glass," and charge you ten thousand dollars a month for SaaS tools, and then say, "Well, if your logs are connected, they'll show up here for your trace, right?"
But will they be connected every time? No, sometimes the logs will be connected correctly, but not always. So, I think that's just something to be aware of.
And so, yeah, thinking about distributed tracing and context propagation across that stack, we got there to talk about a little bit. But yeah, that's something to be talking about coming soon in future webinars.
Pranay: In our previous discussion, we thought that a webinar on Kafka could focus on sources, context propagation, and correlation.
Nica: It would be interesting to discuss what context propagation enables. The starter is saying that it enables you to connect your logs across the stack and know when a trace occurred, which is especially important for getting accurate information and connecting it to other data.
I agree with what they mentioned in the write-up. It would be worth discussing this topic in a future webinar. There is a lot to talk about with OpenTelemetry, and it is new territory for many people, which we find exciting.
Okay folks, please follow our channel if you would like to see more of our content. If you are watching this on replay, we would like to thank you for watching the previous episode. Many of you did, and we appreciate your support.
Please feel free to leave a question in the comments below. We will get back to you and answer all of them. Thank you so much for joining us, and we hope to see you again soon.
Pranay: Thanks for joining. Goodbye.
Thank you for taking out the time to read this transcript :) If you have any feedback or want any changes to the format, please create an issue
Feel free to join our Slack community and say hi! 👋