JSON Logs: Examples, Benefits, and Best Practices
JSON (JavaScript Object Notation) is a lightweight data-interchange format that has gained widespread popularity in recent years due to its simplicity and flexibility. It is easy for humans to read and write and for machines to parse and generate, making it a great choice for transmitting data in web applications.
Logs serve multiple purposes for application developers. They are essential to understand what's happening in your application. Modern-day software systems emit millions of log lines per minute. While they contain a lot of useful information, managing log files and log data at such a scale is not easy.
One of the important aspects of managing log data is choosing a log format.
Common Log File Formats
Some of the common formats for log files are as follows:
-
Plain Text
Plain text log files are simply a collection of ASCII characters. While plain text log formats are easy to read, it's difficult to set standard queries to process them. -
CSV (Comma Separated Values)
CSV logs help structure log data as a series of comma-separated values. It is often used in cases where log data needs to be imported into another system. -
XML
XML logs use tags for marking different fields in the log message. -
Syslog
Syslog is a standard protocol for logging system events. Syslog logs have a standard format with a set of predefined fields like timestamp, hostname, log levels, etc. -
JSON format
JSON log formats contain a series of key-value pairs where each log message is a separate object. Let's discuss JSON logging in detail.
What Are JSON Logs?
JSON logs are log messages that are formatted as JSON objects, with each log message represented as a separate object. This allows log messages to be structured and easily searched, filtered, and analyzed.
Benefits of Using JSON Logs
There are several benefits to using JSON format for your logs. Some of them are as follows:
Easy to read and understand
JSON logs are formatted to be easily digestible by human eyes in a series of key-value pairs. For example, a log message might include a "user ID" field to indicate which user was involved during that log and a log levels field to indicate the severity of the log message.
Easy to parse and analyze
JSON logs are structured in a way that log management tools can parse them easily. A log analytics tool like SigNoz can help you filter JSON format logs by different fields. You can filter your log message by severity level and create visualizations to help you understand the patterns in your log data.
Allows flexibility in adding more input
You can add additional data in JSON logging very easily. For example, you might include data about the user who triggered the log message, the server that generated the message, or the request that caused the message to be generated. This flexibility makes JSON logs a good choice for logging in complex systems where you need to capture a lot of detail.
JSON Logging Best Practices
Have a consistent structure
Having a consistent structure in your logging format will make it easier to extract and analyze the data you need. For example, you might define a set of standard fields that you include in every log message, such as "timestamp", "level", and "message".
Keep log messages concise and informative
At scale, log data can be humungous. So you should always try to strike a balance between providing enough information to be useful and not overwhelming the reader with unnecessary data.
Use appropriate data types
JSON supports a variety of data types, including strings, numbers, booleans, and null. Use the appropriate data type for each field to ensure that your logs are easy to parse and analyze.
Use a JSON linter
Use a JSON linter to check your JSON code for syntax errors and formatting issues. A JSON linter is a tool that checks your JSON code for syntax errors and formatting issues. Using a linter can help you catch mistakes and ensure that your JSON logs are well-formed and easy to read.
Use a log management tool
If you are working with a large volume of JSON logs, it can be helpful to use a tool like SigNoz. SigNoz can help you search for specific log messages, filter log messages by severity level, and create visualizations to help you understand the patterns in your log data.
JSON logging is a powerful and flexible tool for logging in web applications. By using a consistent structure, keeping log messages concise and informative, using appropriate data types, and using a JSON linter and log management tool, you can get the most out of your JSON log files.
JSON Log Examples
Here are some examples of JSON logs:
This log message includes a timestamp, a level (indicating that it is an error message), a message describing the error, a request ID, and a user ID.
More JSON Log Examples
Here are some examples of JSON logs:
This log message includes a timestamp, a level (indicating that it is an error message), a message describing the error, a request ID, and a user ID.
{
"timestamp": "2022-12-23T12:34:56Z",
"level": "error",
"message": "There was an error processing the request",
"request_id": "1234567890",
"user_id": "abcdefghij"
}
This log message includes a timestamp, a level (indicating that it is a warning message), a message describing the warning, and data about the available and total memory on the server.
{
"timestamp": "2022-12-23T12:34:56Z",
"level": "warning",
"message": "Low memory warning",
"free_memory": 456,
"total_memory": 1024
}
This log message includes a timestamp, a level (indicating that it is an informational message), a message describing the event, a user ID, and data about the user's web browser.
{
"timestamp": "2022-12-23T12:34:56Z",
"level": "info",
"message": "User logged in",
"user_id": "abcdefghij",
"user_agent": "Mozilla/5.0 (Windows NT 10.0; Win64; x64) AppleWebKit/537.36 (KHTML, like Gecko) Chrome/87.0.4280.88 Safari/537.36"
}
This log message includes a timestamp, a level (indicating that it is a debug message), a message describing the event, a server ID, and the start time of the server.
{
"timestamp": "2022-12-23T12:34:56Z",
"level": "debug",
"message": "Server starting",
"server_id": "abcdefghij",
"start_time": "2022-12-23T12:30:00Z"
}
These are just a few examples of the types of data that you might include in JSON logs. The specific data points will depend on your needs and the nature of your application.
Using a Log Management Tool for JSON Logs
Why do we need a log management tool?
A log management tool is used to collect, process, and analyze log data. A log management tool can help you centralize your logs, provide real-time analysis, set alerts, and make useful visualizations.
JSON logs combined with a good log analytics tool can help you query and filter out log messages quickly.
SigNoz is a full-stack open source APM that you can use to process your JSON logs. SigNoz uses a columnar database ClickHouse to store logs, which is very efficient at ingesting and storing logs data. Columnar databases like ClickHouse are very effective in storing log data and making it available for analysis.
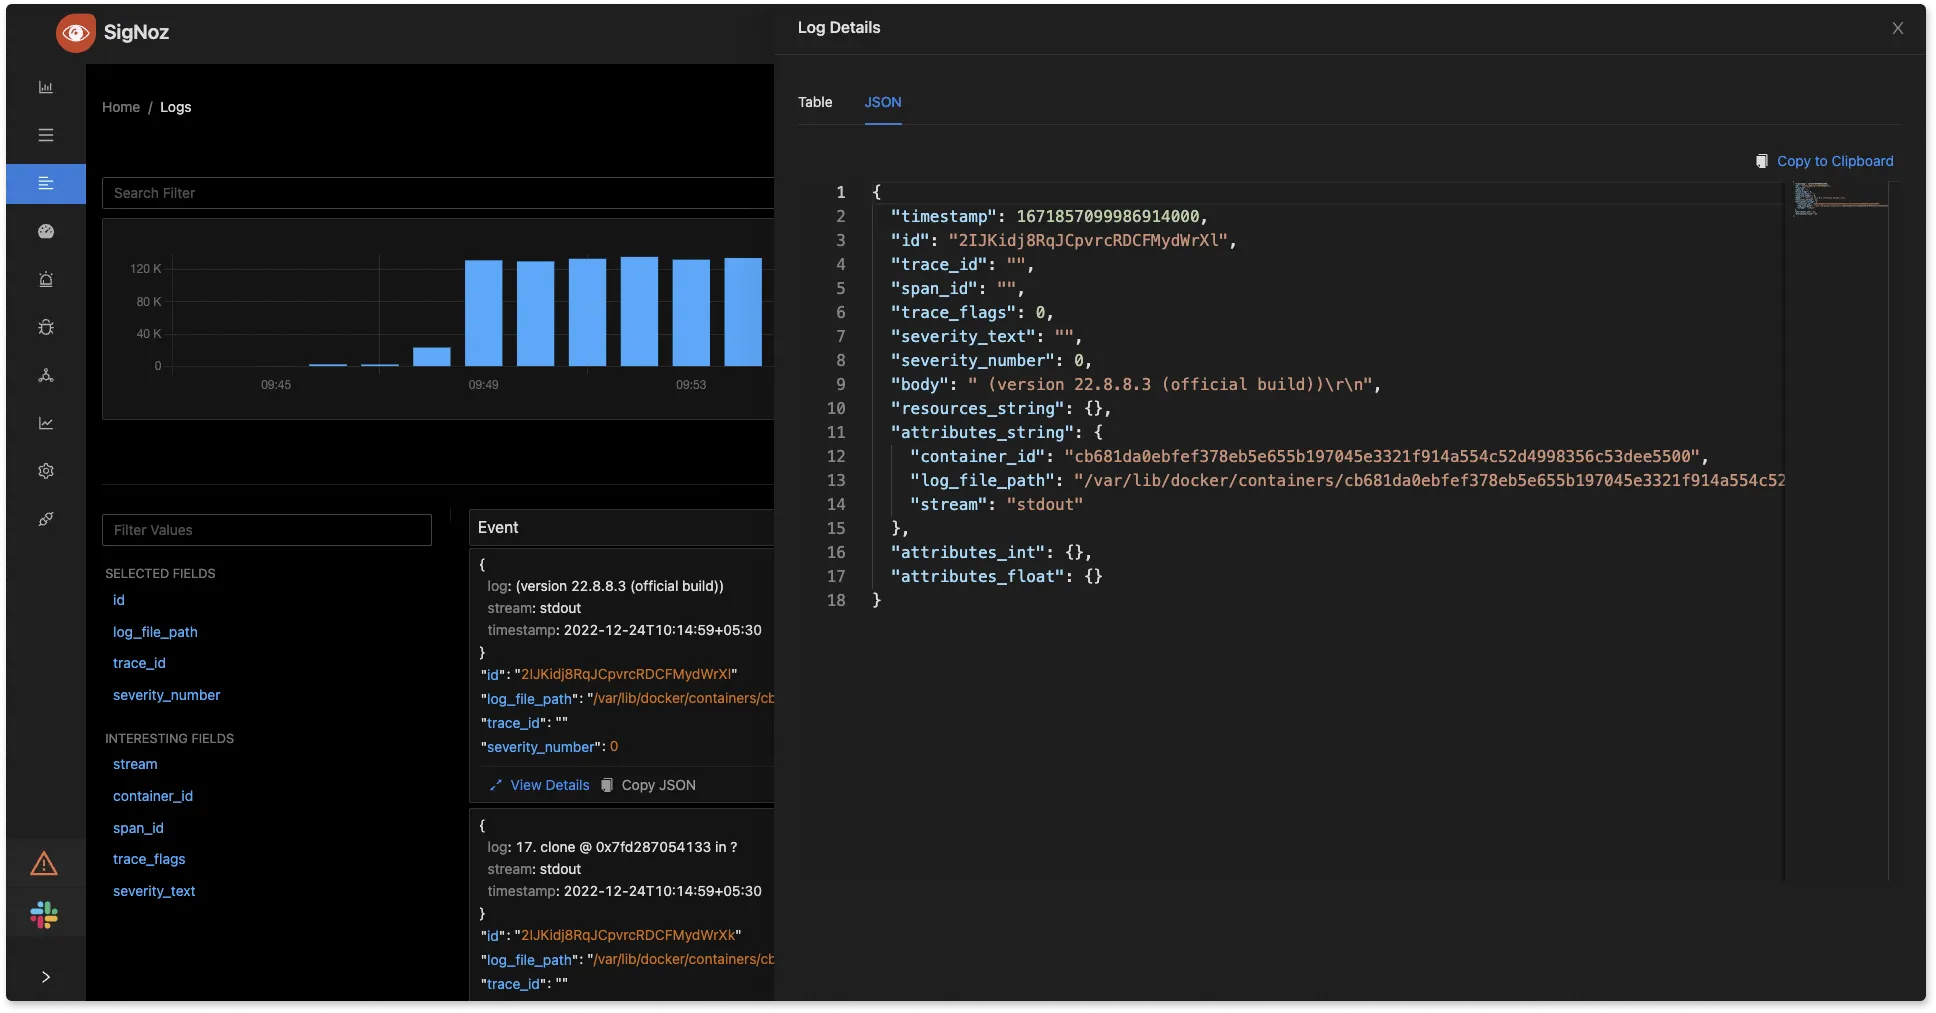
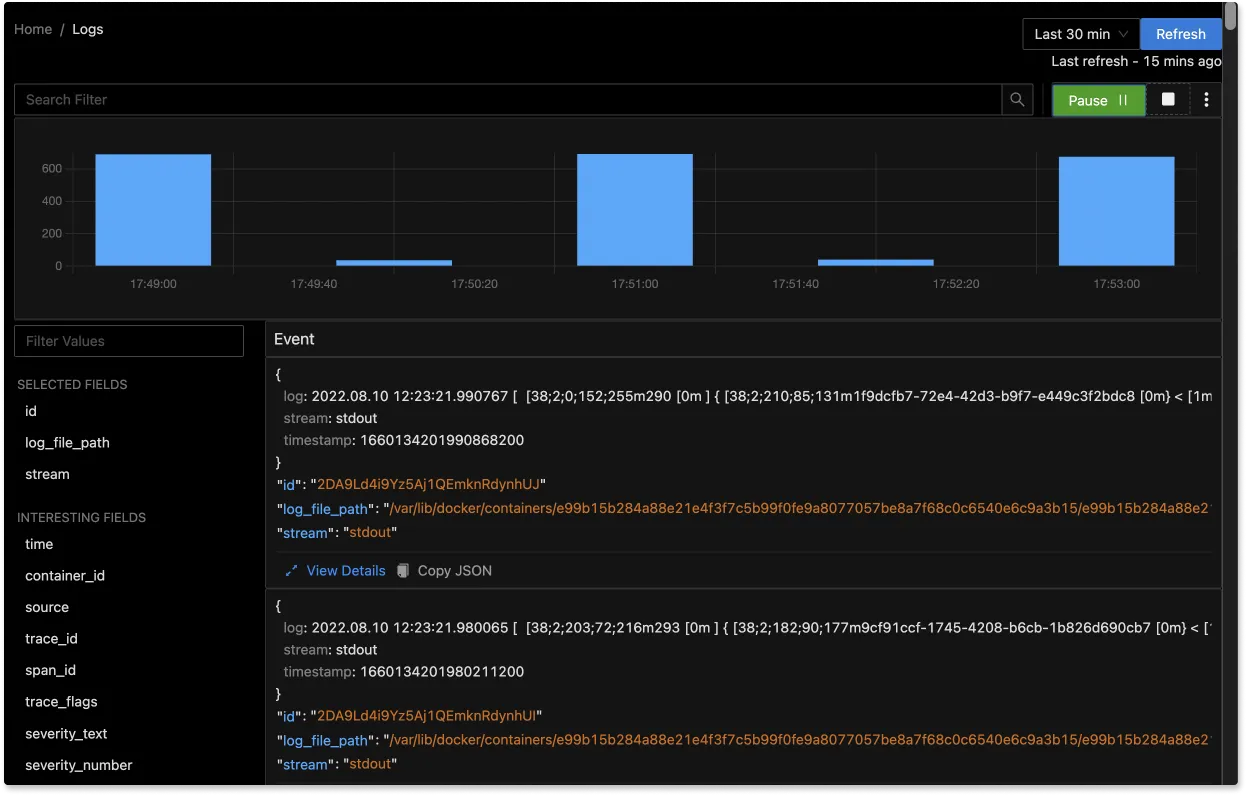
The logs tab in SigNoz has advanced features like a log query builder, search across multiple fields, structured table view, JSON view, etc.
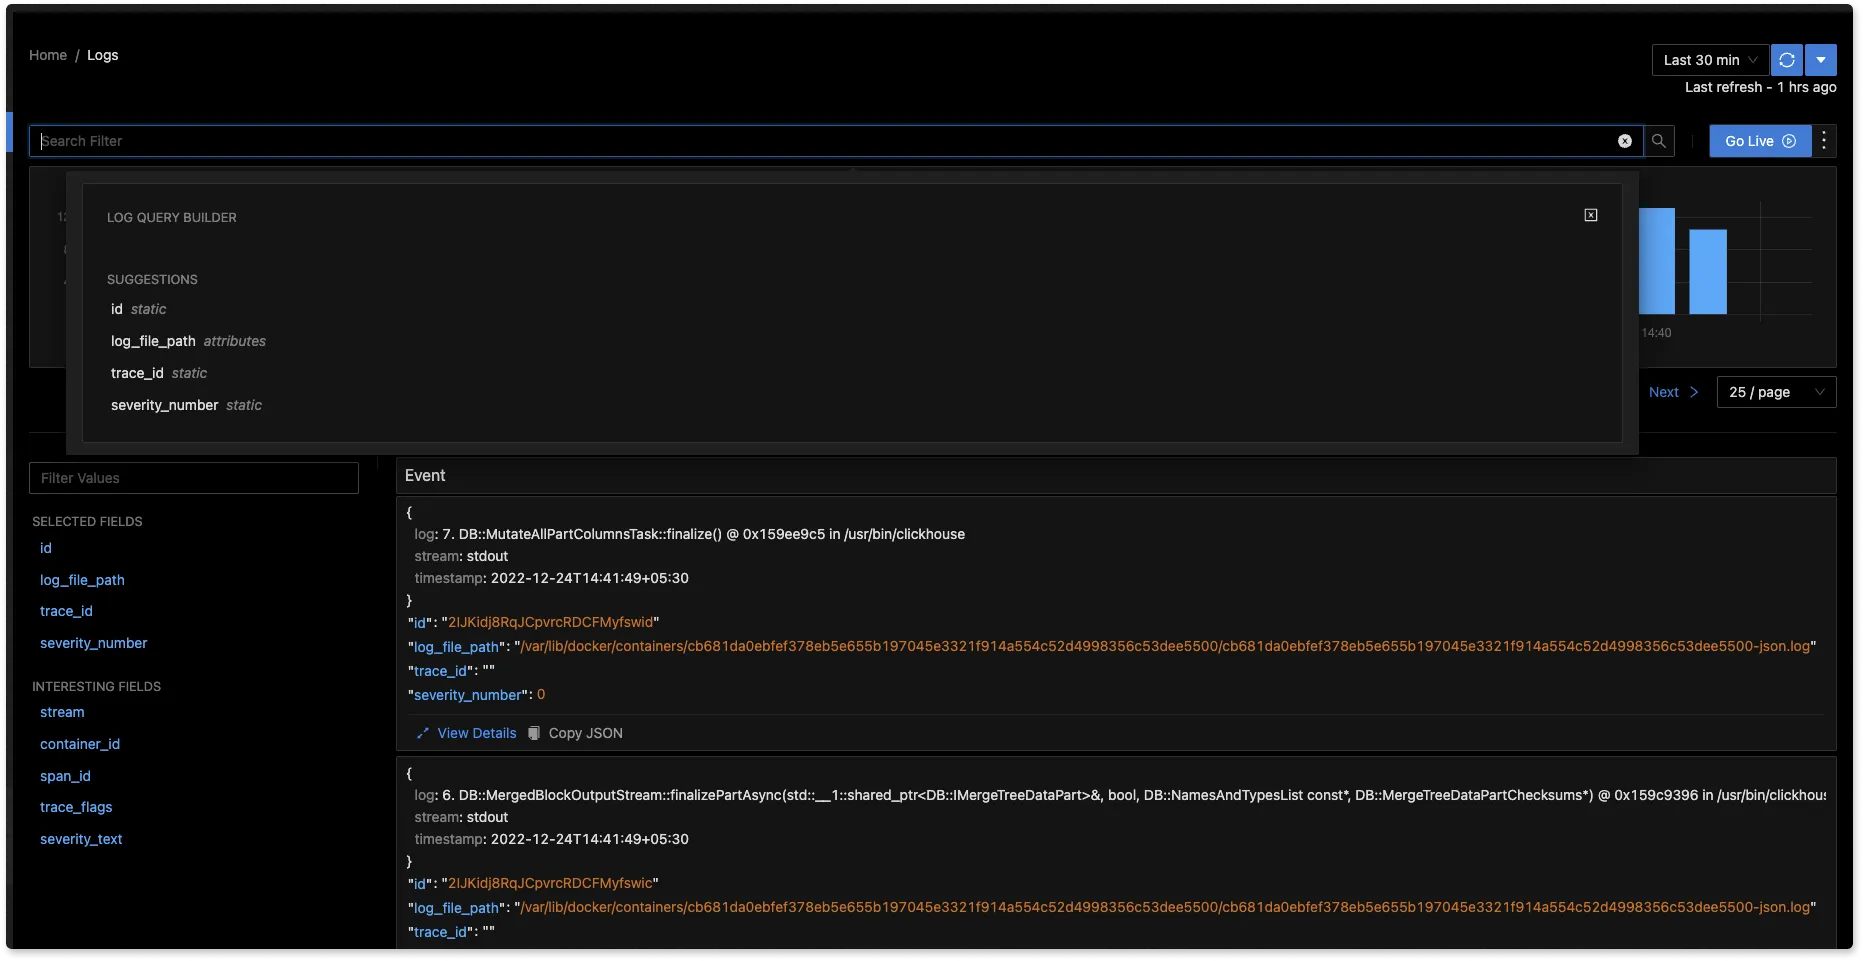
You can also view logs in real time with live tail logging.
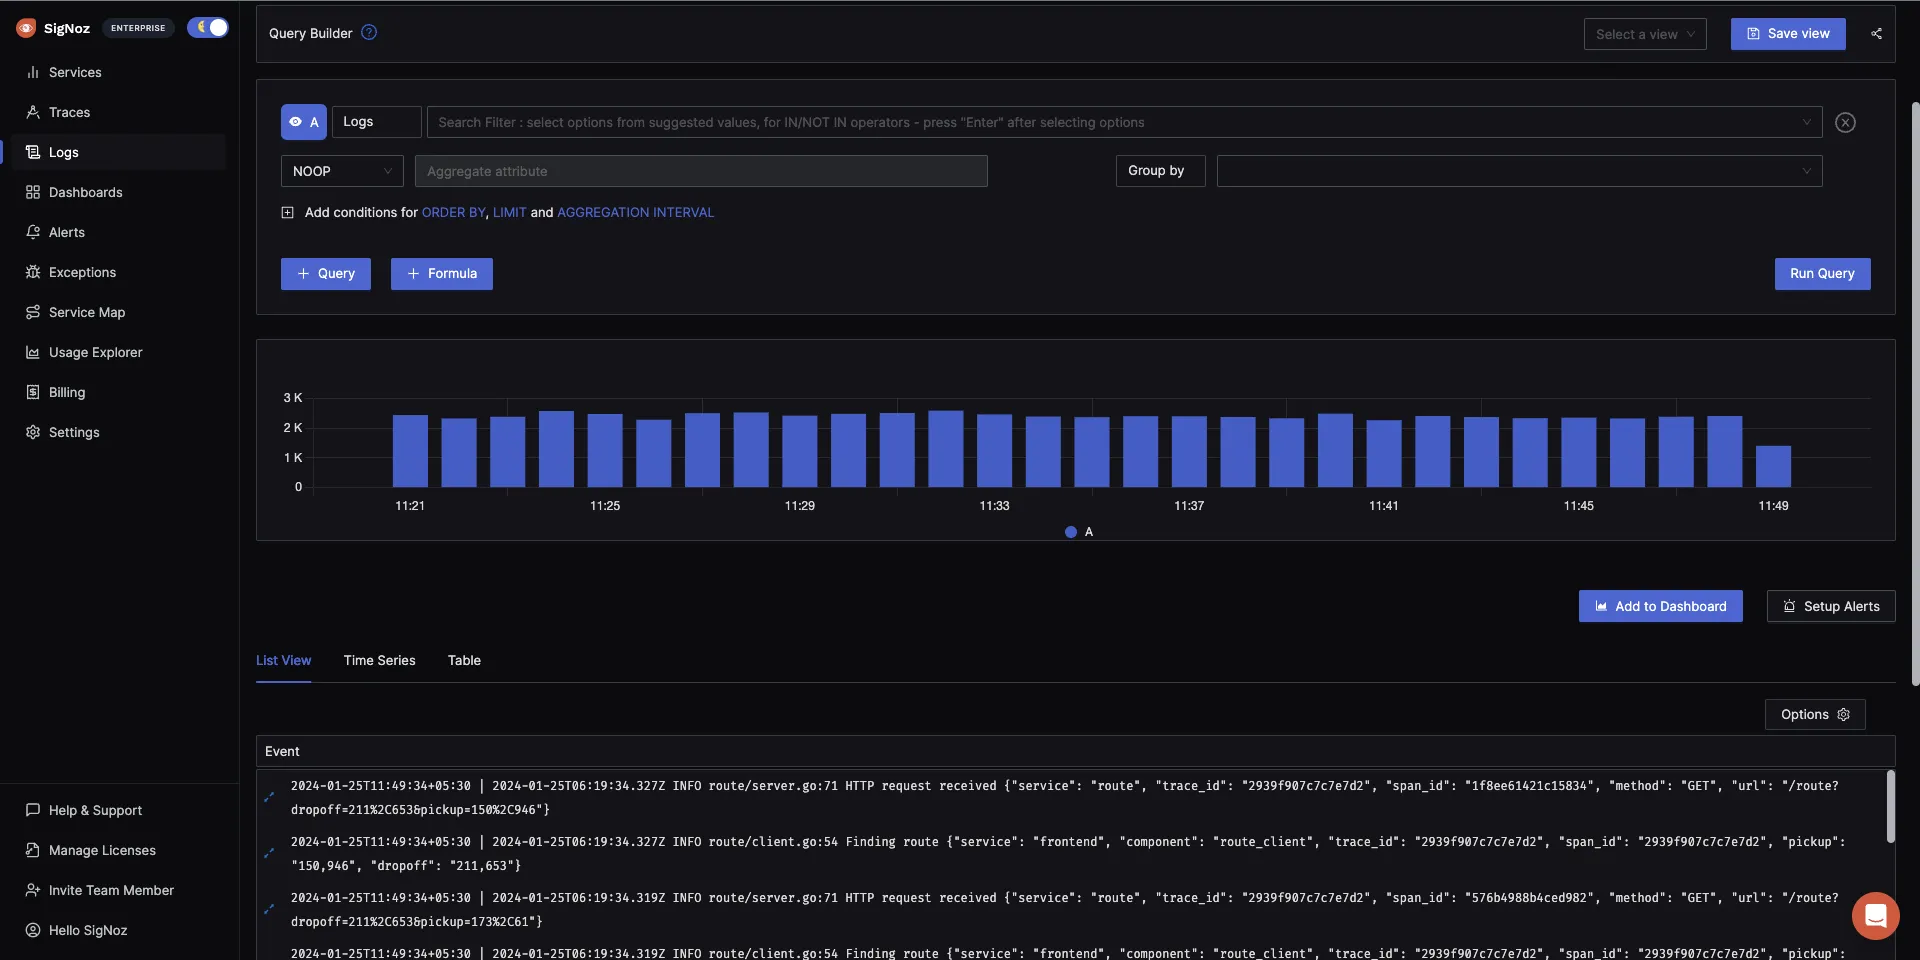
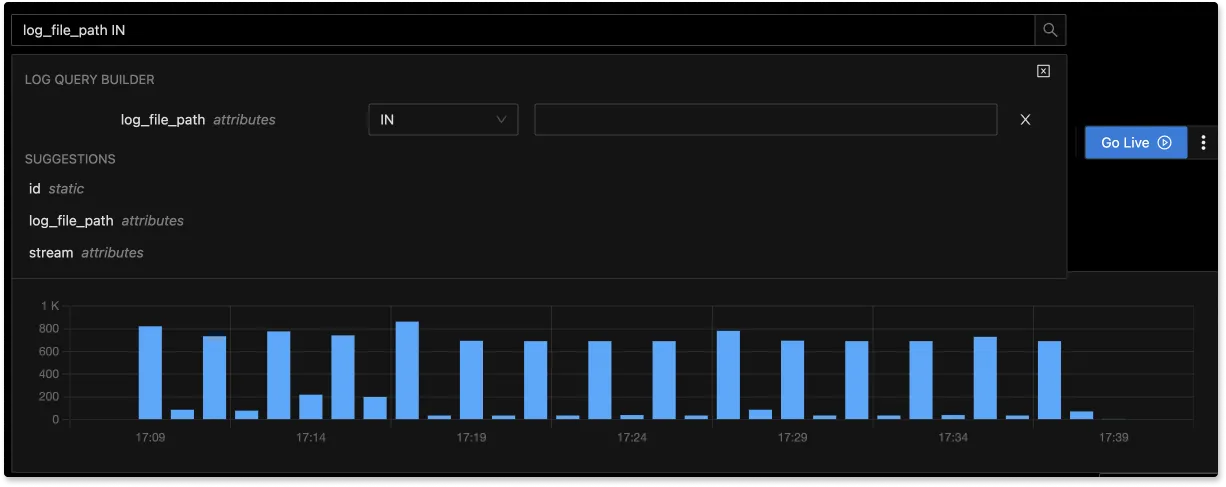
With advanced Log Query Builder, you can filter out logs quickly with a mix and match of fields.
Getting Started with SigNoz for JSON Logs
SigNoz Cloud is the easiest way to run SigNoz. Sign up for a free account and get 30 days of unlimited access to all features.

You can also install and self-host SigNoz yourself since it is open-source. With 24,000+ GitHub stars, open-source SigNoz is loved by developers. Find the instructions to self-host SigNoz.
Related Posts
