Monitoring OpenMetrics for Gunicorn and Django application in Prometheus
In this blog, I will discuss about how to set up Prometheus and Grafana in EKS and how to monitor Python based applications using Prometheus.

Setting up Prometheus and Grafana in EKS
Create cluster in EKS
Create cluster and the command is:
eksctl create cluster --name prod --version 1.13 --nodegroup-name standard-workers --node-type t3.medium --nodes 3 --nodes-min 1 --nodes-max 4 --node-ami auto
Setup Prometheus and Grafana using Helm
Follow this link to set up prometheus and grafana in EKS cluster
also add
--set server.global.scrape_interval="10s"
while installing prometheus from helm using the above link. The default scrape interval is 1m. This may test your patience to see metrics reflected in your Prometheus expression browser.
Grafana is exposed to public using Service type LoadBalancer. You can get the External IP by running:
kubectl get svc -n grafana grafana -o jsonpath='{.status.loadBalancer.ingress[0].hostname}'
which runs on port 80. Just visit the result the above command and you should see your grafana dashboard.
Prometheus server by default is not exposed to public and you can access the prometheus expression browser by running below commands in your localhost/environment:
PROM_SERVER_POD=$(kubectl -n prometheus get pod -l component=server -o jsonpath="\{.items[0].metadata.name}")
kubectl -n prometheus port-forward $PROM_SERVER_POD 9090
Now you can access the prometheus expression browser at http://localhost:9090
Details of Django application
I have set up a sample django application at this Repo which exposes a few endpoints:
- /polls/2xx_success/ returns 200 status code
- /polls/4xx_not_found/ returns 404 status code
- /polls/5xx_exception/ returns 500 status code
We shall be deploying our web application using kubernetes deployment. However, we can run the application in your environment and also as a docker container. Below are the steps to do try those out in your localhost or EC2 instance.
Running application in your environment (Optional)
Run following command at project root directory:-
git clone https://github.com/ankitnayan/django_sample_project.git
cd django_sample_project
pip3 install -r requirements.txt
gunicorn django_sample_project.wsgi:application --bind 0.0.0.0:8000 --workers 3 --access-logfile='-' --statsd-host=localhost:9125 --access-logformat='%(h)s %(l)s %(u)s %(t)s "%(r)s" %(s)s %(b)s "%(f)s" "%(p)s" "%(D)s"'
--statsd-host parameter enables gunicorn to send metrics to statsd-server
Also, I have changed the access log format of gunicorn to log worker pid and response time (in microseconds) . This format later helps to debug request count and latency by worker processes.
Run
curl http://localhost:8000/polls/2xx_success/
from your terminal to check the response.
The application also logs Error sending message to statsd because we have not run statsd server till now but the django application runs perfectly.
Creating and Push the repo as docker image (Optional)
Build docker image and push to registry
docker build -t <username>/django_sample_project:quantiles_v1 .
docker push <username>/django_sample_project:quantiles_v1
Run below commands to run the application as docker container:
git clone https://github.com/ankitnayan/django_sample_project.git
cd django_sample_project
docker run -ti -p 8000:8000 -v `pwd`:/usr/src/app ankitnayan/django_sample_project:quantiles_v1
Run
curl http://localhost:8000/polls/2xx_success/
from your terminal to check the response.
The application also logs Error sending message to statsd because we have not run statsd server till now but the django application runs perfectly.
Choosing the metric collection system in gunicorn + django and other python applications
The problem with exporting metrics in python applications
Prometheus inherits many of Borgmon's assumptions about its environment. In particular, client libraries assume that metrics come from various libraries and subsystems, in multiple threads of execution, running in a shared address space. On the server side, Prometheus assumes that one target is one (probably) multi-threaded program.
These assumptions break in many non-Google deployments, particularly in the Python world. Here it is common (e.g. using Django or Flask) to run under a WSGI application server that spreads requests across multiple workers, each of which is a process rather than a thread.
In a naive deployment of the Prometheus Python client for a Flask app running under uWSGI, each request from the Prometheus server to /metrics can hit a different worker process, each of which exports its own counters, histograms, etc.
Various ways to export metrics to prometheus
Statsd Exporter
Instead of Prometheus scraping our Python web application directly, we will let each worker process push its metrics to a certain “bridge” application, which will then convert these individual data points into aggregated metrics. These aggregated metrics will then be converted into Prometheus metrics when Prometheus queries the bridge. This “bridge” application here is the statsd exporter.
Multi Process Mode of python clientLink The prometheus python client has a multi-processing mode which essentially creates a shared prometheus registry and shares it among all the processes and hence the aggregation happens at the application level. When, prometheus scrapes the application instance, no matter which worker responds to the scraping request, the metrics reported back describes the application’s behaviour, rather than the worker responding.
Django Prometheus library Link The Django prometheus client adopts an approach where you basically have each worker listening on a unique port for prometheus’s scraping requests. Thus, for prometheus, each of these workers are different targets as if they were running on different instances of the application.
Running gunicorn with statsd
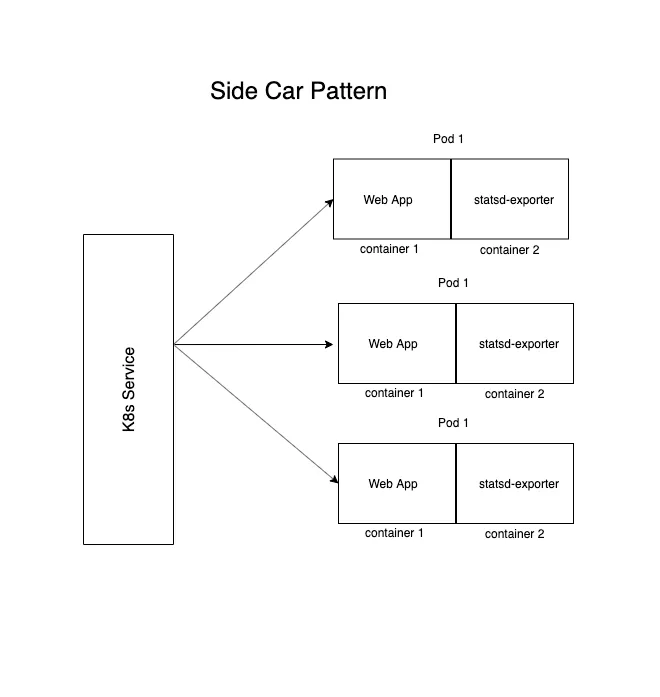
We can run statsd-exporter as a side-car to django application container in each pod. The number of scraping targets for prometheus will be equal to number of pods running.
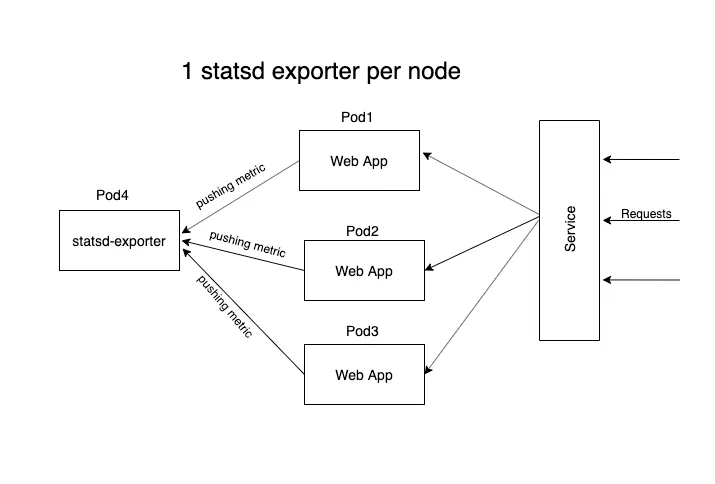
Or we can run 1 statsd-exporter per node. All applications in a node shall push to a common statsd server of that node.
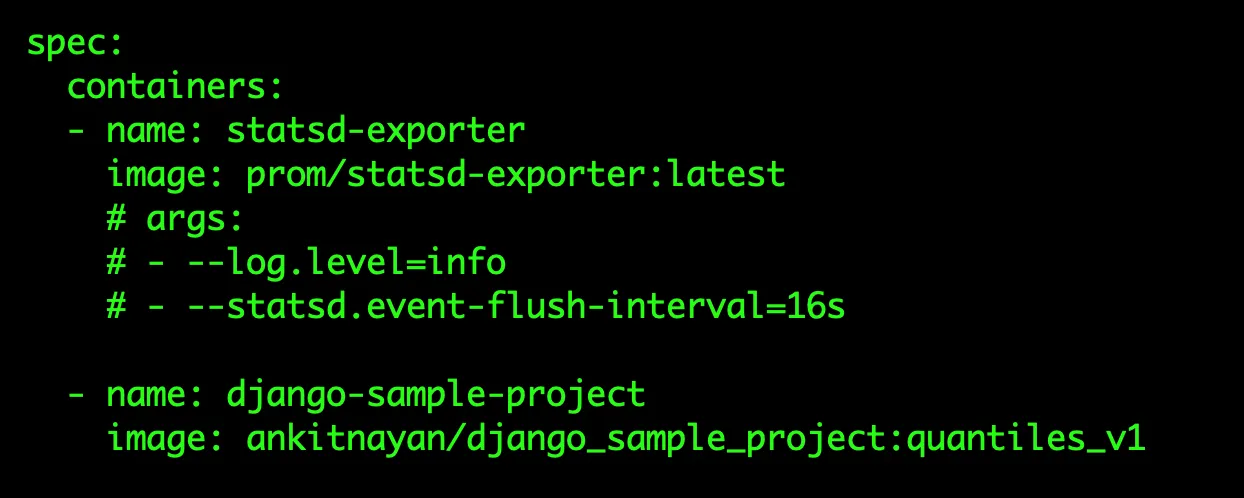
I have used side-car pattern to deploy statsd-exporter (check django-deployment.yml).
Now, deploy the pods and services using
kubectl create namespace django-with-statsd
kubectl -n django-with-statsd apply -f k8s/
(see k8s folder inside the repo)
Don't forget to open port 8000 for that security group in AWS
Run below command to get the External IP of the service which exposes your application to the public world.
kubectl get svc -n django-with-statsd django-with-statsd -o jsonpath='\{.status.loadBalancer.ingress[0].hostname}'
The type of service is LoadBalancer (ELB) which is provided by AWS and hence you will be charged for the same. You can view the ELB used in the list of Load Balancer in AWS dashboard.
Now, visit the url <externalIP>:8000/polls/2xx_success and confirm that it works.
Load testing to check RPS and latency metrics
I am using locustio to generate some traffic to the application and then shall verify them in prom expression browser. pip3 install locustio in any environment (can be your localhost)
load-test/profile1.py will call the application endpoints with the given load:
- /polls/2xx_success/ with a weight of 2
- /polls/4xx_not_found/ with a weight of 1
- /polls/5xx_exception/ with a weight of 1
Now, run
locust -f load-test/profile1.py --host=<ExternalIP>:8000
from the project root directory.
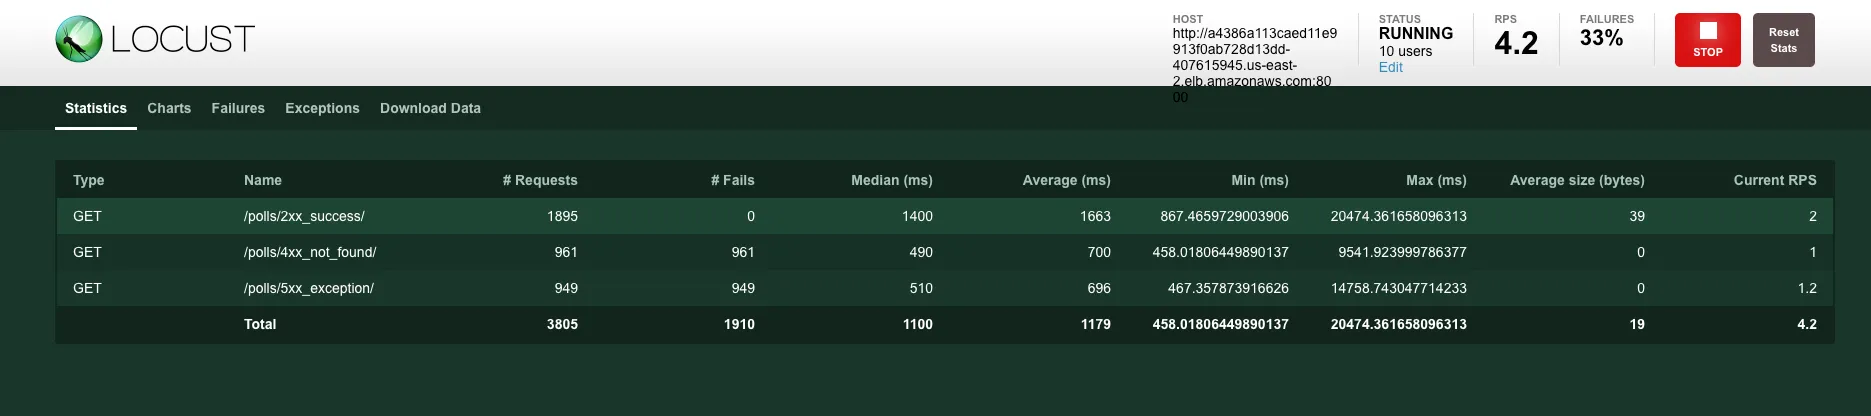
Locust web portal is now available at http://localhost:8089/. Generate the type of load you want.
I used 10 users with a hatch rate of 2
Compute RED metrics for this application
We shall have the gunicorn_* metrics available in prometheus expression browser
Those who are wondering what RED metrics mean.
- R -> Rates -> Request rates per second
- E -> Errors -> Error rates per second
- D -> Duration -> Time each request takes
Request Rate:
sum(rate(gunicorn_requests[1m]))
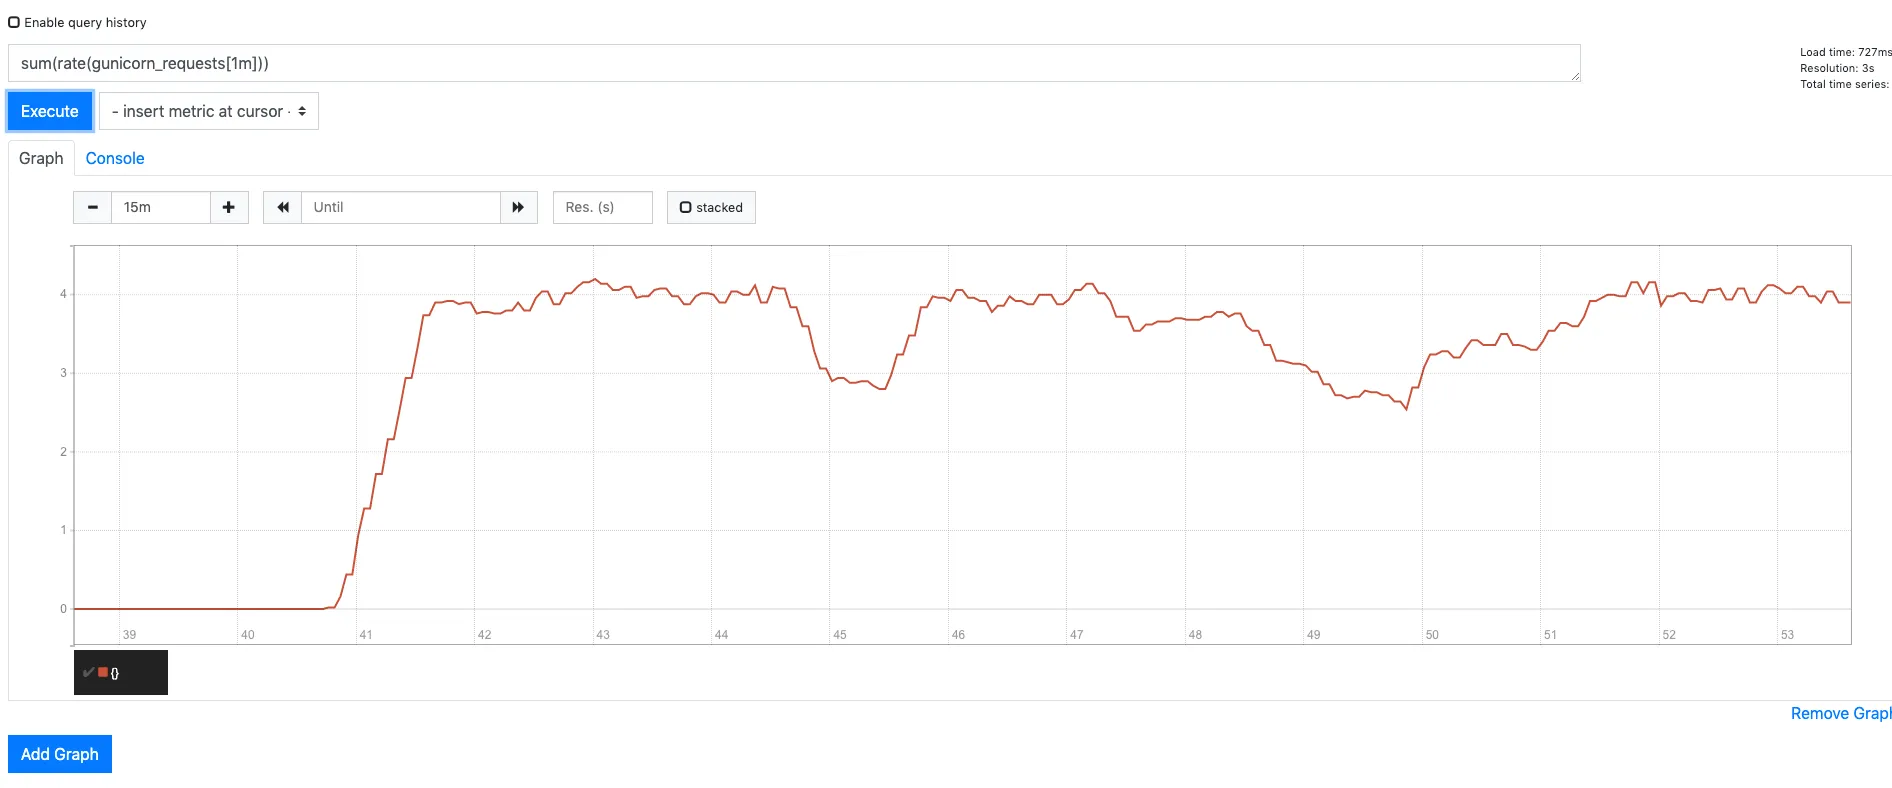
The RPS is around 4 which is confirmed from the locust web portal.
Similarly we can get other rates by:
- Rate of 200:
sum(rate(gunicorn_request_status_200[1m])) - Rate of 500:
sum(rate(gunicorn_request_status_500[1m])) - Rate of 404:
sum(rate(gunicorn_request_status_404[1m]))
Avg Request Duration:
rate(gunicorn_request_duration_sum[1m])/rate(gunicorn_request_duration_count[1m])
This will generate the below graph
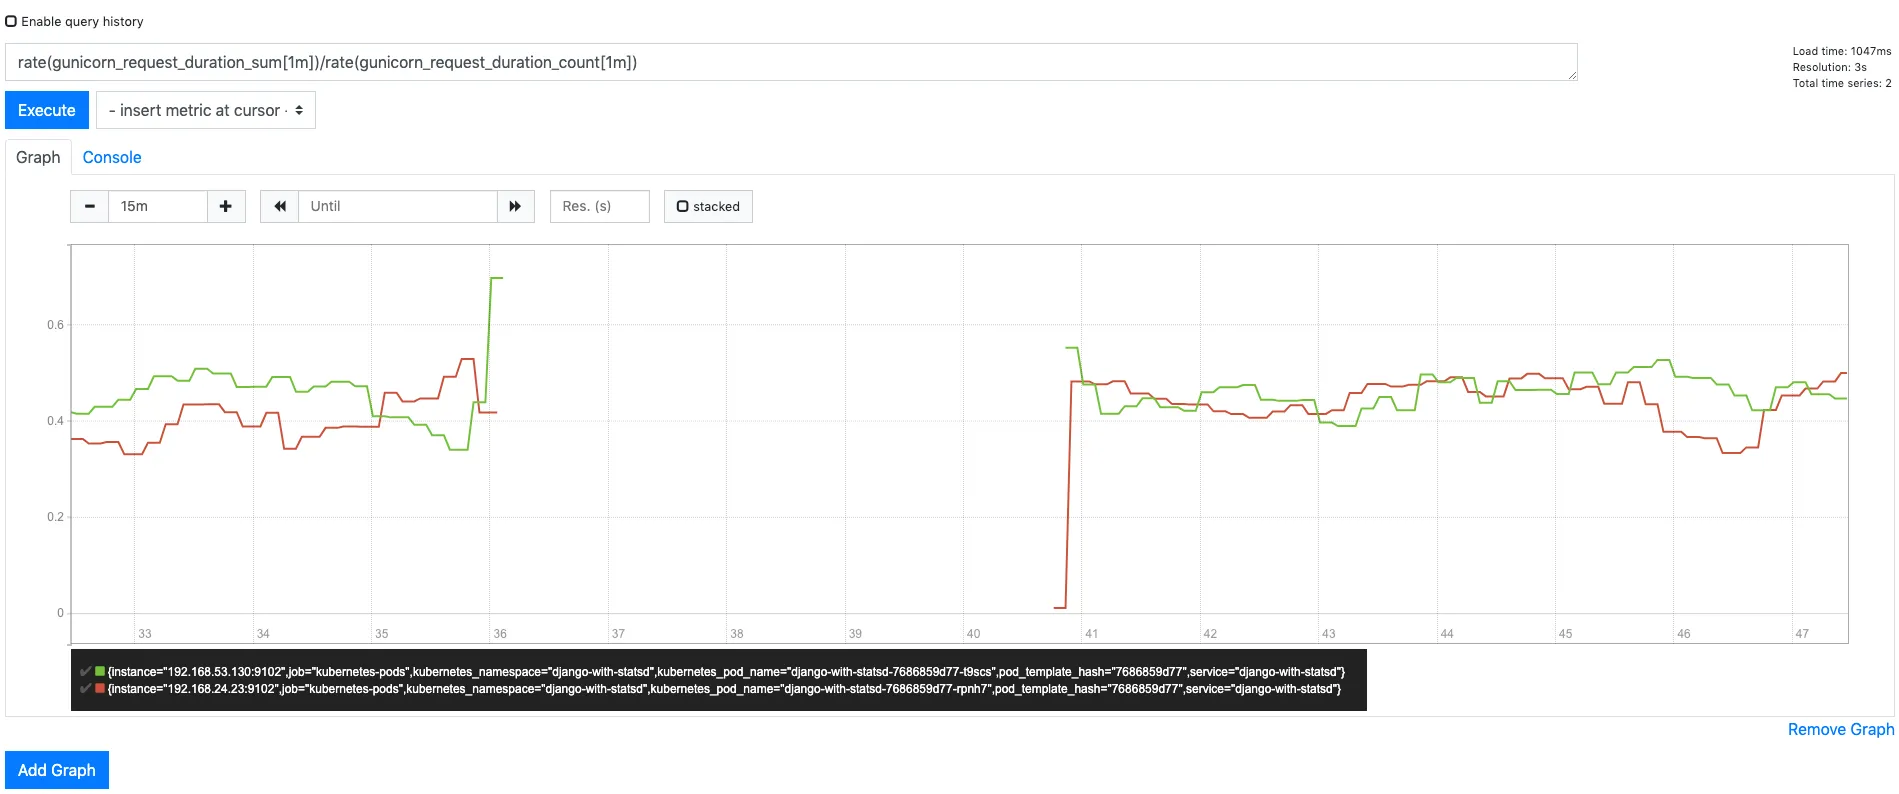
- 2 lines in graph because we have 2 pods in the deployment and hence 2 statsd-exporter since they are sidecars
- Gap in graph because I stopped the load generator for some time
- You should also get a value close to
0.4s. I have written application logic to sleep for some time based on normal distribution so that we have an average of0.8sfor every 2xx request. Since the weight in load generator is 2 for 2xx requests, 1 for 4xx request and 1 for 5xx request, it averages to2*0.8/4which equals0.4s.
Instrumenting code in Django to collect RED metrics and enable better insights into your application
You might be thinking, why do we need to instrument when we are getting RED metrics from gunicorn in the last section?
Answer: More detailed filtering on RED metrics like
- Which endpoint has more error rates? Or which endpoint has the highest response time (latency)?
- Which endpoints produce 500 errors and at what rate?
- If you have multiple applications then which app has highest latency.
You need such metric and many more filters to find exact bottlenecks in your flow of request through micro-services. And all of these can be achieved by adding independent code as middleware and add that middleware to Django's list of middlewares in settings.py
We shall put up a middleware which shall start the timer as the request comes and shall stop the timer as the response leaves (to calculate request duration).
Before we move through, let's understand the execution order of middlewares in Django in a request/response life cycle. Every middleware is called twice in a request/response cycle. During the request cycle the middlewares are executed top down and during the response cycle, they are executed bottoms up. So, if I put a middleware on top, it will be the first to get invoked when a request comes and the last one before the response leaves.
Our middleware class must implement 1 of the below methods:
Called during request:
process_request(request)process_view(request, view_func, view_args, view_kwargs)
Called during response:
process_exception(request, exception)(only if the view raised an exception)process_template_response(request, response)(only for template responses)process_response(request, response)
We shall implement process_request and process_response methods for our case. Have a look at the [middlewares/collect_statsd_metrics.py](https://github.com/ankitnayan/django_sample_project/blob/master/middlewares/collect_statsd_metrics.py)
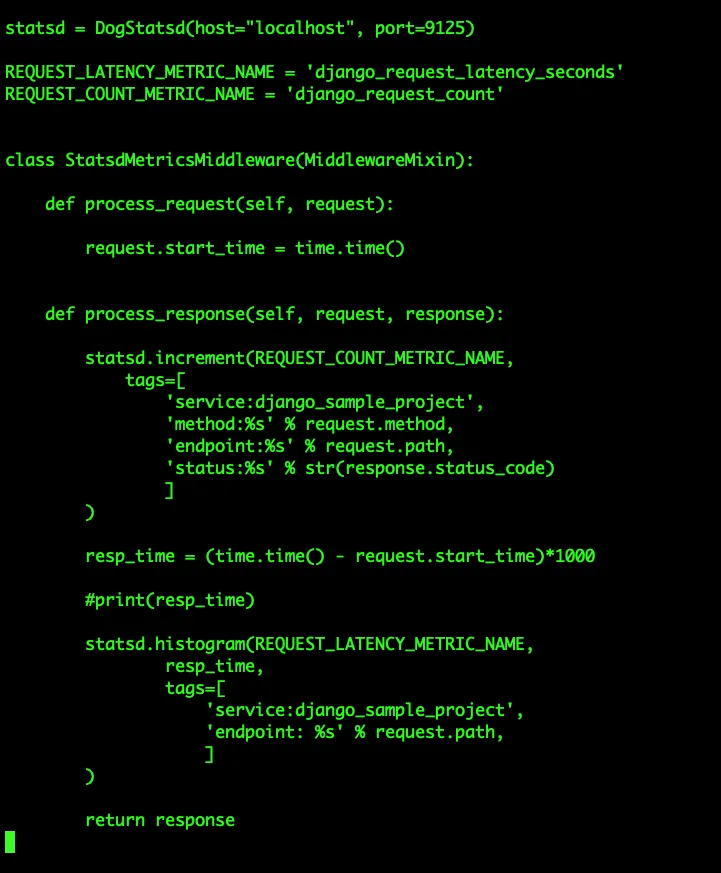
If you notice, we are using DogStatsd library to include tags in the metrics which correspond to prometheus labels.
As you can see, we have labels of status codes, endpoint, method and service for REQUEST_COUNT_METRIC_NAME and service, endpoint labels for REQUEST_LATENCY_METRIC_NAME.
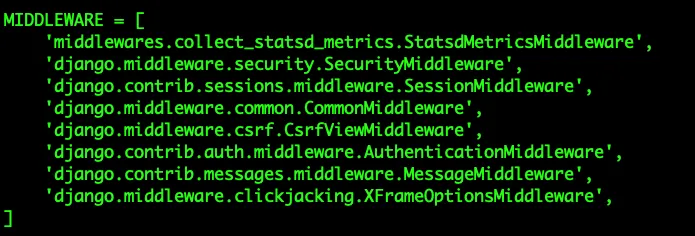
Now add this on top of all middlewares in your settings.py and you will be good to go.
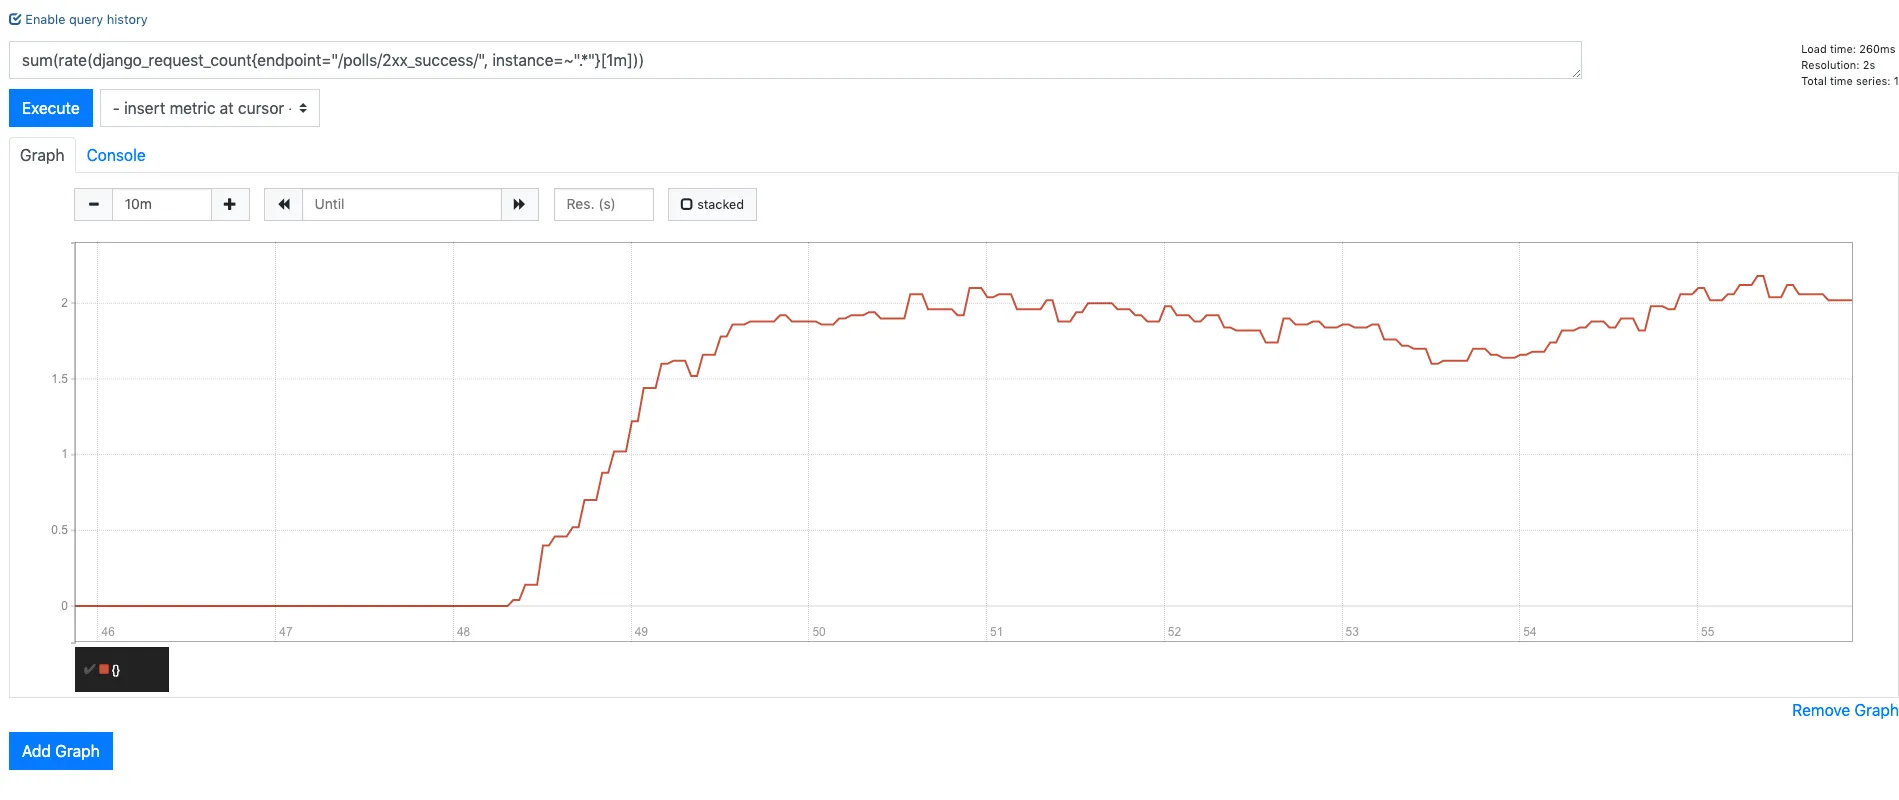
RPS of /polls/2xx_success/
sum(rate(django_request_count{endpoint="/polls/2xx_success/", instance=~".*"}[1m]))
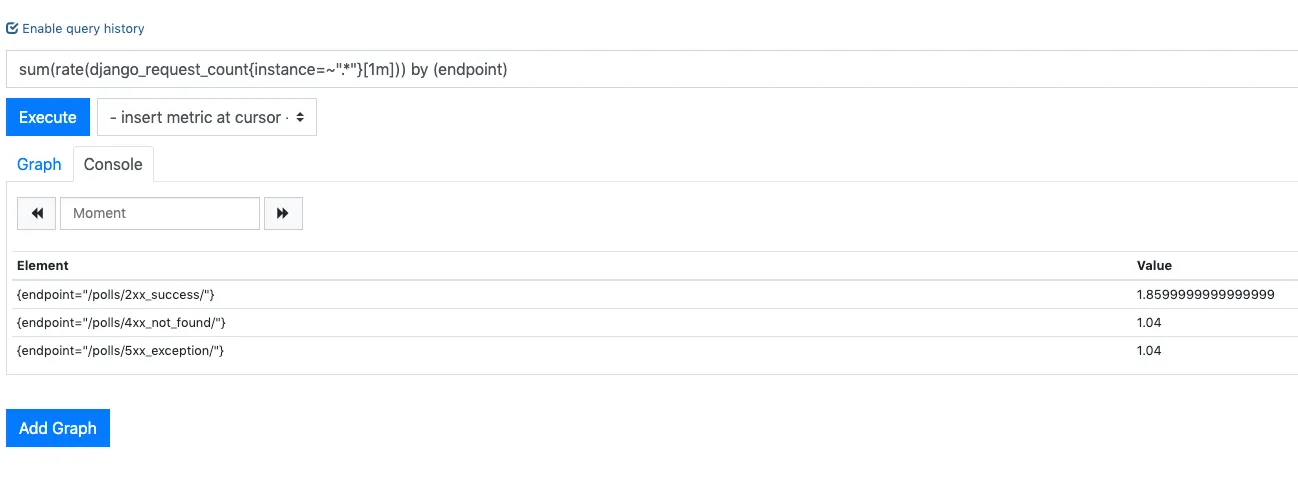
RPS by endpoint
sum(rate(django_request_count{instance=~".*"}[1m])) by (endpoint)
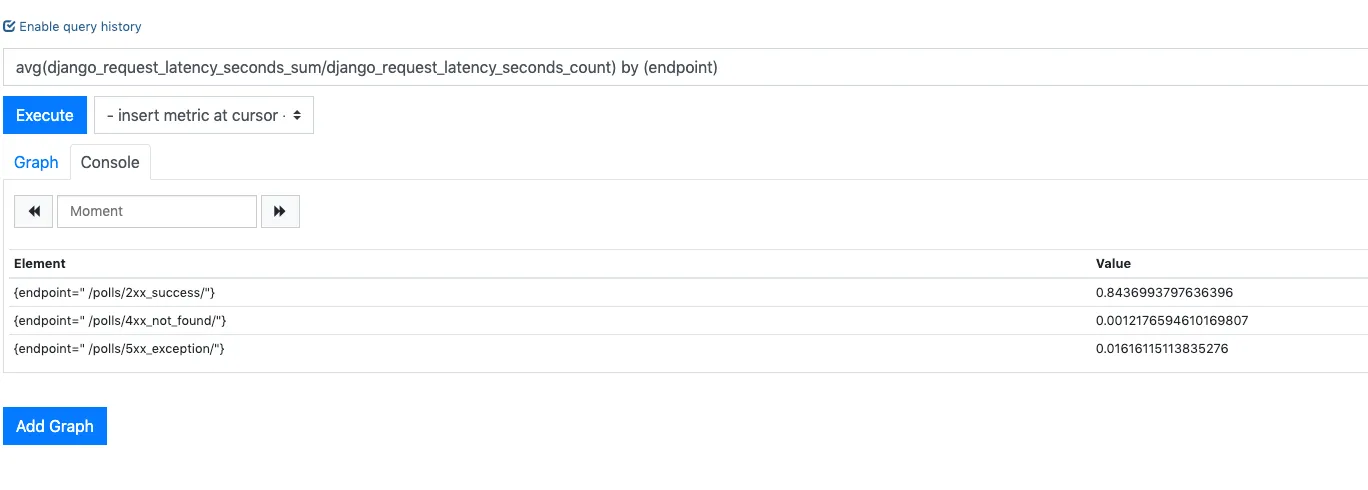
Average request duration per endpoint
avg(rate(django_request_latency_seconds_sum[1m])/rate(django_request_latency_seconds_count[1m])) by (endpoint)
Quantile of endpoints
django_request_latency_seconds{endpoint="/polls/2xx_success/"}
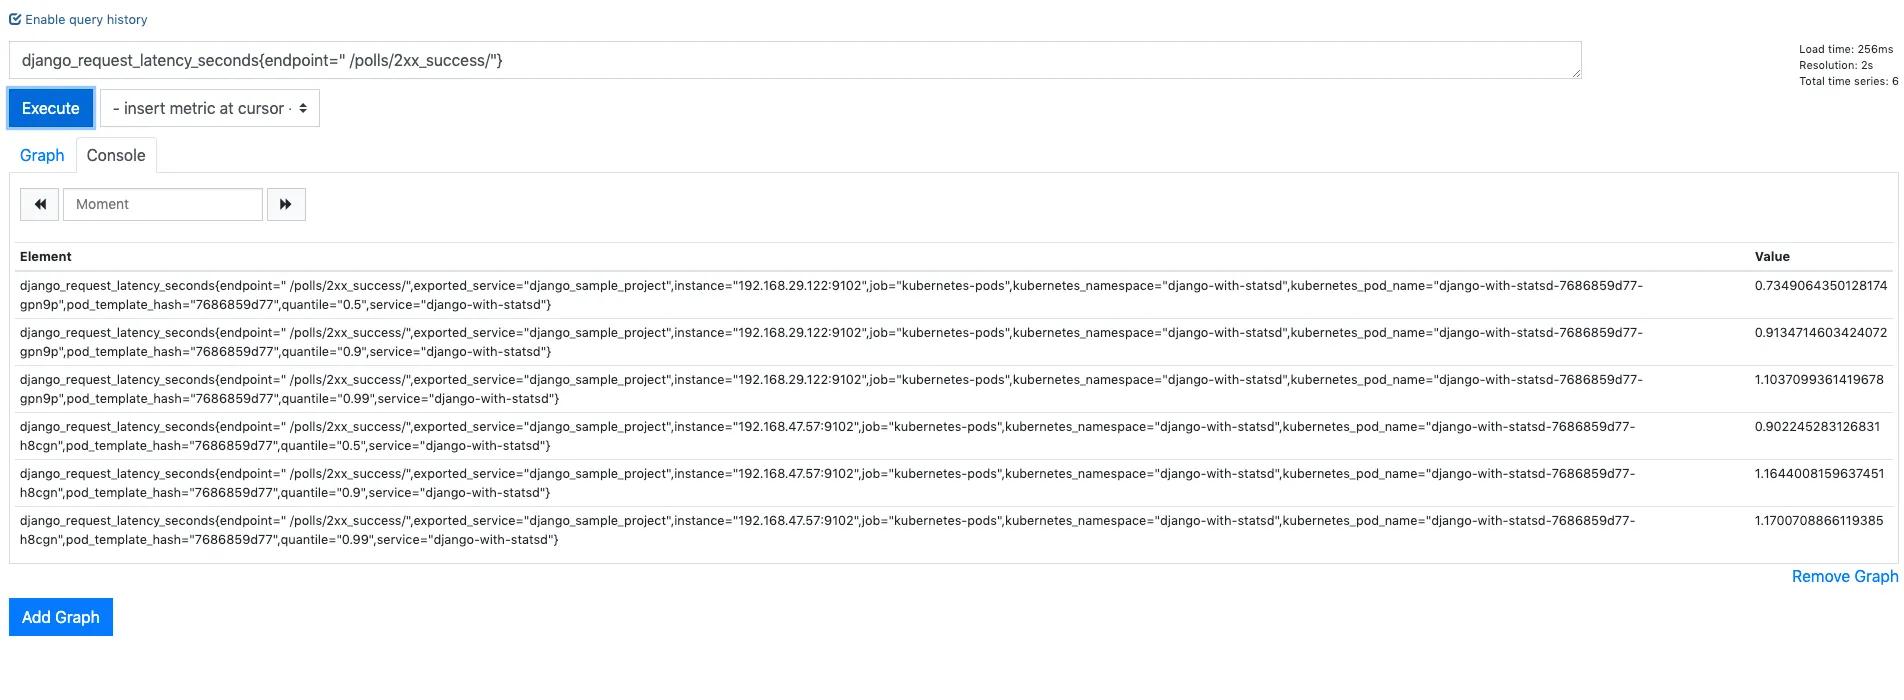
We now have 50, 90 and 99 percentile metrics from each of statsd-exporter instance. Since we have 2 statsd-exporter we see each of these percentile for each of them.
We cannot aggregate on the quantiles collected. The post aggregation does not make any sense of data.
Now, we have very detailed RPS and latency filtering working for our application. We can set up alerts and plot these metrics on grafana. I shall keep these topics for later blog.
What happens to Prometheus metrics when one of the nodes die? Exploring highly available Prometheus!
Case 1: The node other than Prometheus server was stopped
This data has been collected for different web application but the results should be very similar
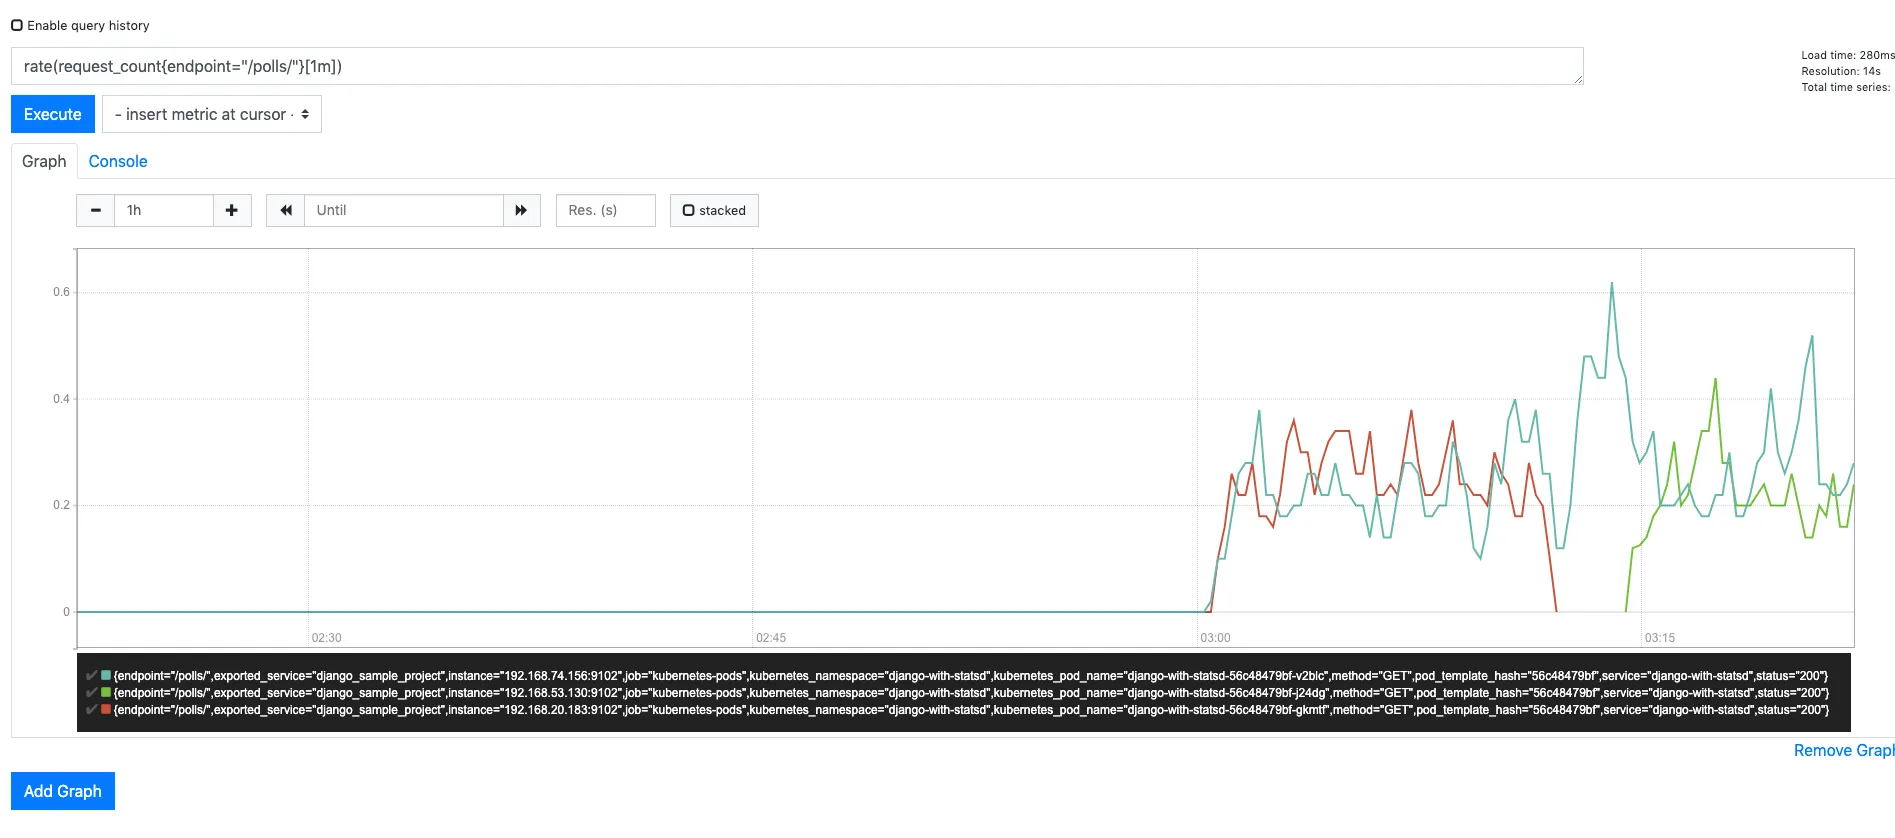
The node which was killed was hosting 1 pod of the django application. So, we see metrics from 1 pod dying while the other pod kept sending correct metrics to prometheus.
Soon enough (roughly after 2 minutes) kubernetes started another pod to match current state to desired state and the metrics from this new pod start coming automatically as prometheus discovers them by auto discovery of targets which I enabled in our k8s/django-deployment.yml file by below annotations:
prometheus.io/scrape: 'true'
prometheus.io/port:   '9102'
prometheus.io/path:   '/metrics'
Case 2: The node hosting Prometheus server was stopped
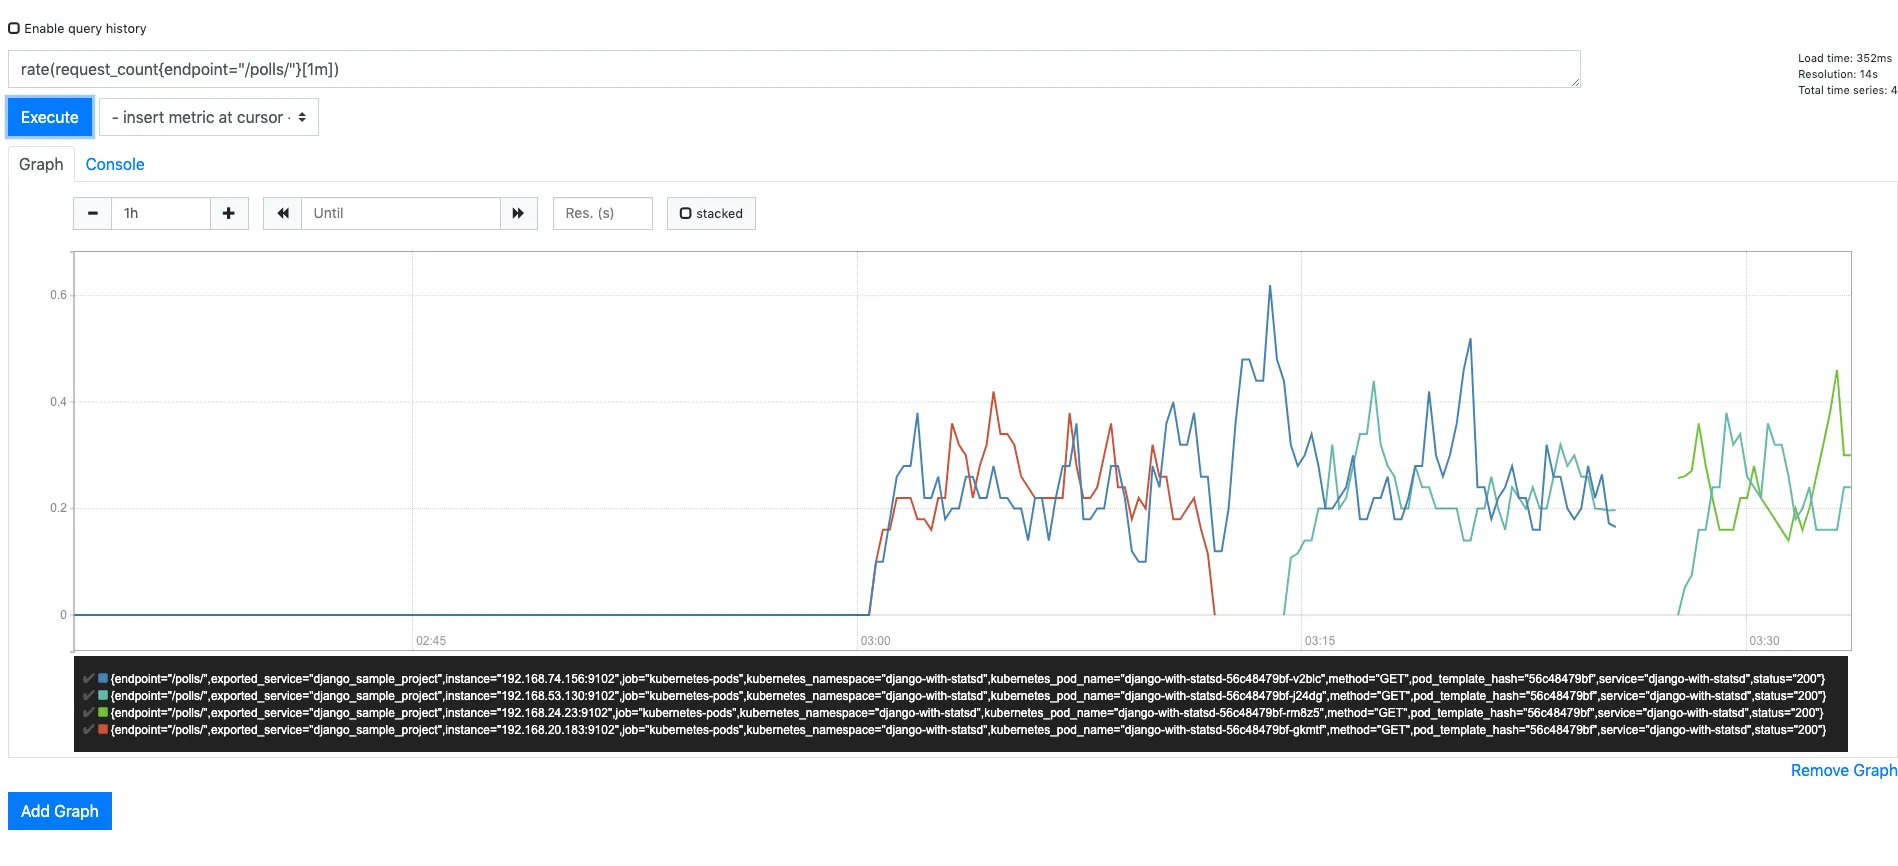 Around the right side, we see a gap in the graph. This is the expected behaviour because prometheus server is not able to scrape metrics from any targets. Hence no metrics are collected till the time kubernetes auto restarts the prometheus-server pod.
The great thing being, in either case of node failure the system restores without any manual intervention. That's what is fantastic about kubernetes!
I hope this blog helps you setup metrics in prometheus for gunicorn and django stack. Feel free to reach out to me in case of any queries or suggestions.
For any Prometheus related query reach me out on Twitter or mail me at ankit@signoz.io
