Observability vs Monitoring - The difference explained with an example
Observability vs monitoring has been a common topic in DevOps recently. There has been a lot of debate, and I have learned a lot from them when I started my observability journey. Most literature on observability is associated with a particular product or shares a textbook definition.
In this blog post, I want to give you a practical understanding of observability and the differences between observability and monitoring with different scenarios and examples.
We will cover the following topics here:
- Observability vs Monitoring: The definition
- Spread Data vs Integrated data
- Reactive Actions vs Proactive Actions
- What? When? vs Why? How?
- Component Monitoring vs Full-stack monitoring
- Explanation with an example
Observability vs Monitoring: The definition
The general definition of observability and monitoring is as follows.
Observability is the ability to understand a system’s internal state by analyzing the data it generates, such as logs, metrics, and traces. It helps teams analyze what is happening in context across multi-cloud environments so you can detect and resolve the underlying causes of issues.
Monitoring is the process of collecting, analyzing, and using the information to track a program’s progress toward reaching its objectives and to guide management decisions. Monitoring focuses on watching specific metrics. Logging provides additional data but is typically viewed in isolation from a broader system context.
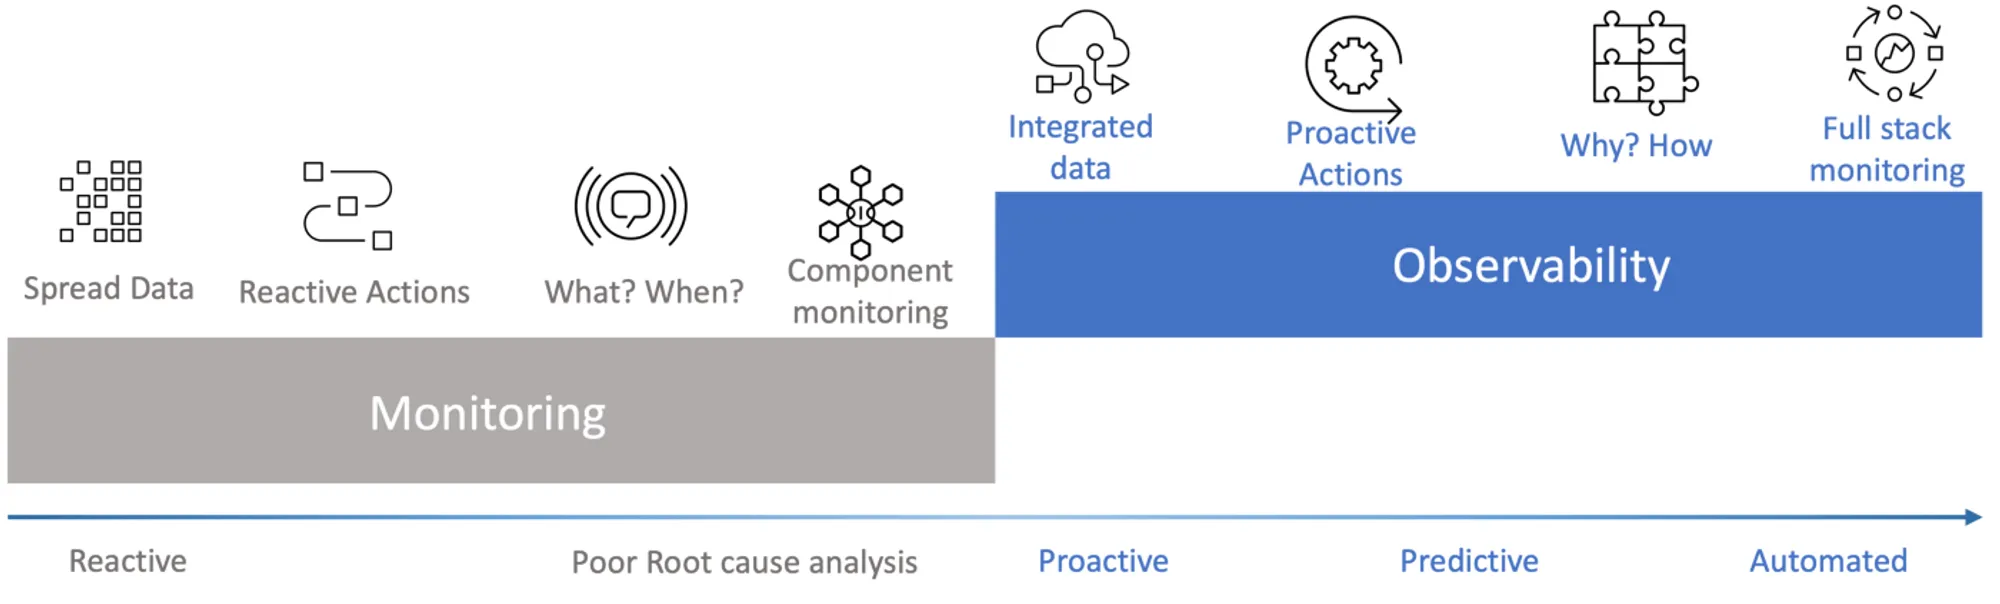
Observability makes monitoring contextual
Observability does not replace monitoring, it extends it. Monitoring watches predefined signals for known failure modes, answering what is happening and when. Observability adds the ability to explore your telemetry freely and answer why and how, including for problems you never anticipated. Monitoring is a necessary foundation; observability is what you build on top of it.
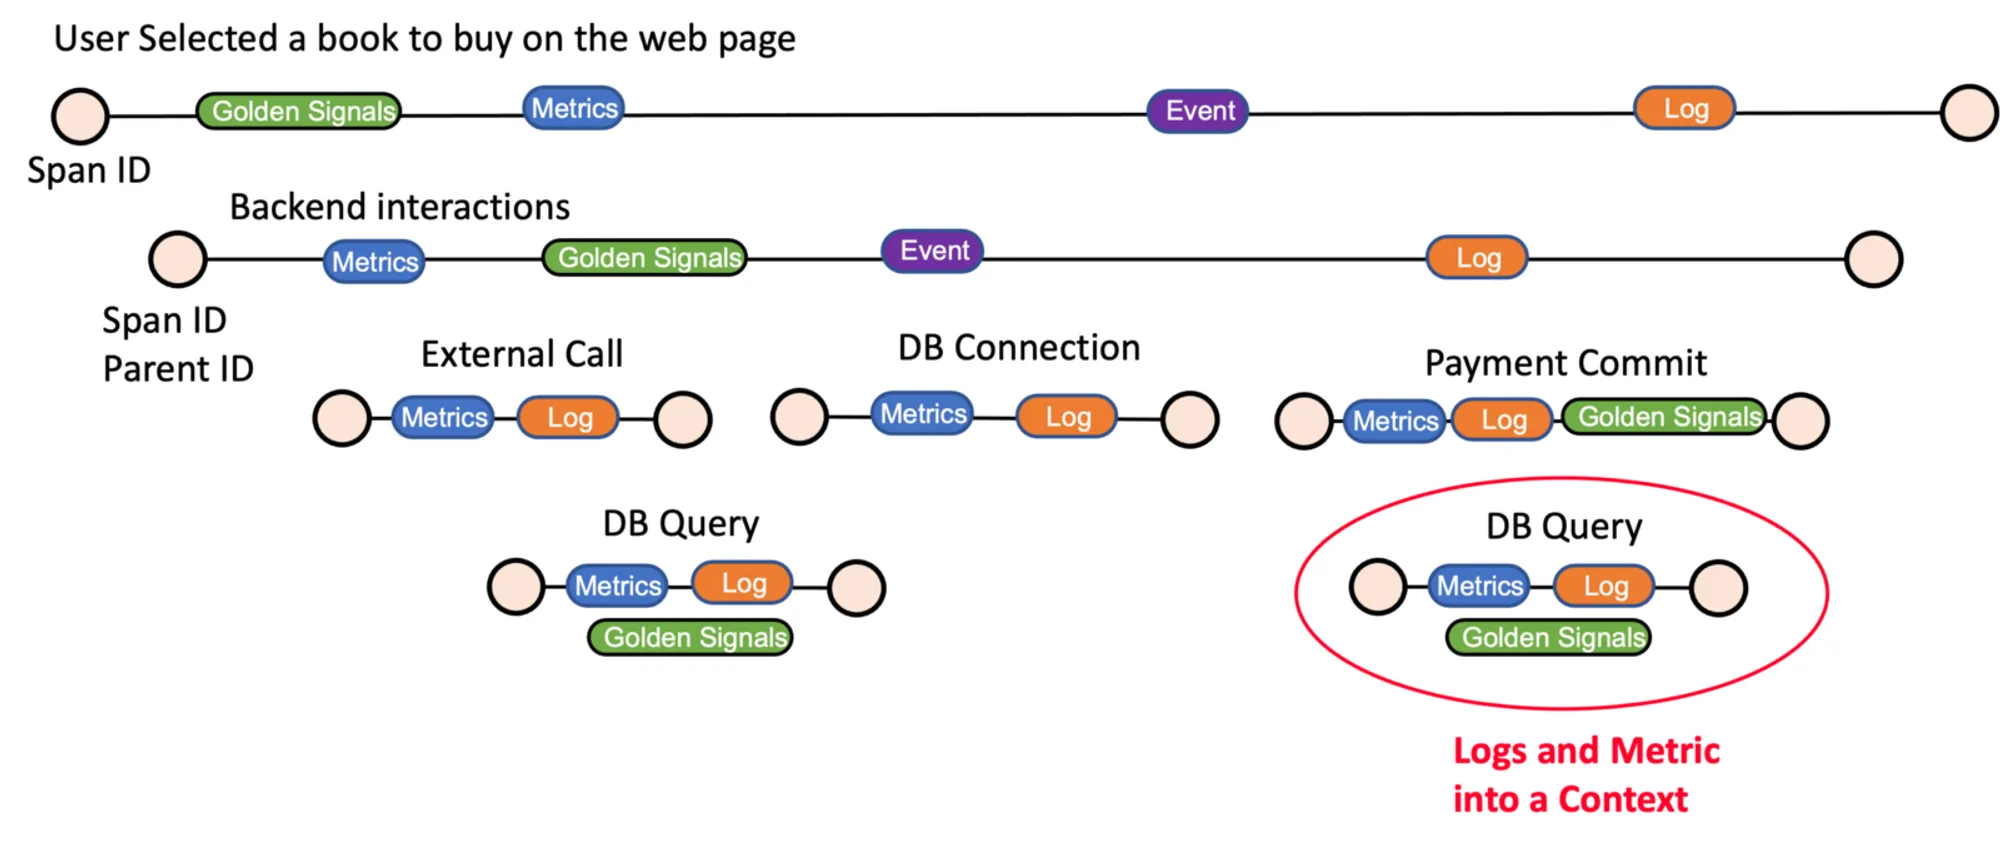
Observability has three main pillars: metrics, logs, and traces. Metrics and logs have traditionally been used to monitor software systems. Traces are new, but they are critical for a robust observability framework.
Logs are an immutable timestamped event that happened over time.
For sure, logs are a great way to troubleshoot issues. Logs help us to have visibility of all the issues that take place and their time of occurrence. But in microservices applications, it gets challenging to understand and correlate logs from different hosts.
Even if you are using a specialized tool to analyze the logs for you, these tools cannot associate the logs with a context without the tracings; what is the order of each transaction that generated this log? Tracing helps us correlate events with parent and child spans. If logs are integrated with trace IDs, you can derive contextual insights faster, which makes troubleshooting easier.
Metrics are a numeric representation of data measured over time intervals.
With metrics, we can see CPU utilization, memory usage, storage, network, and so on, which can be used to determine infrastructure saturation. It can also help monitor performance and improve capacity planning. But in the same way as logs, in a distributed setup like microservices architecture, it’s challenging to identify the root cause of issues if metrics show a spike.
We can also associate the metrics with thresholds and SLOs to make them actionable, but with that, we will have monitoring and not Observability.
When metrics are associated with traces, we can understand that a query received for a specific service is causing a high CPU utilization because the service is using a low-performance query, allowing us to debug the problems more manageably.
Logs and metrics, when combined with traces bring out contextual insights that help to troubleshoot issues faster.
Spread Data vs Integrated Data
Monitoring solutions are based on component monitoring and cannot integrate these components based on context, so the information is spread. As a result, we cannot automatically associate the problems and identify the most critical components.
On the other hand, observability is designed to work with integrated data. Observability solutions will use the concept of distributed tracing to create a topology, integrate the data, understand the context, and understand how each component is integrated into the entire infrastructure.
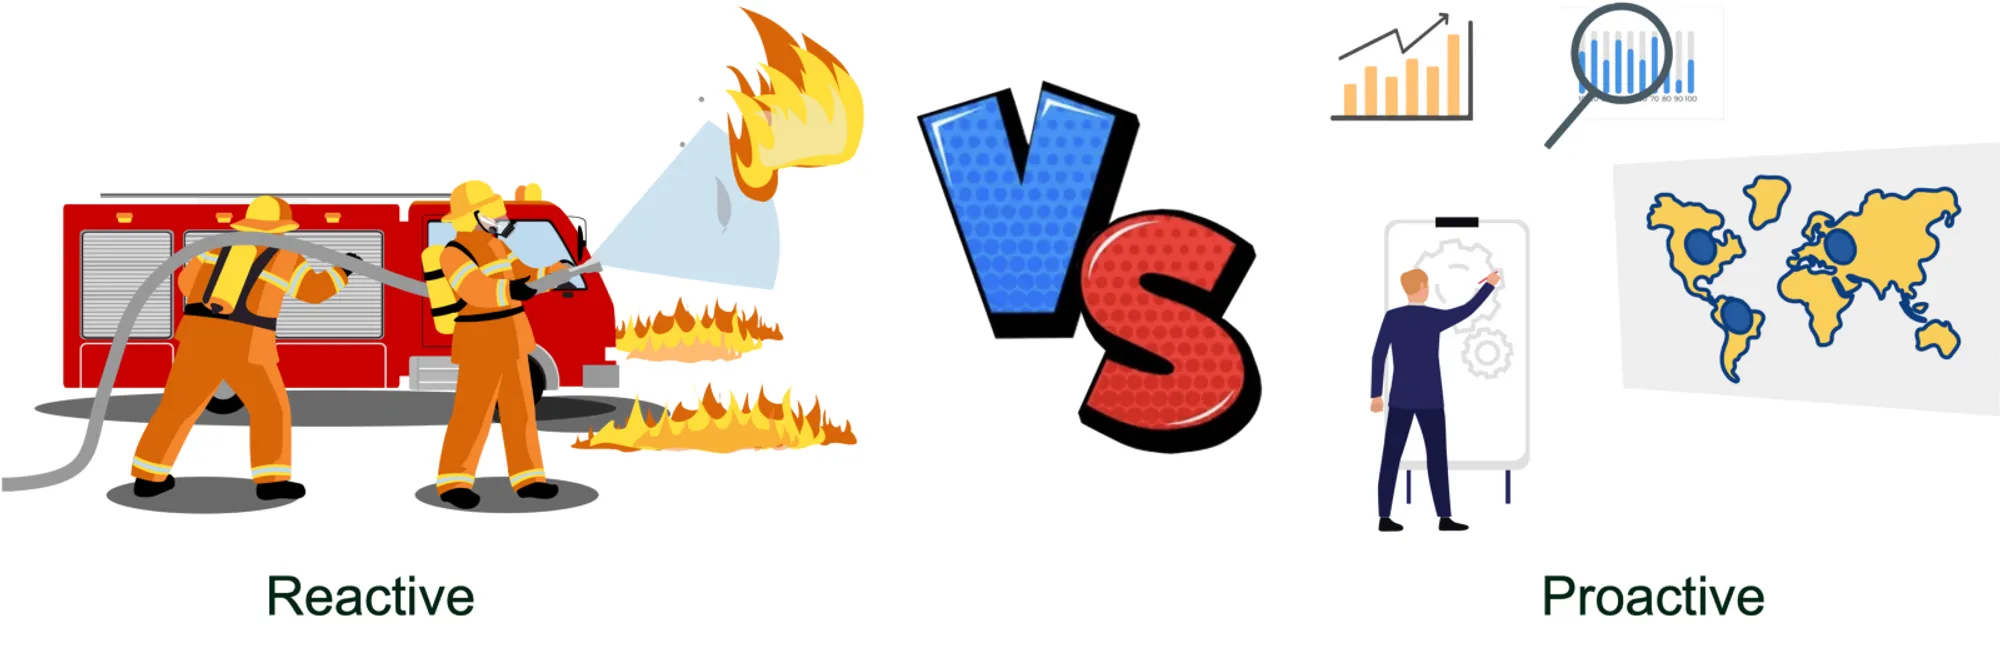
Reactive Actions vs Proactive Action
Monitoring systems were designed to react to the problems to fix the issues as quickly as possible; monitoring will continuously collect the metrics from the systems. The solution will notify the responsible as soon as the solution identifies an anomaly or a problem. Generally, monitoring solutions are threshold-based, so if a metric reaches the threshold, the solution will trigger an alert.
Observability solutions are designed to contextualize the issues, associate infrastructure components with application components, understand the integration of all services, and detect anomalies in normal behavior, allowing the teams to work proactively.
What & When vs Why & How
Monitoring lets you answer “what & when” about possible issues.
Monitoring can detect the problem when it happens and inform the correct people on time. However, monitoring root cause analysis is limited and sometimes manual; since monitoring solutions need to contextualize the applications and infrastructure, monitoring can say the why and how with a low level of information.
Observability lets you answer “why & how” about possible issues.
Observability has advanced technologies that can allow us to identify the why and how of the problems, contextualize them, provide the root cause of the issues precisely, and also help to avoid the same problem in the future.
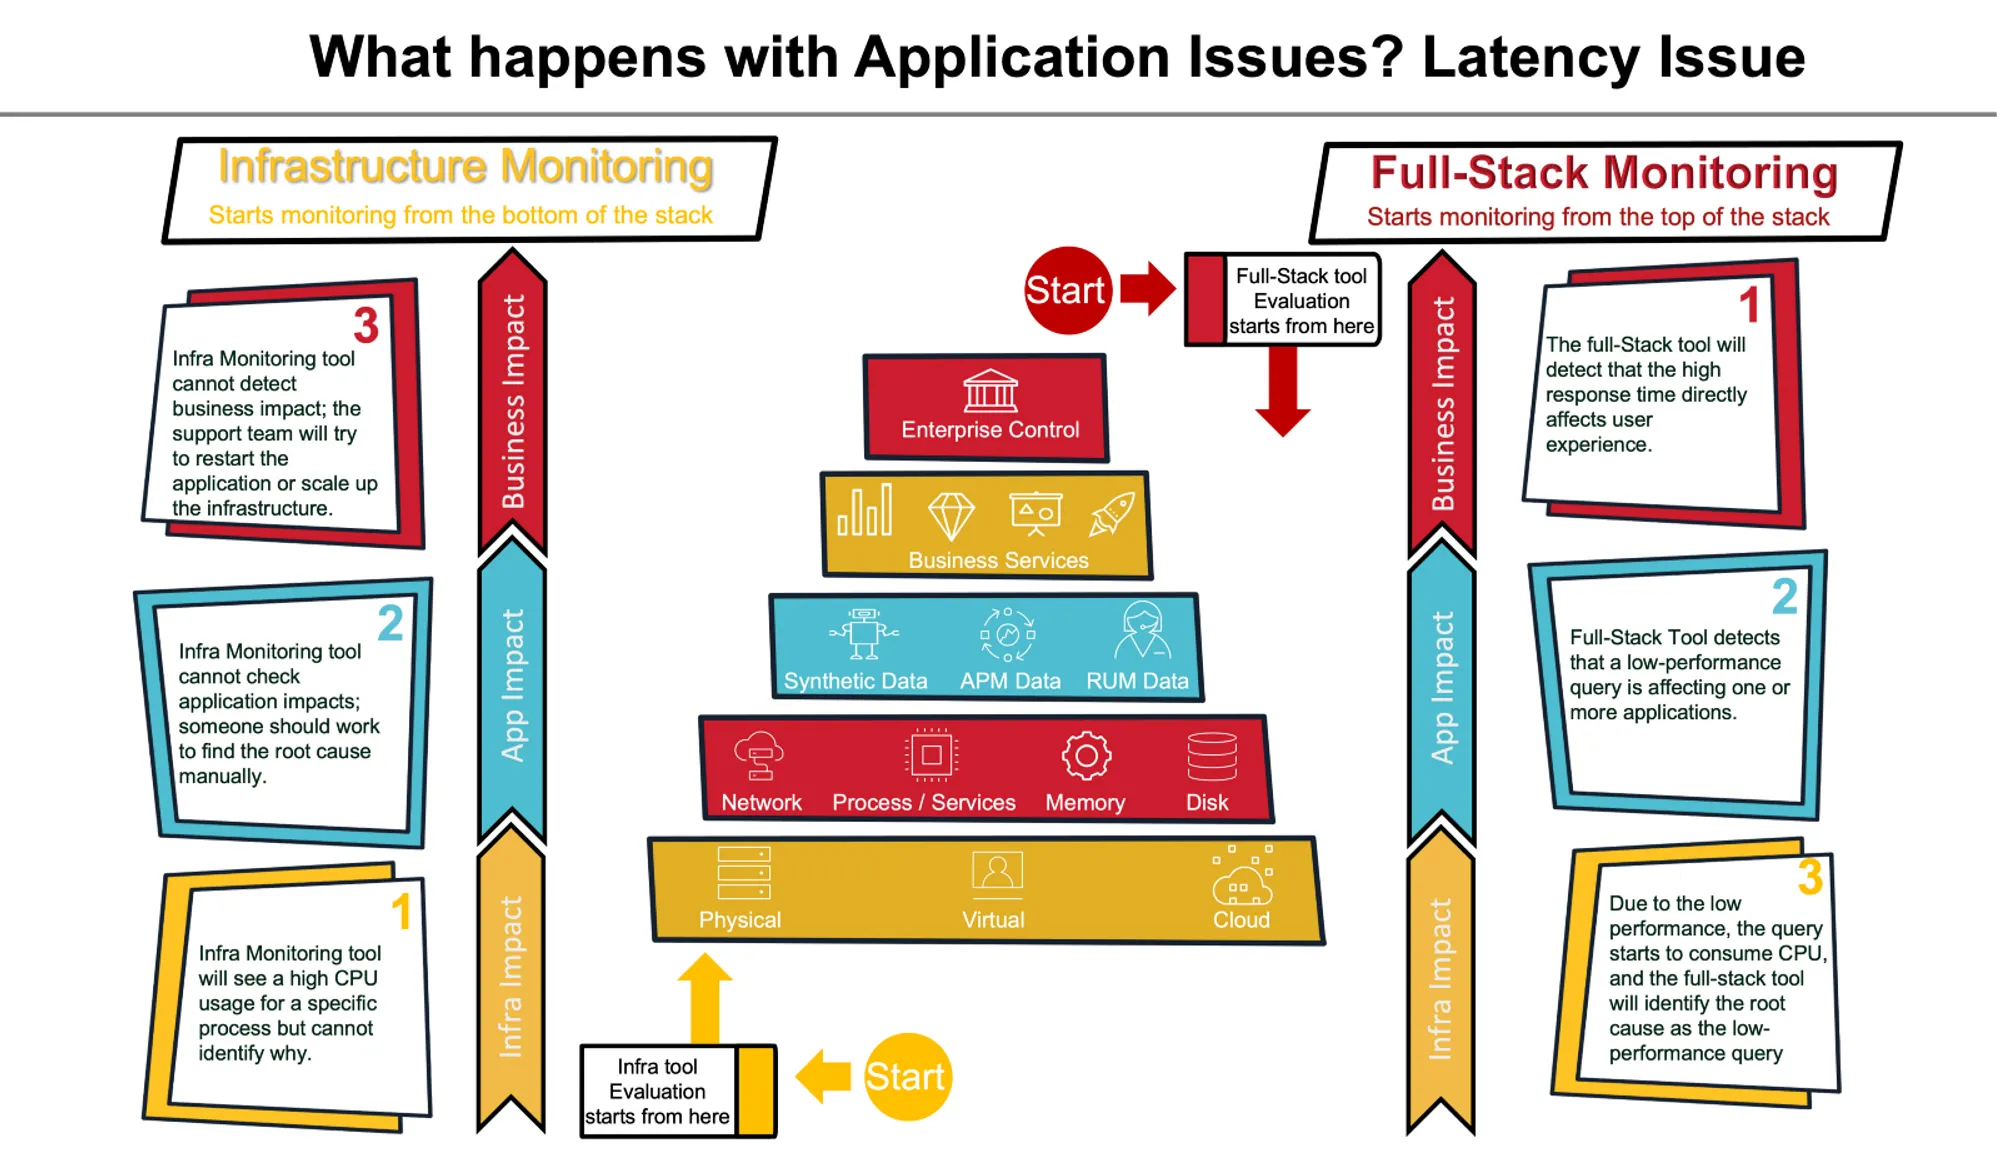
Component Monitoring vs Full Stack Monitoring
Monitoring cannot get all information to cover the full-stack monitoring; the solutions can extract some details from the metrics and logs but cannot associate all infrastructure components with all applications components limiting the full-stack analyses.
Observability can associate application and infrastructure automatically, allowing us to know if a problem on the infrastructure is impacting the application layer and vice versa, providing a more informed way of doing the root cause analysis.
Observability vs Monitoring explained with a web application
Imagine you need to monitor a web application that sells books. As shown in the image below, the user will start the interaction by finding a book, adding the book to the cart, proceeding with the checkout, and finishing the payment.
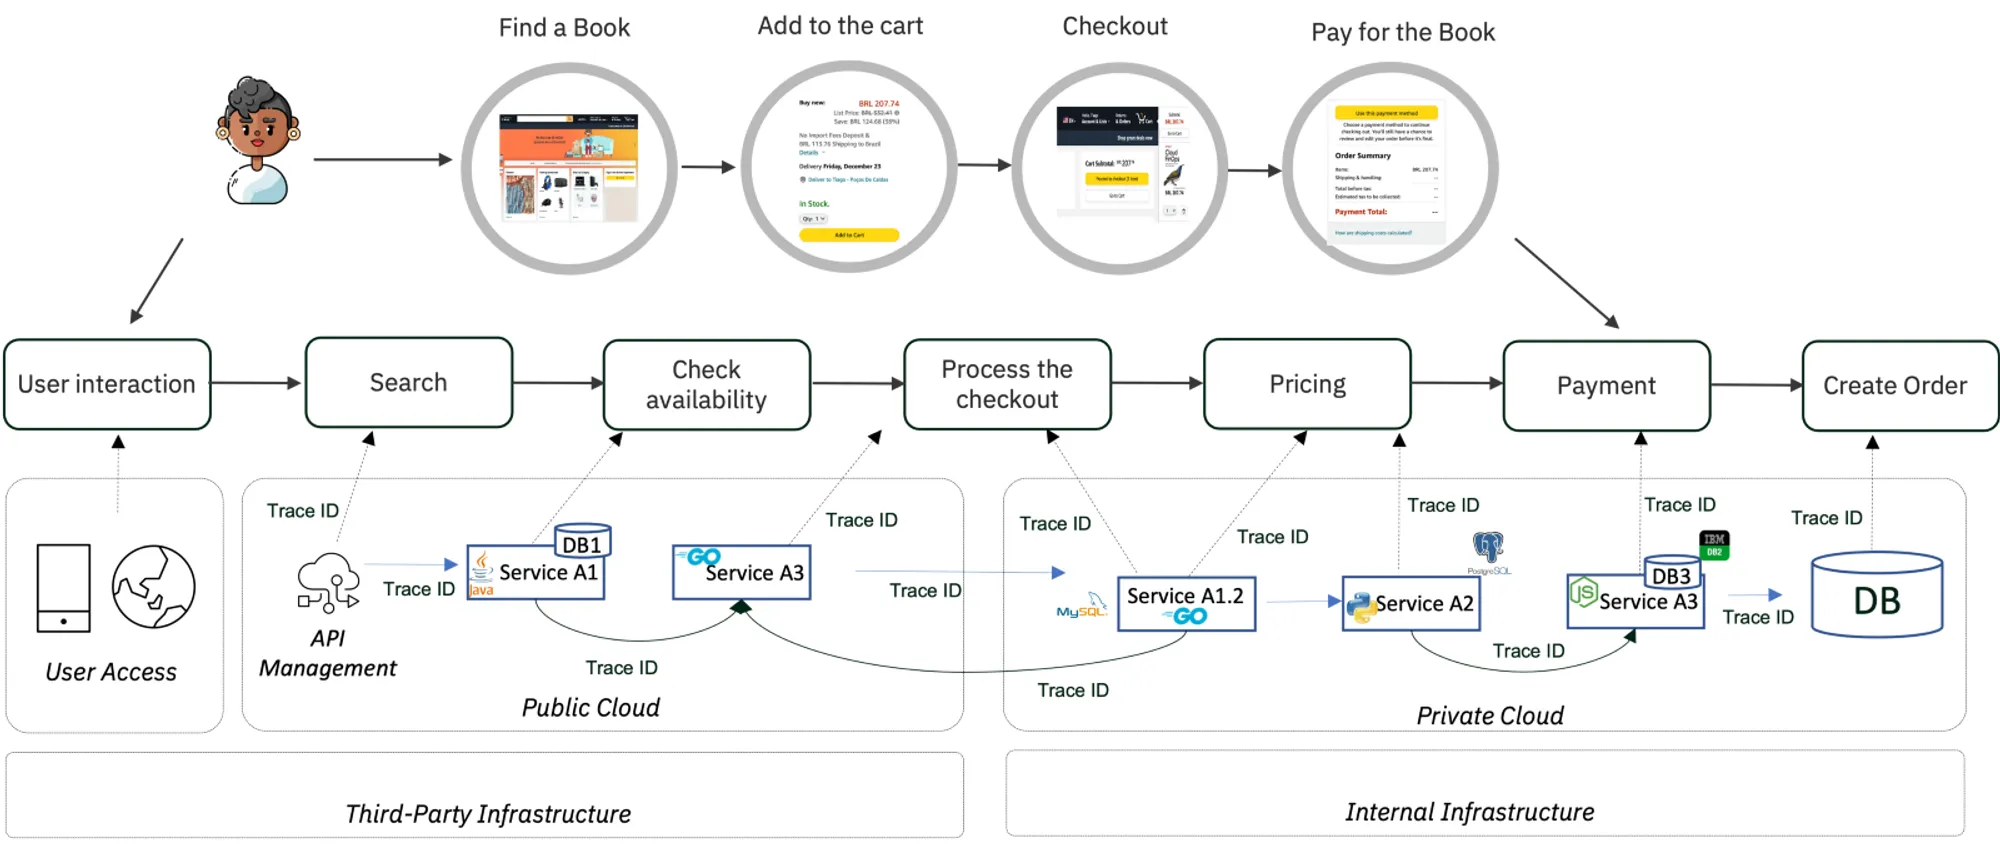
In the background, when a user clicks, the transaction will trigger APIs. Transactions will take place between different components of the microservices architecture, the services communicating with each other, saving data on the database, etc. Some of the services are located on the public cloud, others on-premise.
Imagine we are having latency issues while adding a book to the cart; the problem is caused by a low-performance query from the service A3, causing delays for all customers trying to add their books to the cart.
Monitoring does not help with root-cause analysis
Monitoring solutions cannot get transaction information, making the root cause analysis difficult. Monitoring solutions will detect multiple processes in the queue or running for a long time. They can also see servers saturated. But they cannot provide us with the information to have a good root cause analysis; manual investigations will be required.
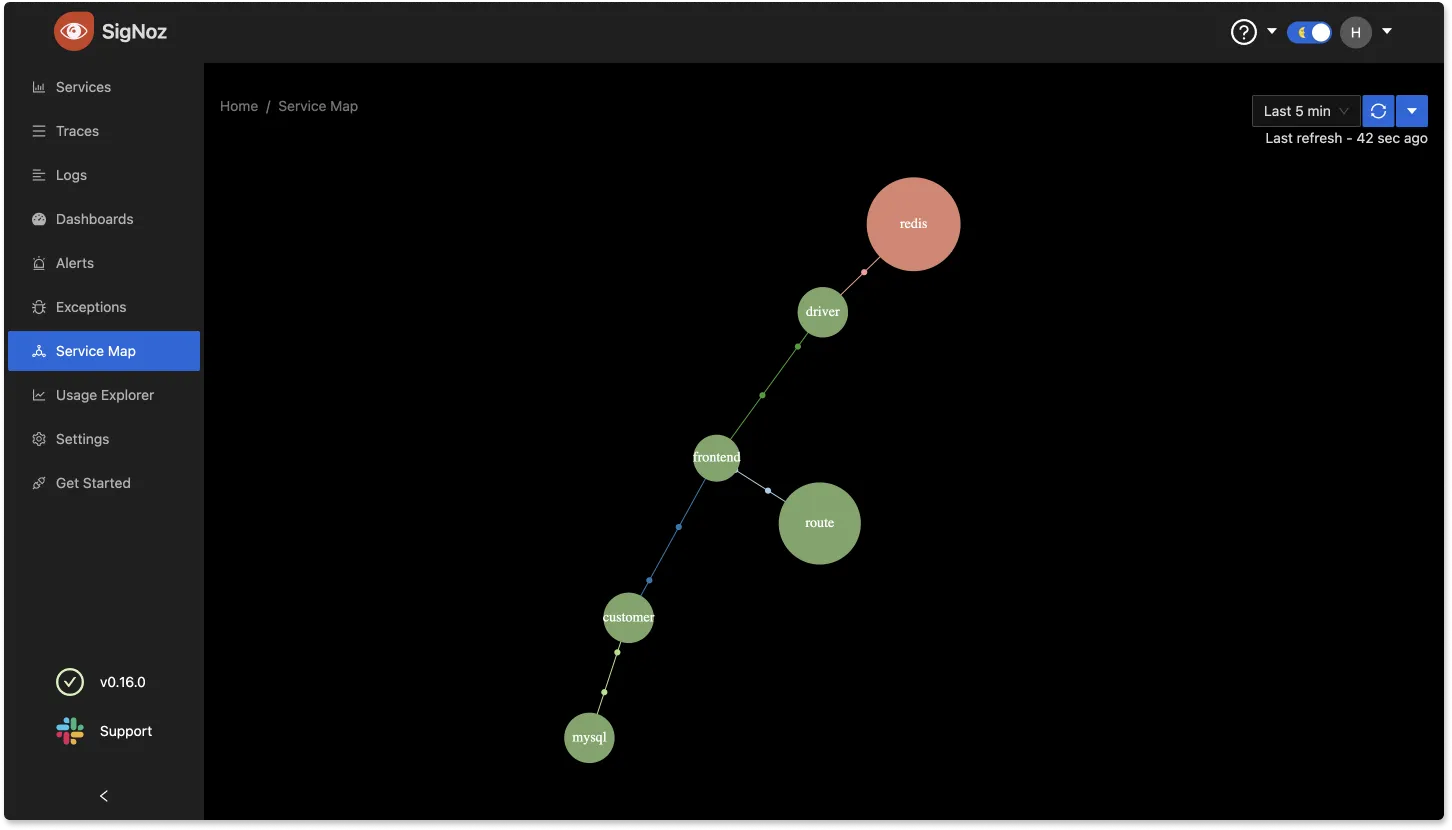
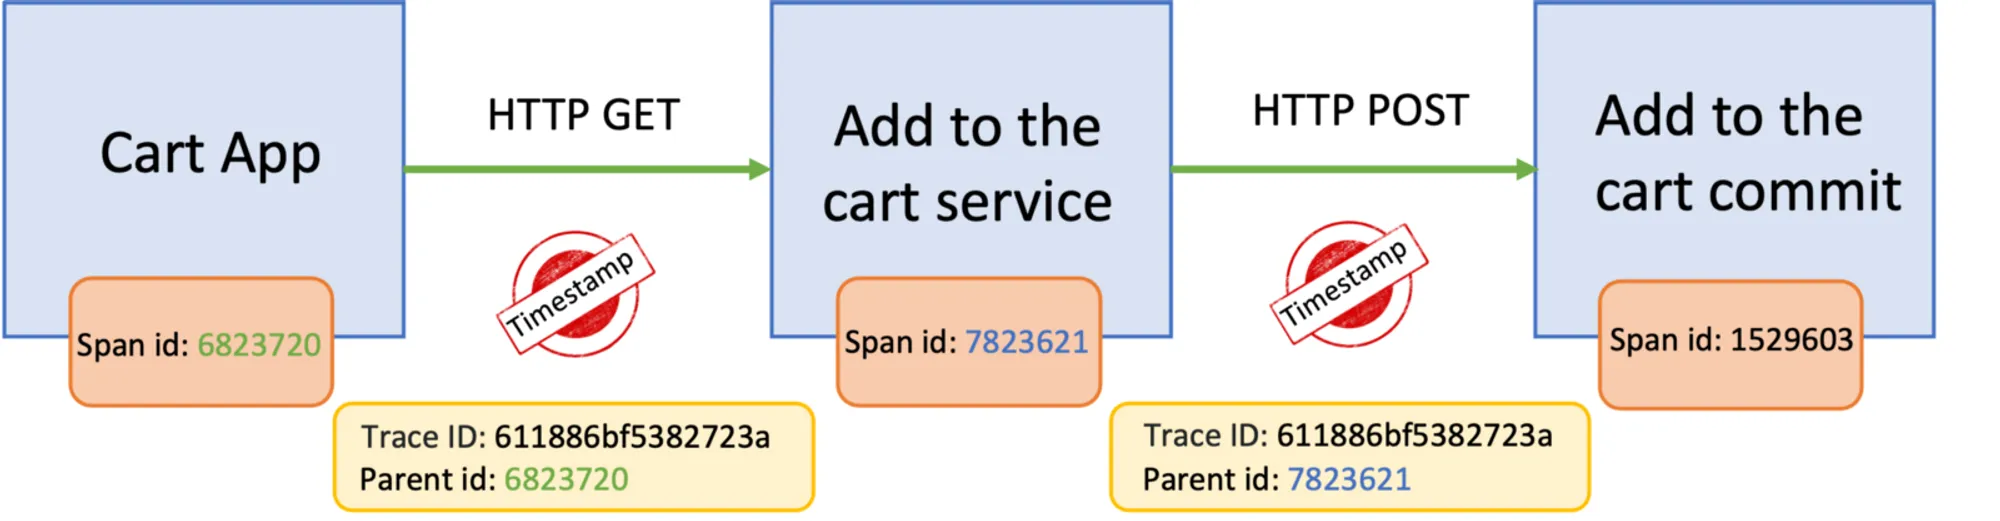
Observability enables contextual debugging
Observability solutions can provide a way to see which service is causing the delay, the details of each transaction, commands executed by the services, log data, and all other things required for an excellent automatic root cause analysis.
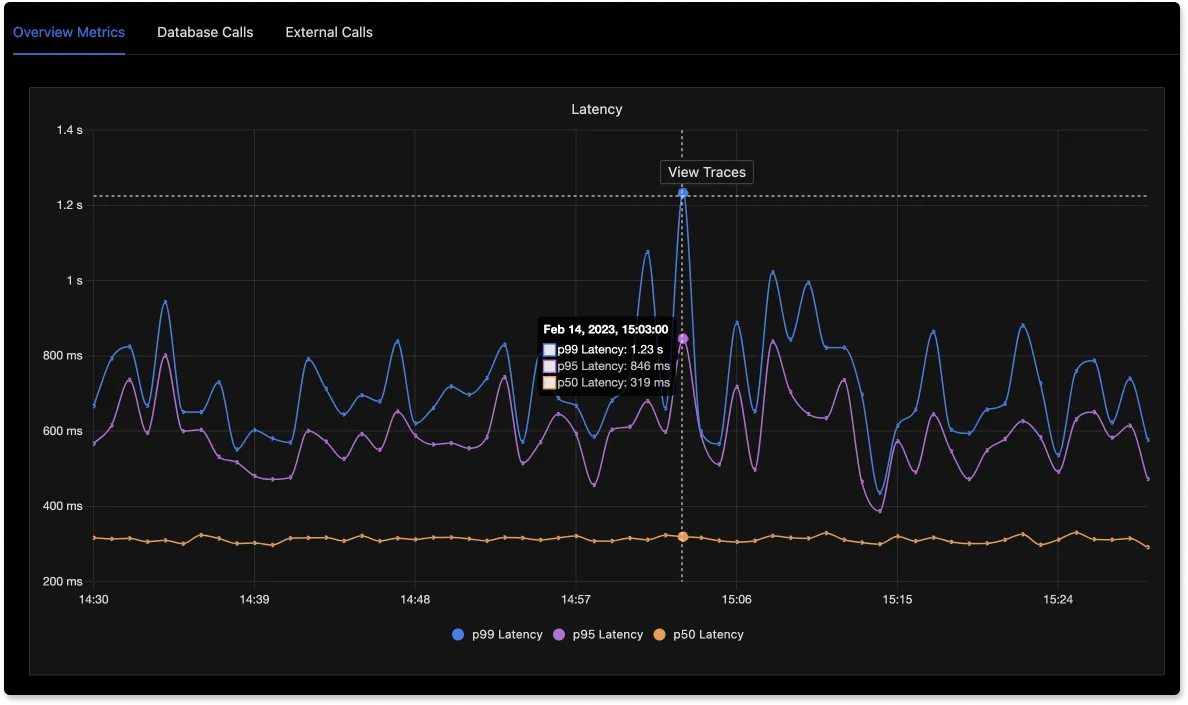
The image below represents a trace; Observability solutions can measure span by span, trace by trace, and the performance of each one. We can evaluate them using tools like SigNoz and analyze deeply what is happening.
Conclusion
You can only monitor a system that is observable.
Monitoring and Observability complement each other; we would never have Observability without monitoring, with each one serving a different purpose.
Monitoring tells you when something is wrong, while observability enables you to understand why. Monitoring is a subset of an essential action for observability.
Monitoring can be sufficient depending on the size and complexity of the company, but on Hybrid Cloud and Multi-Cloud strategies, it is impossible to deliver good results without Observability.
Getting started with Observability
SigNoz is a full-stack open source observability platform that provides metrics, traces, and logs under a single pane of glass. It uses OpenTelemetry for application instrumentation which is quietly becoming the world standard for observability instrumentation.
It also provides an intelligent correlation between these telemetry signals.
It is easy to get started with SigNoz. It can be installed on macOS or Linux computers in just three steps by using a simple install script.
The install script automatically installs Docker Engine on Linux. However, on macOS, you must manually install Docker Engine before running the install script.
git clone -b main <https://github.com/SigNoz/signoz.git>
cd signoz/deploy/
./install.sh
You can visit its documentation for instructions on how to install SigNoz using Docker Swarm and Helm Charts.

If you liked what you read, then check out our GitHub repo 👇
For related concepts, see Observability vs Monitoring vs Telemetry, APM vs Observability, and Observability vs Visibility. See also APM vs Distributed Tracing, the APM tools guide, and infrastructure monitoring with OpenTelemetry.
Related Posts
