OpenTelemetry Architecture - Understanding the design concepts
OpenTelemetry consists of several main components. But to understand the architecture, we will start by understanding some of the key design principles behind the design and architecture of OpenTelemetry.

But before that, let us have a brief overview of OpenTelemetry.
What is OpenTelemetry?
OpenTelemetry is an open-source observability framework that aims to standardize the generation, collection, and management of telemetry data(Logs, metrics, and traces). It is incubated under Cloud Native Computing Foundation(Cloud Native Computing Foundation), the same foundation which incubated Kubernetes.
OpenTelemetry follows a specification-driven development and provides client libraries to instrument applications in most programming languages. Once you have instrumented with OpenTelemetry, you should be able to collect various telemetry signals like logs, metrics, and traces from it.
What are OpenTelemetry Signals?
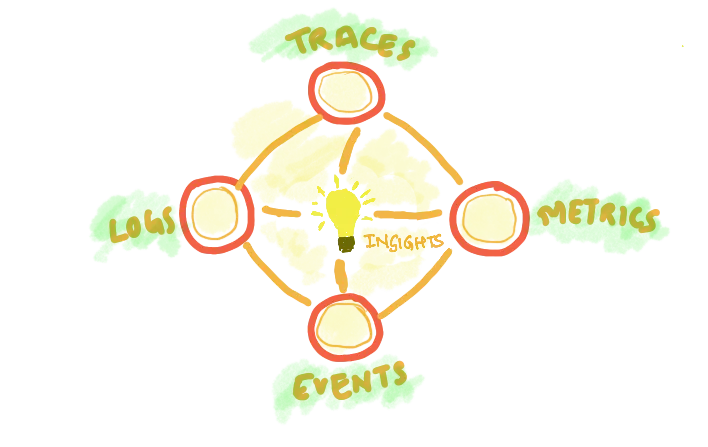
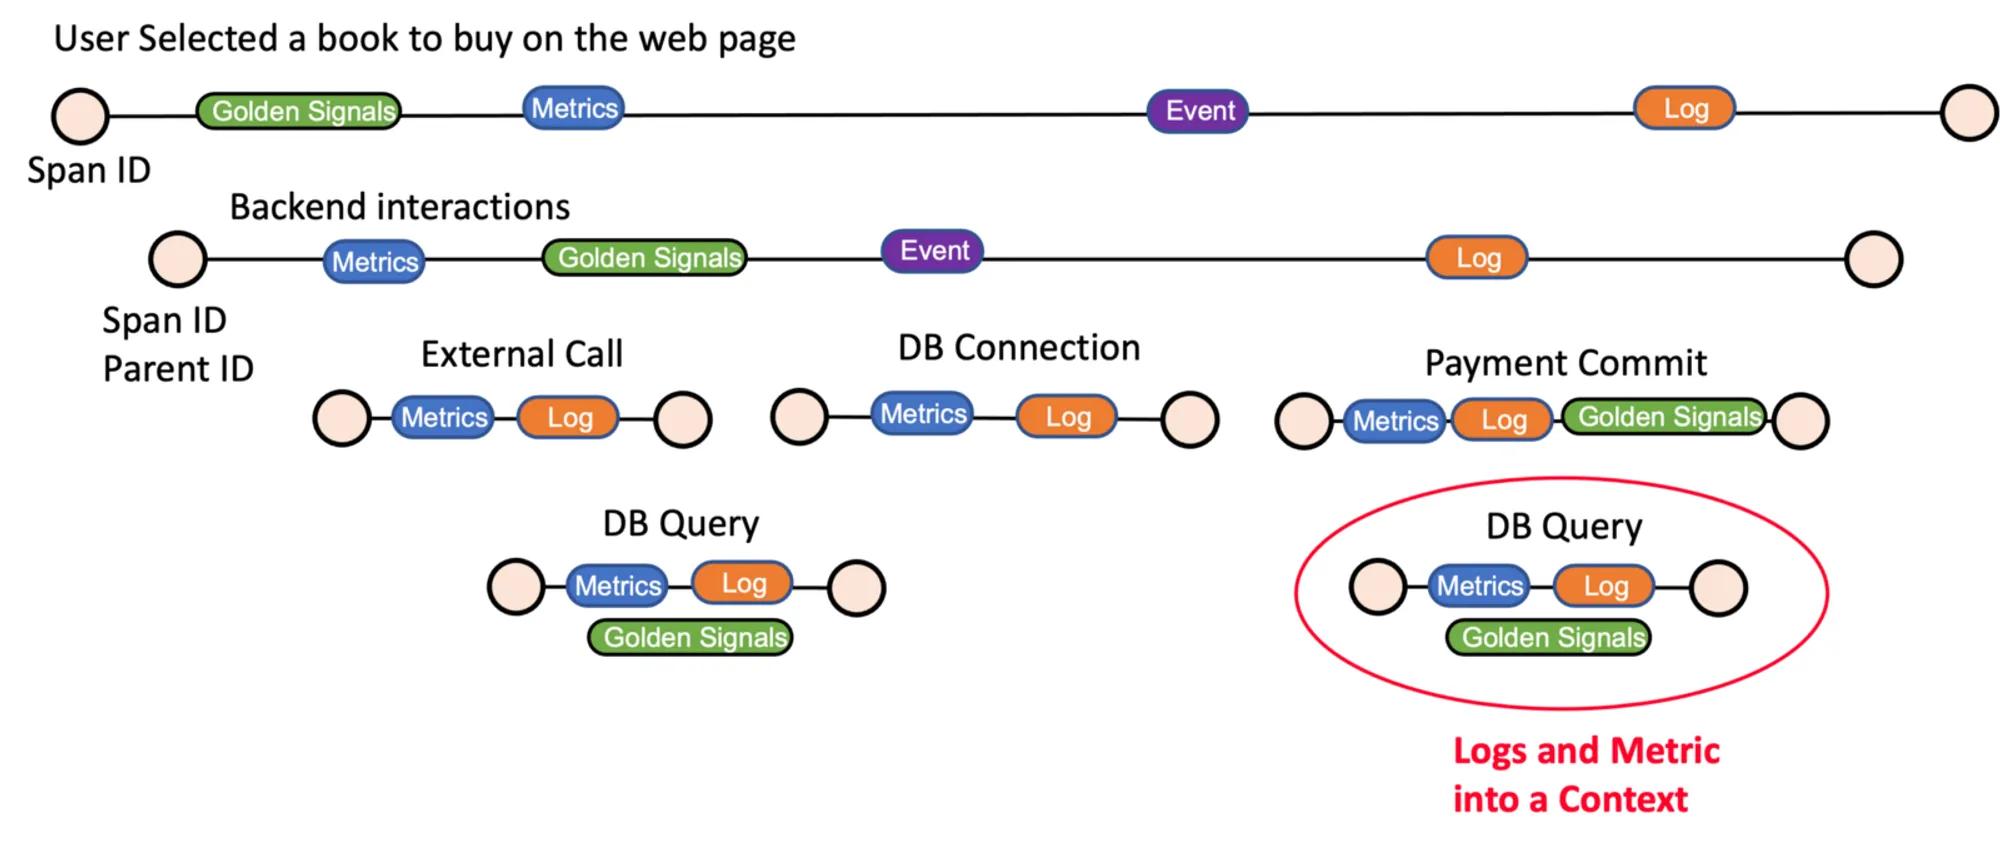
OpenTelemetry specification is organized into distinct types of telemetry, which we call signals. Currently, OpenTelemetry supports three telemetry signals: traces, metrics, and logs. Signals are the most fundamental unit of design in OpenTelemetry.
OpenTelemetry provides a way to merge the three signals into a single cohesive data so that debugging issues becomes very easy. For e.g, if you look at metrics on a chart, you can find the corresponding logs or find the trace associated with that metric instance if you have instrumented your application with OpenTelemetry client libraries.
Design Concepts:
OpenTelemetry is a cross-cutting concern that follows the execution of a transaction as it passes through each library and service. To achieve this feat, it uses a separation of concerns design principle to separate signals with the underlying system which stores context data and helps propagating data across the network calls.
All OpenTelemetry signals are built on top of a shared context propagation system. Other non-observability cross-cutting concerns may also use the context propagation mechanism to transport their data through a distributed system. Let's understand the key objects which form the Data transport system of OpenTelemetry.
Context:
The context object is a key-value store associated with an execution context, such as a thread or coroutine. Implementation of context is language-dependent, but OpenTelemetry provides a context object in every language.
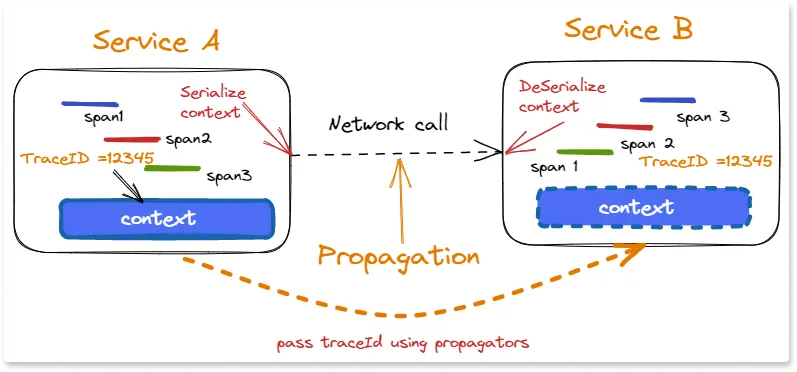
Propagators:
In order for distributed tracing to work, the trace context must be shared by every service that participates in the transaction. Propagators accomplish this by serializing and deserializing the context object, allowing the signals to follow their transactions across network requests.
Hopefully, you must be comfortable with the basic concepts now. Let's try to understand the design of OpenTelemetry from a client perspective.
Client Side Architecture :
An application is instrumented with OpenTelemetry by installing a collection of software libraries: the API, the SDK (software development kit), SDK plug-ins, and library instrumentation. This set of libraries is referred to as the OpenTelemetry client.
As you can see from the diagram above, there are two key concepts to understand -
the API & the SDK.
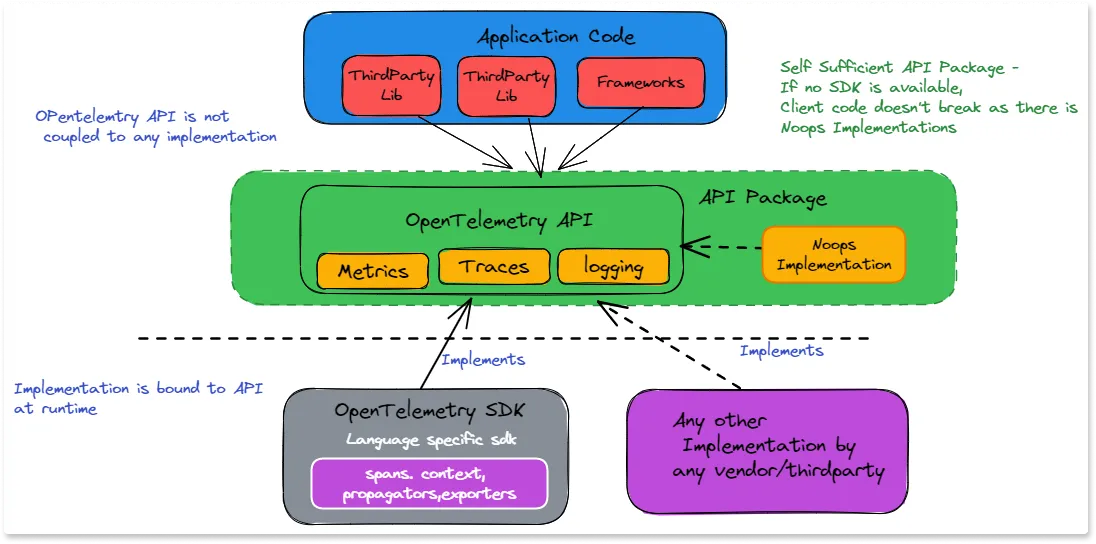
The OpenTelemetry API
The API is the bare-bones interface for instrumentation and does not provide any implementation. Third-party libraries or vendors can instrument their code using the API. This is the only part of OpenTelemetry that shared libraries and application logic should take a direct dependency on.
The OpenTelemetry SDK
The SDK is a complete language library that provides implementations of the API. The SDK implements the OpenTelemetry API by providing a plug-in framework. When an application starts, an implementation can be loaded by registering a provider for each signal.
The providers become the receivers of all API calls. When no providers are loaded, the API defaults to a no-op provider. This makes OpenTelemetry instrumentation safe to include in shared libraries. If the application does not use OpenTelemetry, the API calls simply become no-ops and do not incur any overhead.
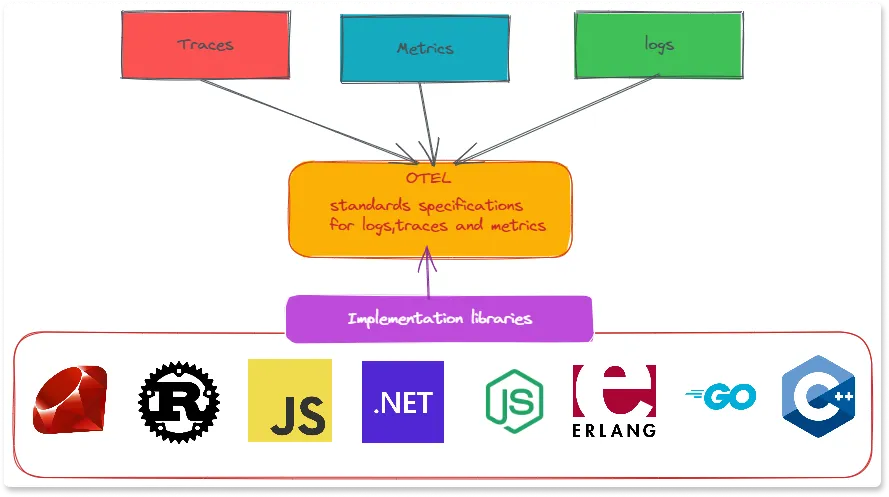
OpenTelemetry provides SDK implementations for major languages, as shown below.
Server-Side Architecture:
The server-side architecture is mostly concerned with what to do with the telemetry data which is generated in your application by using the API and SDK. The telemetry data needs to be received, processed, and then sent to the target visualization or storage tools like SigNoz.
As per the figure, you see three key components:
On the client side:
The applications uses an agent ( Auto instrumentation ) to produce telemetry data using zero code instrumentation.
On the server side:
All the signal data is sent to a Collector component which is considered to be the heart of the system. It is optional, but any matured and complex implementation will need an OpenTelemetry collector component in the architecture.
All the data gets processed via the Collector and then sent to different observability backends. More on Collectors later, but the collector is responsible for receiving, processing, and sending the signal data to the target visualization tool.
Application telemetry data can now be exported to multiple backends, depending on the requirements. Also, note that you can plug in various out-of-box exporters for any target backend.
For example - Jaeger backend accepts both jaeger format as well as OTLP format.
But Zipkin needs data in Zipkin format, so Zipkin exporter translates the trace data from OTLP to Zipkin native format. In the diagram , you can also see that we can configure the exporters directly from the agent library without routing the traces via collector, but such implementations are for simplified requirements only.
Understanding OpenTelemetry Collectors :
OpenTelemetry Collector is a vendor-independent agent that can receive, process, and export telemetry data. It can receive telemetry data in various formats, including OTLP (the native OpenTelemetry protocol), Jaeger, Zipkin, Prometheus, and other formats, including proprietary ones.
The OpenTelemetry Collector then forwards the telemetry it receives to one or more observability backends. It also supports processing and filtering of telemetry data before export, for example, batching data to increase the efficiency of compression or converting between formats, etc.
Components in OpenTelemetry Collector
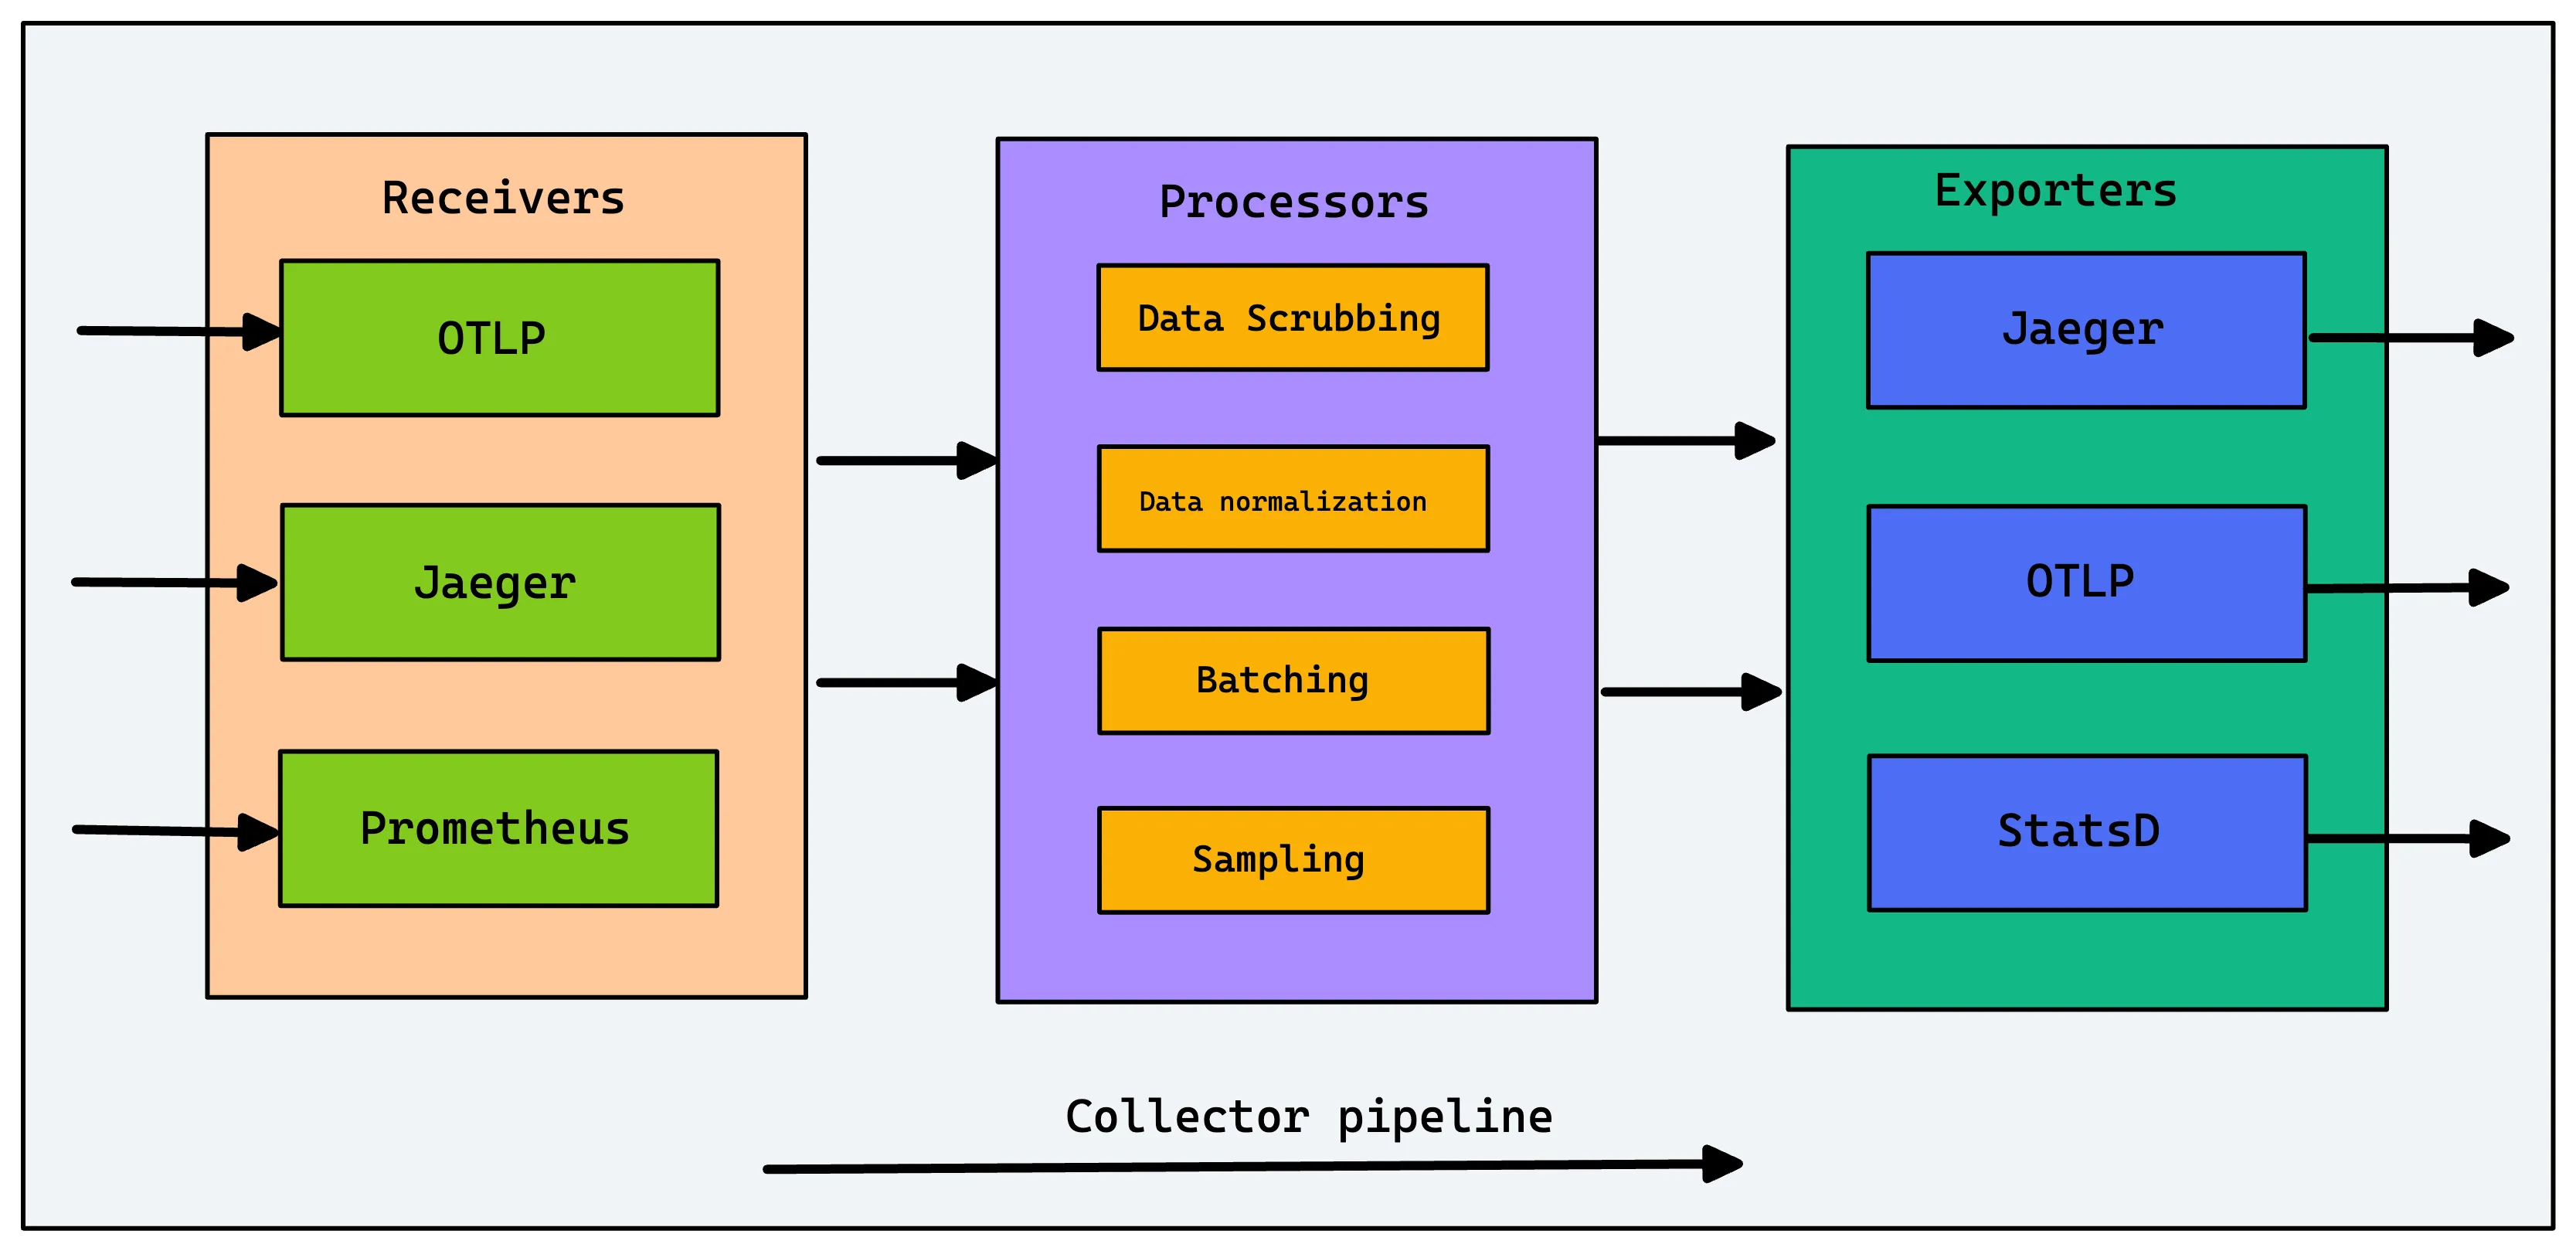
The Collector consists of three components that access telemetry data:
Receivers — A receiver, which can be push or pull-based, is how data gets into the Collector. Receivers may support one or more data sources).
Processors — Processors are run on data between being received and being exported. Processors are optional though some are recommended. Processors are very useful when you want to do sampling, enriching, or any additional processing with the telemetry data.
Exporters — An exporter, which can be push or pull-based, is how you send data to one or more backends/destinations. Exporters may support one or more data sources. Once the processing is completed, the data can be exported by the Collector to the required destinations.
OpenTelemetry Collector also provides a feature known as pipelines . For a given use case, we can configure a pipeline as below to handle a particular kind of signal.
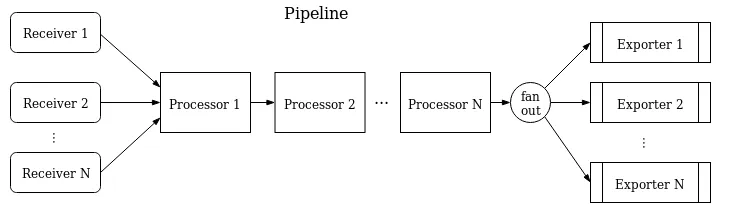
Pipeline defines a path the data follows in the Collector, starting from reception, then further processing or modification, and finally exiting the Collector via exporters. You can chain the processors, and they will get executed in the order of their definition. Everything is configurable.
In the example above, we can configure multiple receivers to feed the data to a set of processors and then export the data to multiple exporters.
With this, we have come to conclude our topic on the Architecture of OpenTelemetry.
Conclusion
OpenTelemetry is quietly becoming the world standard for instrumenting cloud-native applications. It is the right choice for instrumentation as it future-proofs your observability set up from any vendor lock-ins. It is also beneficial for companies as onboarding becomes consistent, and with time a good knowledge base can be built.
It is easy to get started with OpenTelemetry. You can check out instrumentation instructions here. As OpenTelemetry does not provide a backend, you need to choose one which supports OpenTelemetry. An OpenTelemetry-native APM can be a good choice for your observability backend.
SigNoz is a full-stack open source APM that you can use as your OpenTelemetry backend. It provides logs, metrics, and traces under a single pane of glass with intelligent correlation between the telemetry signals.
Getting started with SigNoz
SigNoz Cloud is the easiest way to run SigNoz. Sign up for a free account and get 30 days of unlimited access to all features.

You can also install and self-host SigNoz yourself since it is open-source. With 24,000+ GitHub stars, open-source SigNoz is loved by developers. Find the instructions to self-host SigNoz.
Related Posts
