Tracking Web Vitals & Widget Performance in Next.js with OpenTelemetry
Web vitals are critical to understanding real-world user experience. Metrics like loading time, layout stability, and interactivity directly impact how users perceive your app—and they influence SEO rankings too.
By capturing these metrics with OpenTelemetry and visualizing them in a tool like SigNoz, you get a complete view of frontend performance, tightly correlated with backend traces.
| Metric | What It Measures | Good | Needs Improvement | Poor |
|---|---|---|---|---|
| LCP | Load time for main content | ≤ 2.5s | 2.5–4.0s | > 4.0s |
| INP | Interaction responsiveness | ≤ 200ms | 200–500ms | > 500ms |
| CLS | Layout shift stability | ≤ 0.1 | 0.1–0.25 | > 0.25 |
| FCP | First visible render | ≤ 1.8s | 1.8–3.0s | > 3.0s |
| TTFB | Time until first byte received | ≤ 800ms | 800ms–1.8s | > 1.8s |
Use these metrics to set baselines, identify regressions, and drive performance improvements where they actually matter: in the user’s browser.
1. Install Dependencies
npm install @opentelemetry/exporter-metrics-otlp-http \
            @opentelemetry/resources \
            @opentelemetry/sdk-metrics \
            @opentelemetry/semantic-conventions \
            web-vitals
Dependencies Explained:
@opentelemetry/exporter-metrics-otlp-http: Exports metrics to collector via HTTP@opentelemetry/resources: Defines service resource information@opentelemetry/sdk-metrics: Core metrics SDK for browser@opentelemetry/semantic-conventions: Standard attribute namesweb-vitals: Google’s web vitals measurement library
2. Create lib/web-vitals.ts
"use client";
import { MeterProvider, PeriodicExportingMetricReader } from "@opentelemetry/sdk-metrics";
import { OTLPMetricExporter } from "@opentelemetry/exporter-metrics-otlp-http";
import { Resource } from "@opentelemetry/resources";
import { metrics } from "@opentelemetry/api";
import { ATTR_SERVICE_NAME } from "@opentelemetry/semantic-conventions";
import { onLCP, onINP, onCLS } from "web-vitals";

let isInitialized = false;
export function initializeWebVitals() {
  if (typeof window === "undefined" || isInitialized) return;

  const resource = new Resource({
    [ATTR_SERVICE_NAME]: "nextjs-app-frontend",
  });

  const reader = new PeriodicExportingMetricReader({
    exporter: new OTLPMetricExporter({ url: "http://localhost:4318/v1/metrics" }),
    exportIntervalMillis: 10000,
  });

  const meterProvider = new MeterProvider({ resource, readers: [reader] });
  metrics.setGlobalMeterProvider(meterProvider);
  const meter = metrics.getMeter("web-vitals");

  const lcp = meter.createHistogram("web_vitals_lcp", { unit: "ms" });
  const inp = meter.createHistogram("web_vitals_inp", { unit: "ms" });
  const cls = meter.createUpDownCounter("web_vitals_cls", { unit: "1" });

  const record = (metric: any) => {
    const attrs = {
      page: window.location.pathname,
      rating: metric.rating,
    };
    if (metric.name === "LCP") lcp.record(metric.value, attrs);
    else if (metric.name === "INP") inp.record(metric.value, attrs);
    else if (metric.name === "CLS") cls.add(metric.value, attrs);
  };

  onLCP(record);
  onINP(record);
  onCLS(record);
  isInitialized = true;
}
3. Add WebVitalsProvider
// components/web-vitals-provider.tsx
"use client";
import { useEffect } from "react";
import { initializeWebVitals } from "@/lib/web-vitals";

export function WebVitalsProvider({ children }: { children: React.ReactNode }) {
  useEffect(() => {
    initializeWebVitals();
  }, []);
  return <>{children}</>;
}
4. Use in Your Layout
// app/layout.tsx
import { WebVitalsProvider } from "@/components/web-vitals-provider";

export default function RootLayout({ children }: { children: React.ReactNode }) {
  return (
    <html lang="en">
      <body>
        <WebVitalsProvider>{children}</WebVitalsProvider>
      </body>
    </html>
  );
}
5. Enable CORS for the Collector
receivers:
  otlp:
    protocols:
      http:
        endpoint: 0.0.0.0:4318
        cors:
          allowed_origins:
            - "http://localhost:3000"
          allowed_headers: ["*"]
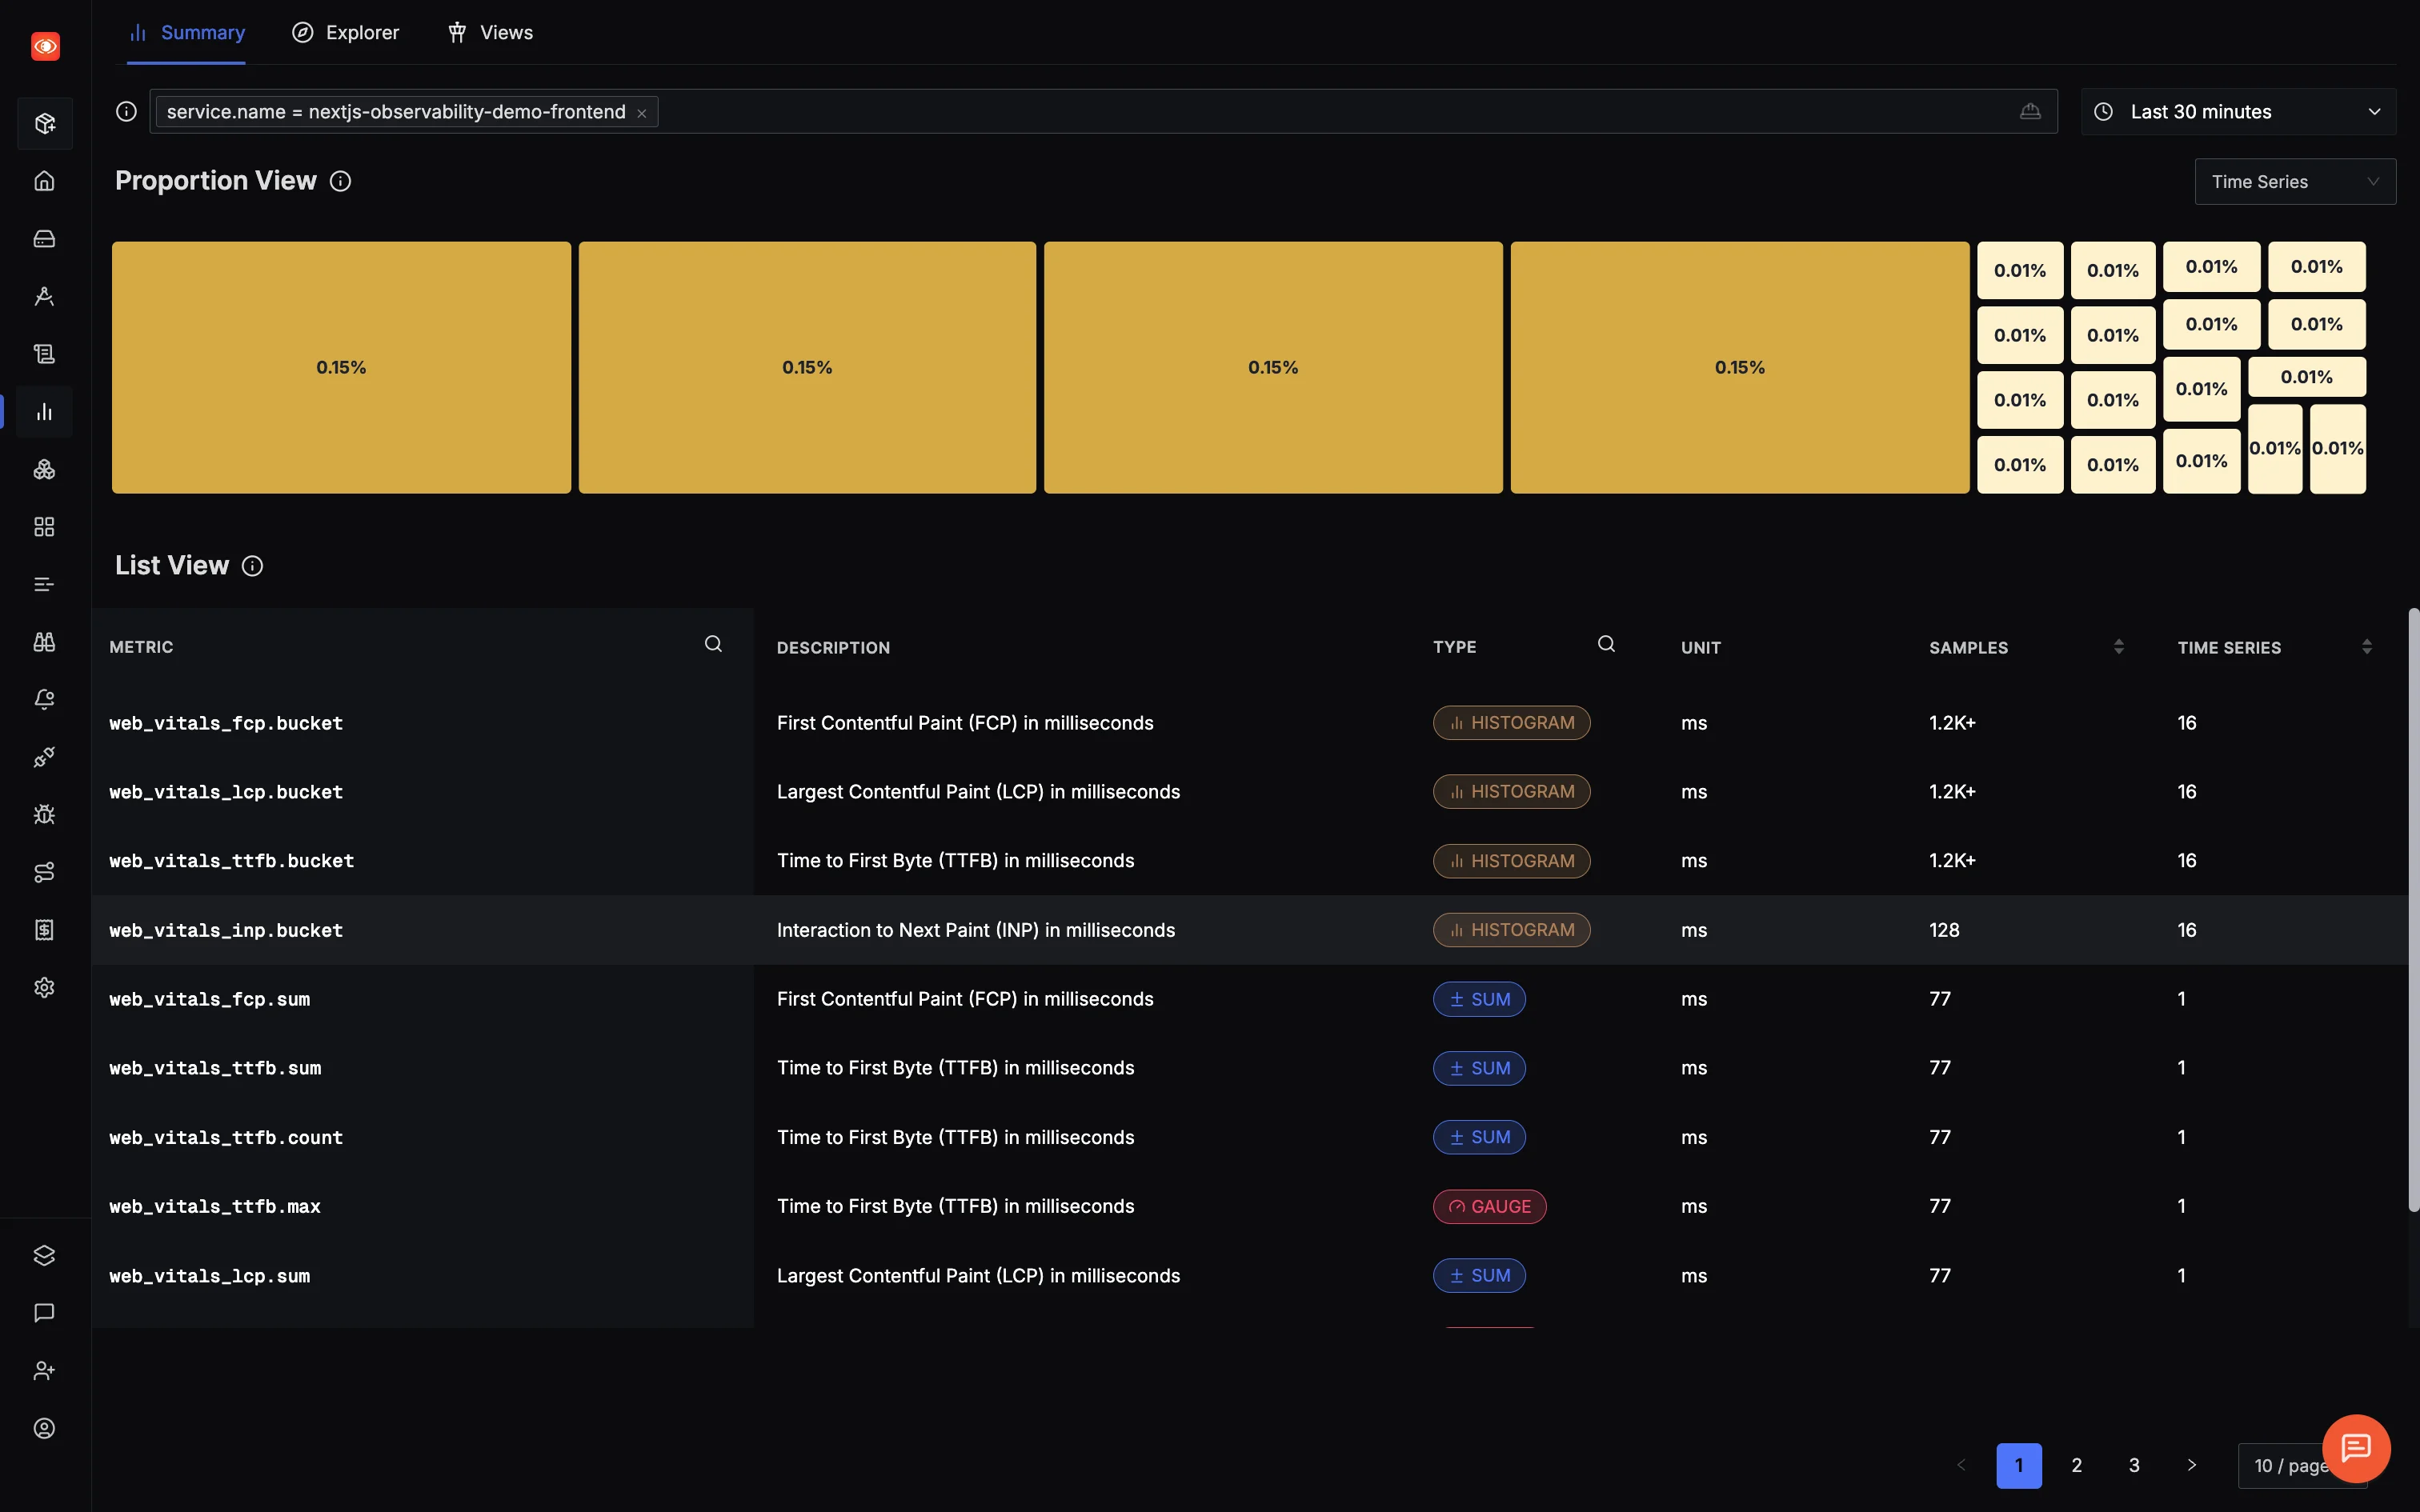
6. Visualize in SigNoz
Navigate to Metrics
Look for metrics like
web_vitals_lcp,web_vitals_inp, andweb_vitals_cls
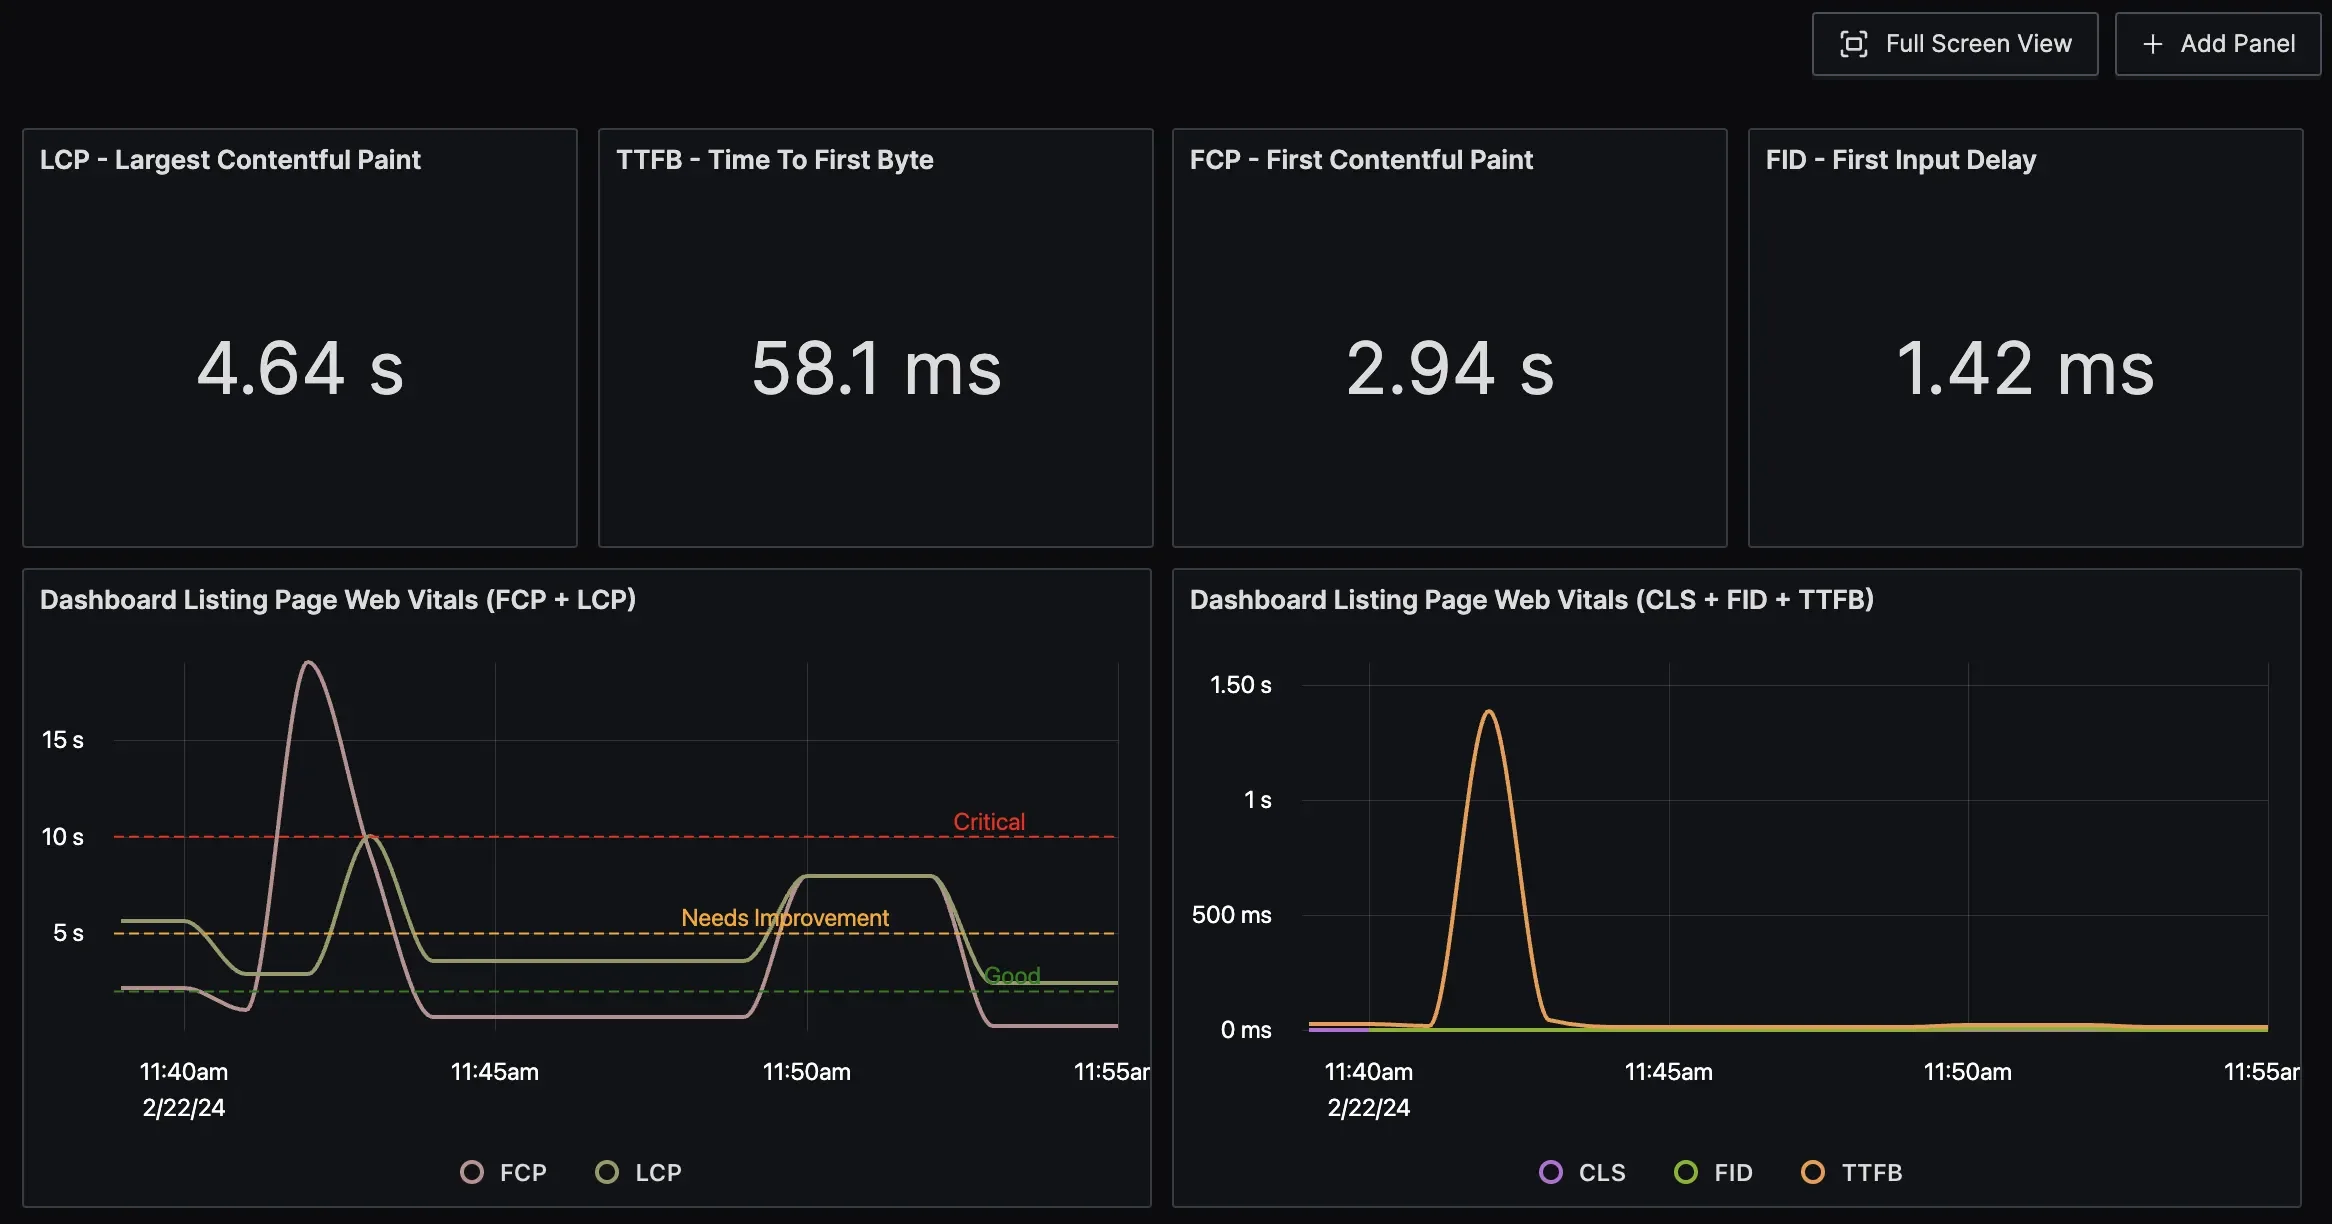
View Web Vitals metrics in SigNoz - track LCP, INP, and CLS performance over time with page-level breakdowns Create a dashboard to track these over time

Create custom dashboards in SigNoz to monitor Web Vitals trends and identify performance regressions across different pages
Quick Tips
- Reduce
exportIntervalMillisin production to lower overhead - Sample metrics if your traffic is high
- Avoid sending user-identifiable data in metric attributes
With just a few lines, you now get real user performance data streaming into your observability stack.
Tracking Third-Party Widget Performance
Third-party widgets—chatbots, analytics, ads, support tools—bring useful functionality, but also unpredictable performance baggage. A slow widget can tank your LCP, stall interactivity, or wreck your layout—and because it’s not your code, debugging becomes a guessing game.
You can’t instrument inside a third-party <iframe> or <script>, but you can measure its impact on your app.
The Strategy: Wrap and Measure
Use OpenTelemetry’s manual instrumentation to wrap the widget with a custom span:
// components/ThirdPartyWidget.tsx
"use client";
import { useEffect } from "react";
import { trace } from "@opentelemetry/api";

export function ThirdPartyWidget() {
  useEffect(() => {
    const tracer = trace.getTracer("widget-load-tracer");
    const span = tracer.startSpan("load_intercom_widget");

    const script = document.createElement("script");
    script.src = "https://widget.example.com/widget.js";
    script.async = true;

    script.onload = () => {
      span.end(); // Marks load completion
    };

    document.body.appendChild(script);
  }, []);

  return null;
}
This span tracks how long the widget takes to load and reports it to your tracing backend (e.g., SigNoz). Repeat this pattern for other widgets as needed.
Why It’s Worth Doing
Find Slow Widgets: Know exactly which scripts are hurting UX
Back Up Decisions: Use data to lazy-load, replace, or remove costly widgets
Vendor Accountability: Quantify impact when negotiating SLAs
Improve CWV Scores: Clean up your LCP/INP by ditching bloated embeds
Third-party performance isn’t a black box anymore. If it runs on your page, you should be tracking it.
Next: Structured Logging with Trace Correlation
While metrics tell you what is happening, logs tell you why. In the next article, we'll implement structured logging across both server and browser environments—with full trace correlation so you can jump from a performance spike directly to the relevant log entries.
Next in "OpenTelemetry NextJS Tutorial" (Part 4 of 5)
