OpenTelemetry Webinars - The Trace API
Join Nočnica Mellifera and Srikanth to talk in detail about the OpenTelemetry Trace API. We'll talk about adding spans, events, attributes and other extra info, whether it's really possible to replace logs with traces, and more.
Summary of the Talk
Find the conversation transcript below.👇
Nica: I've been working with my dog lately; it's a great dog at the house. But it was a pandemic dog, one of those dogs you get during the pandemic, so it's not great with new people and new situations. Very loving and sweet around the house, but incredibly nervous outside.
Doesn't bark at anybody but just wants to go home. We're trying to get it to associate new situations with nice things, with treats, with hearing a nice sound, and being like, "Hey, come over here." If you hear a bang or see a car drive towards you, come over here, and you can get a nice treat. Come nibble on this. I just wish someone would do that for me. I wish someone would follow me around and be like, "Hey, do you have a rough day? Here, have a little piece of candy. It'll cheer you up." And I'll start to associate difficult situations with good things happening.
It's time for the OpenTelemetry webinar. Thank you so much for joining us. I've started telling a little anecdote at the beginning of the show instead of saying, "I think we're streaming," because it gives me time to check that we are live, and we are live. Let me hide this for a second. I promise that we are going to talk about the OpenTelemetry Trace API.
We have Srikanth as our guest. Srikanth, introduce yourself and tell them what you do for the SigNoz team.
Srikanth: Hey, everyone. I'm Srikanth. I work at SigNoz. I mostly work on the metrics and alerting parts of the signal system. Also, I spend quite an amount of time working in OpenTelemetry. I used to be a maintainer for the OpenTelemetry Python SDK and currently work with the OpAMP.
Nica: That's awesome. You're here today because we had an episode about the API in general and the division between the API and the SDK. It became obvious that we wanted to talk a little bit more in-depth about multiple aspects of this API.
I wanted to talk today a little bit about some of the questions that I had about tracing. As you're joining this call, please feel free to pop into the comment section and add your questions. We'll ask some of those here, but these are the ones that I wrote. We have a little walkthrough through it. How do you want to go through this? Do you want to just start with your slides first, or however you'd like to do it?
Srikanth: Let's start with the slides first.
I will give a brief overview of this, like what the agenda is. In the last session, we looked into what are the different aspects of OpenTelemetry, the major parts of OpenTelemetry, what is API, what is SDK, what the collector does, and who cares about what. Today, we want to talk about the Trace API in detail.
This is particularly relevant for the folks who get some Telemetry data out of the auto instrumentation but to make full use of OpenTelemetry's potential, you need to start instrumenting your code. Auto instrumentation is great to get started, but at some point, you need to start manual instrumentation. That's where having some idea about the trace API gets into the picture.
Nica: One question I had was, do you think everybody is going to end up doing some amount of manual instrumentation? My understanding is that it probably makes sense to do some kind of hybrid, where it's not that you're saying, "Oh, we use auto instrumentation, and then you pull it out and start all your traces manually." It usually makes more sense to say, "Hey, you have automatic instrumentation running, maybe kicking off most of your traces, and then you're adding to it with manual calls." Is that generally what you would expect to see?
Srikanth: It's correct. What you generally do with manual instrumentation is you probably won't start the trace by yourself because auto instrumentation is at the forefront. It already starts the trace journeys somewhere within the framework. You would generally add a span to certain parts of your codebase or application not covered by auto instrumentation. You start a new span, let's say you have some auto instrumentation spans at the start of the framework request, but there's nothing beyond that. You have a certain functionality within your application, that is not traced, but you would like to because that's where the most contextual information is available. There you generally start the span since there is already a trace started upstream. What you get is a span that you're generating within your application, it's tied up to the existing span, so there's no new. You generally don't create a new trace on your own unless there's a very specific requirement.
Nica: This makes some sense. There are always going to be chunks of your codebase that aren't hit by auto-instrumentation at all. For example, if you're handling web requests in some kind of web server, kicking off a request is pretty straightforward. There should be a million little hints to the people who created this automatic instrumentation library that, "Yeah, I think a request is starting now. I think we're handling something that we want to call a new trace."
So, you're very often adding spans, not saying, "Hey, this trace is just getting missed." Obviously, in my time, I've seen examples where it's like, "Oh, this one type is not showing up," and I'm sorry. We can hop back to the presentation. I didn't mean to get us off track with my questions already, but yeah, we can alternate between the questions on the slides.
Srikanth: Nice. All right, next slide, please.
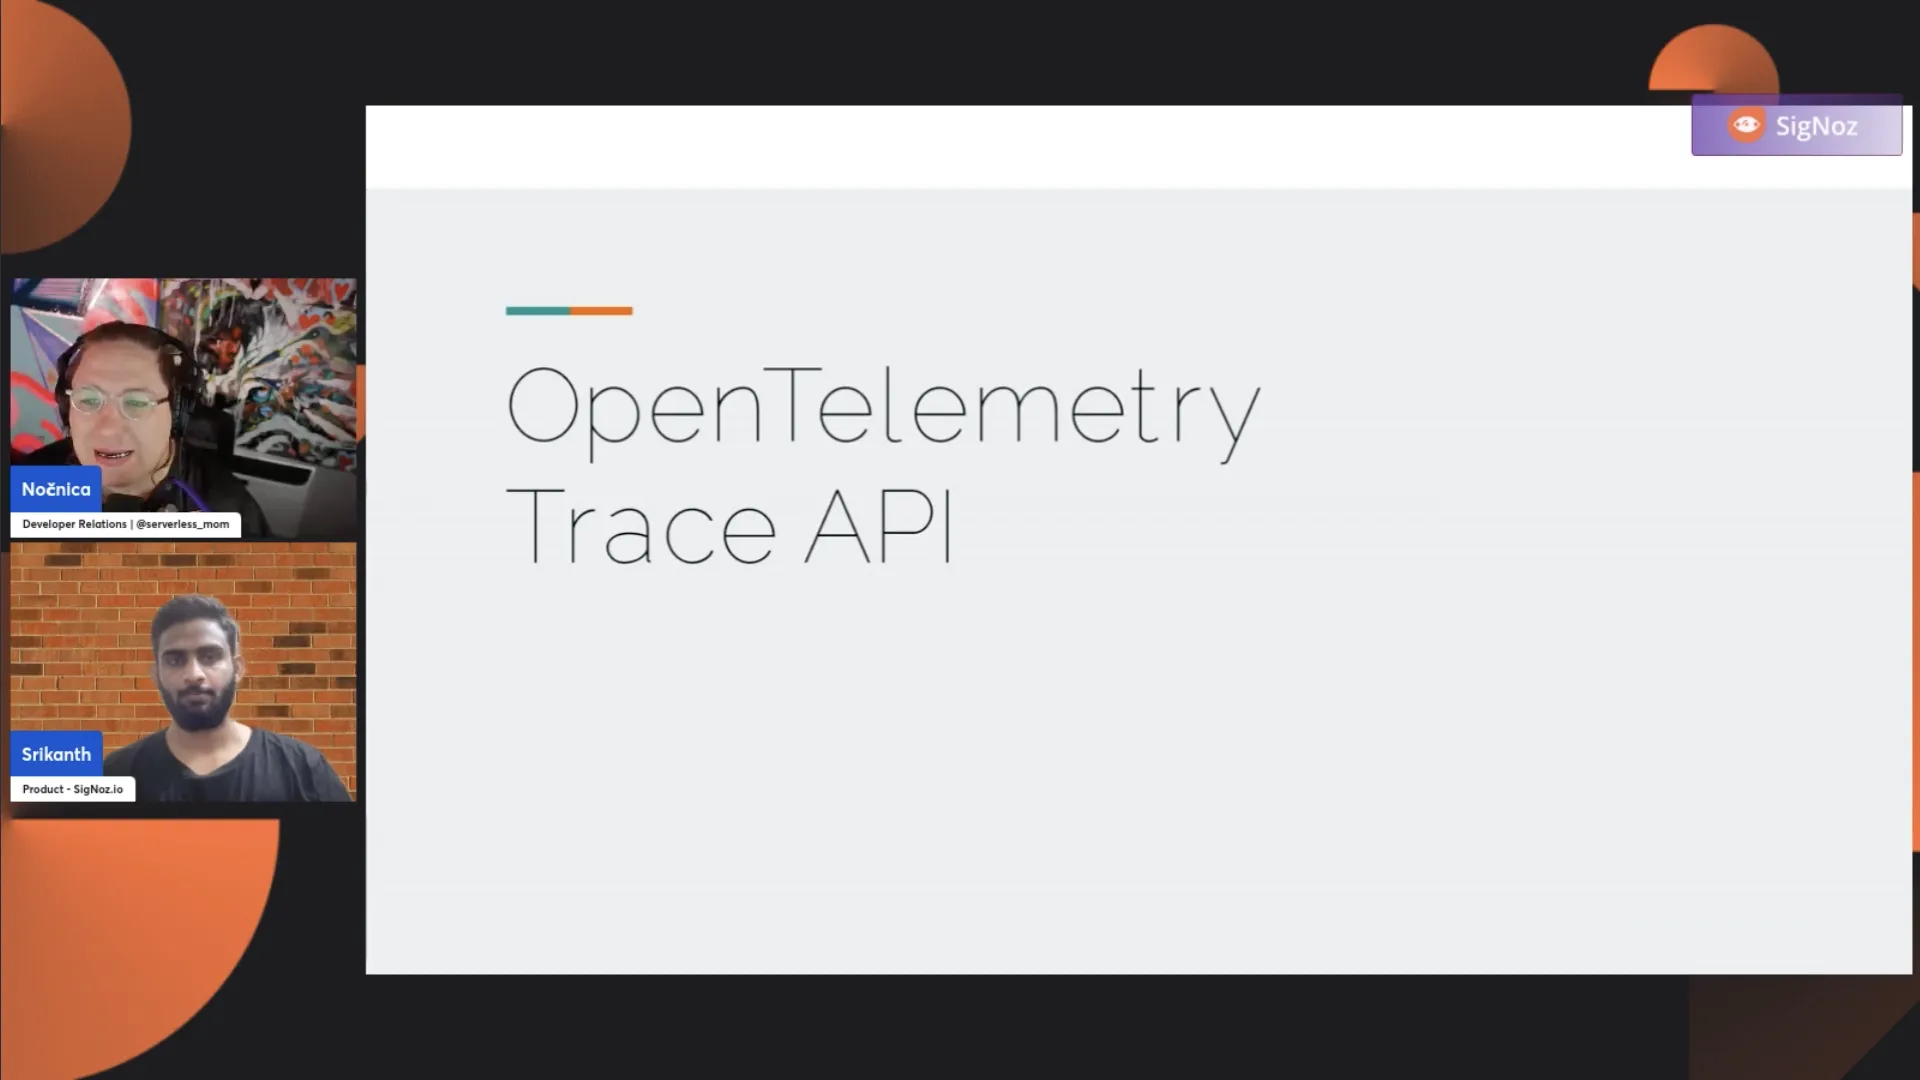
Okay. I want to give a brief idea about when you want to start manual instrumentation. Having some understanding of the concepts helps you work with manual instrumentation well, especially when it comes to the tracing API of OpenTelemetry. These are the main parts: a tracer provider, a context, a tracer, and a span.
We'll go through them to give a brief idea about what each one does. The tracer provider gives you access to the tracer, and the tracer gives you access to the span. It's a hierarchy where you have a provider that gives you tracers, and then the tracer object enables you to create spans.
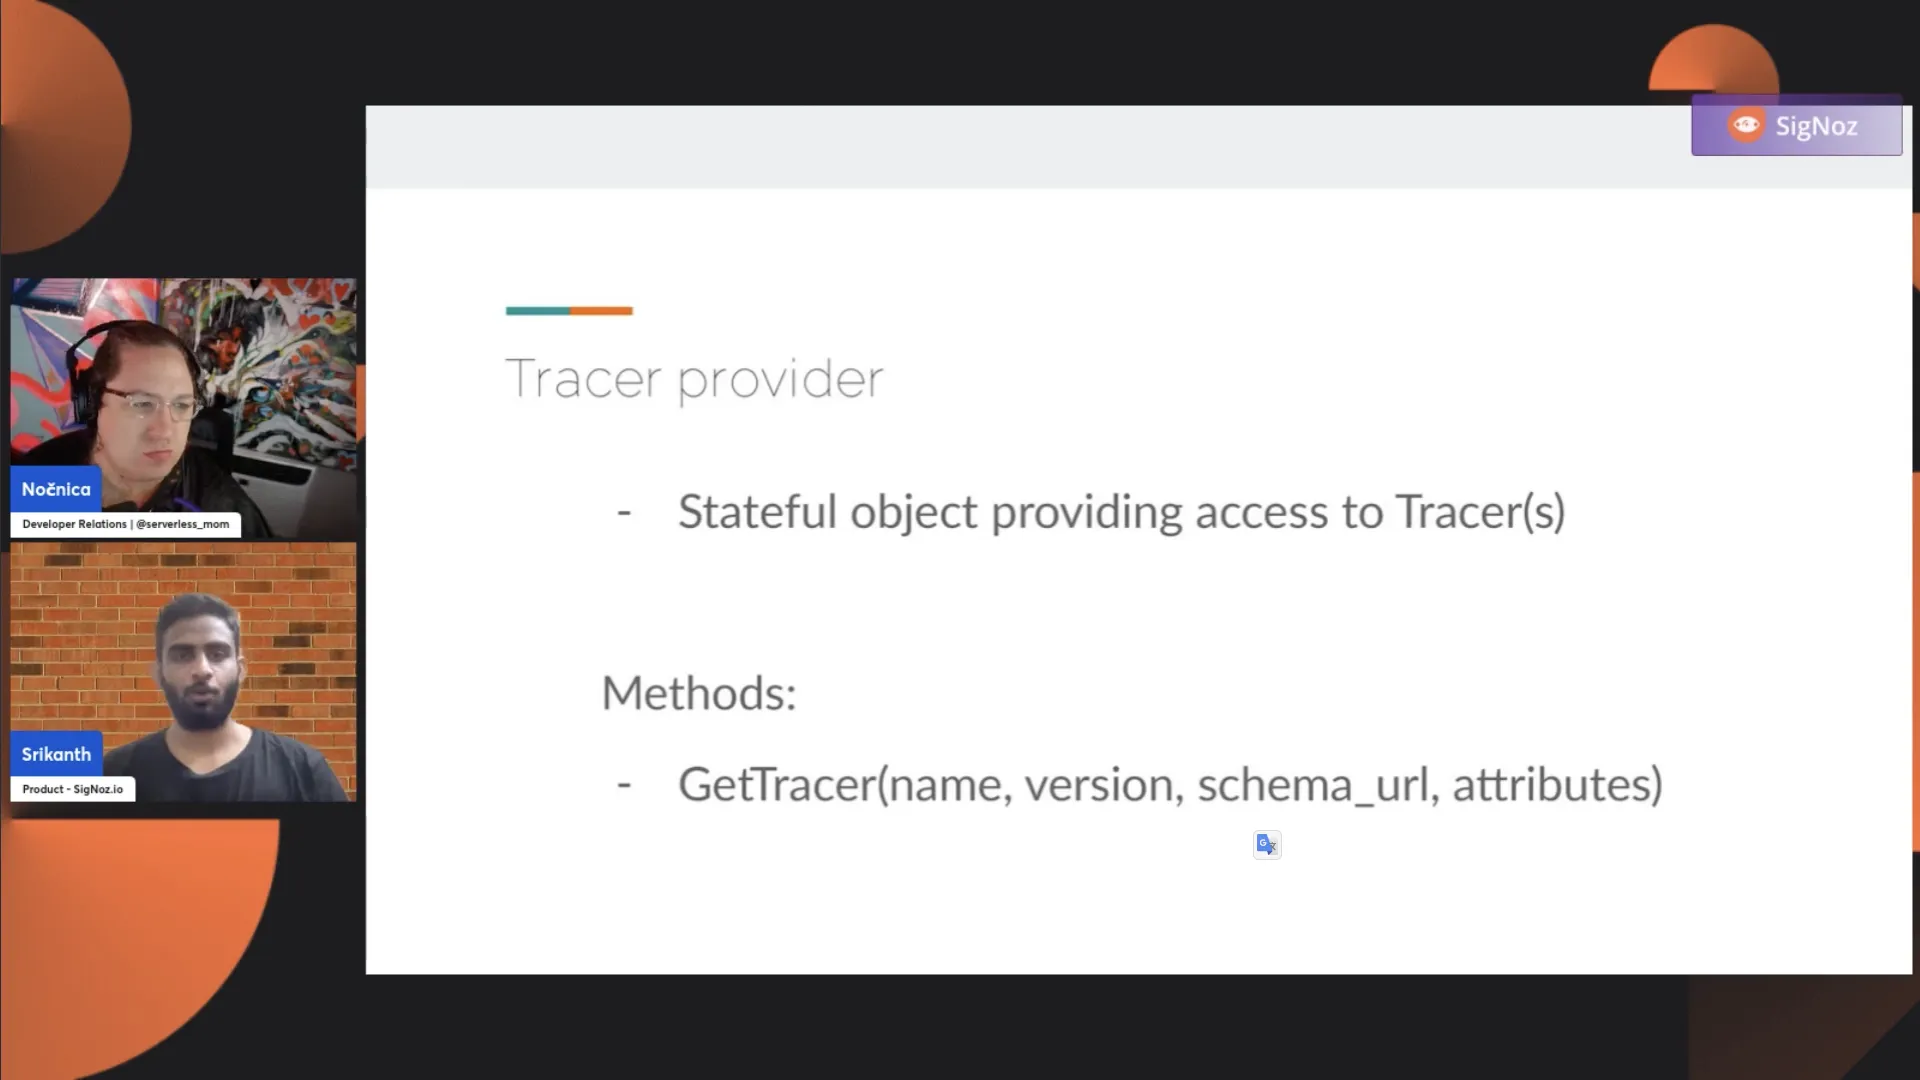
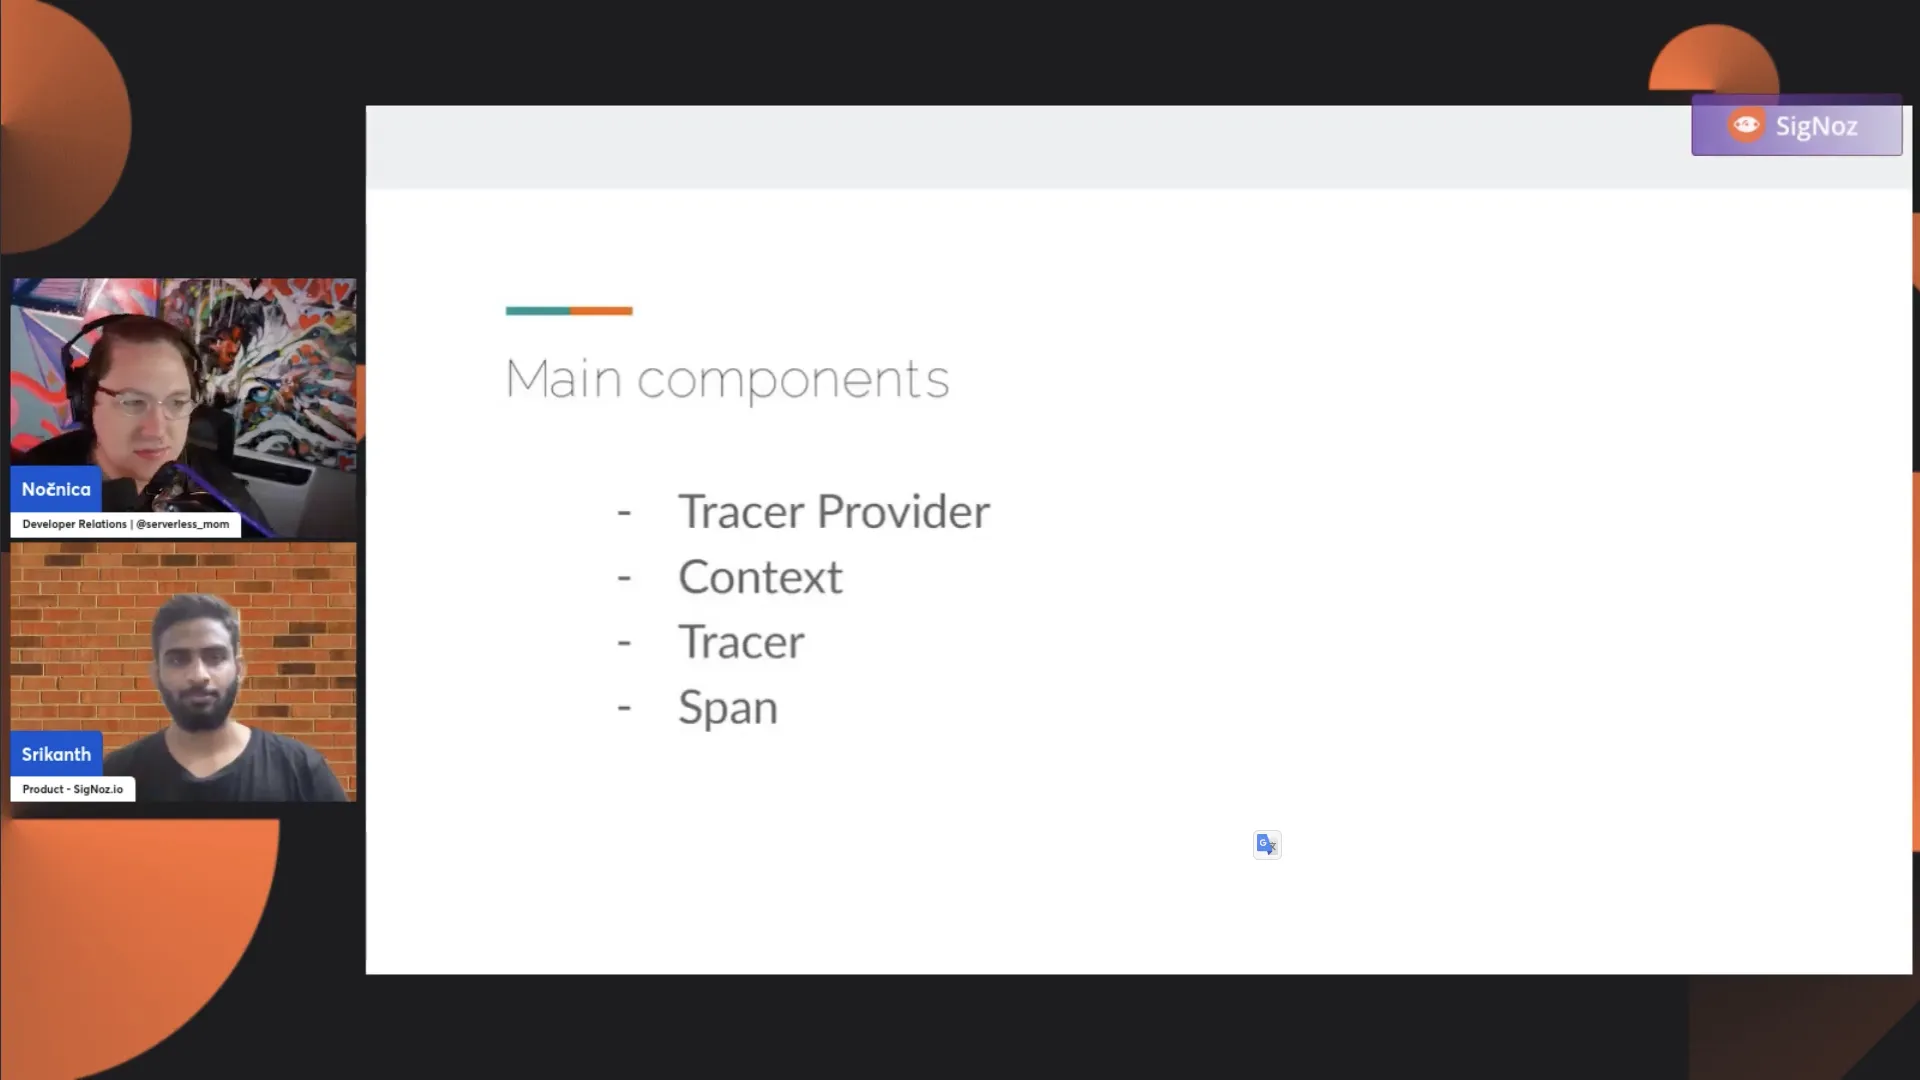
Let's talk about the tracer provider. The tracer provider, as I mentioned, is the object that helps you get tracers. You might wonder why there's a need for a provider. Why not just start the span? Why have this hierarchy structure where you obtain the tracer object first and then try to create it later?
This is even a further granular level of telemetry information. Let's say you have numerous modules within your system, and you want to scope each tracer. Each tracer that you create has a name associated with it a version and a schema URL set of attributes. This tracer object allows you to have one global tracer object or a scoped tracer object.
For instance, if you have code in one module following old semantic conventions and another following new semantic conventions, you may want to create two different tracer objects. The schema URL represents a semantic convention.
For example, if you provide the schema URL as 1.14.0, any data sent to the backend will have this information associated with it. This helps distinguish the data within the scope tracer with a semantic convention of 1.14.0. But in practice, unless you have these requirements, you would generally use the one global tracer object.
Nica: This might be like having a single service but feeling like there are two separate services, says an internal and external version of some account detail service. We don't want those traces mixed; they don't make sense together.
This gets us to the basic question of how much work you should be doing to make sure that your code displays observability correctly within your codebase. If it makes sense for your organization and your data as it travels through your system, then that's something you should worry about during custom instrumentation or setting up instrumentation.
If it's like, "Oh, this doesn't make sense, and I want to add explanatory details," maybe there should be a better way to do that than editing your codebase. But it makes sense to set up your observability at first. A perfect example of having scoped tracers to define what we consider an actual single service here, even though it's part of a larger system getting tracers along with something else.
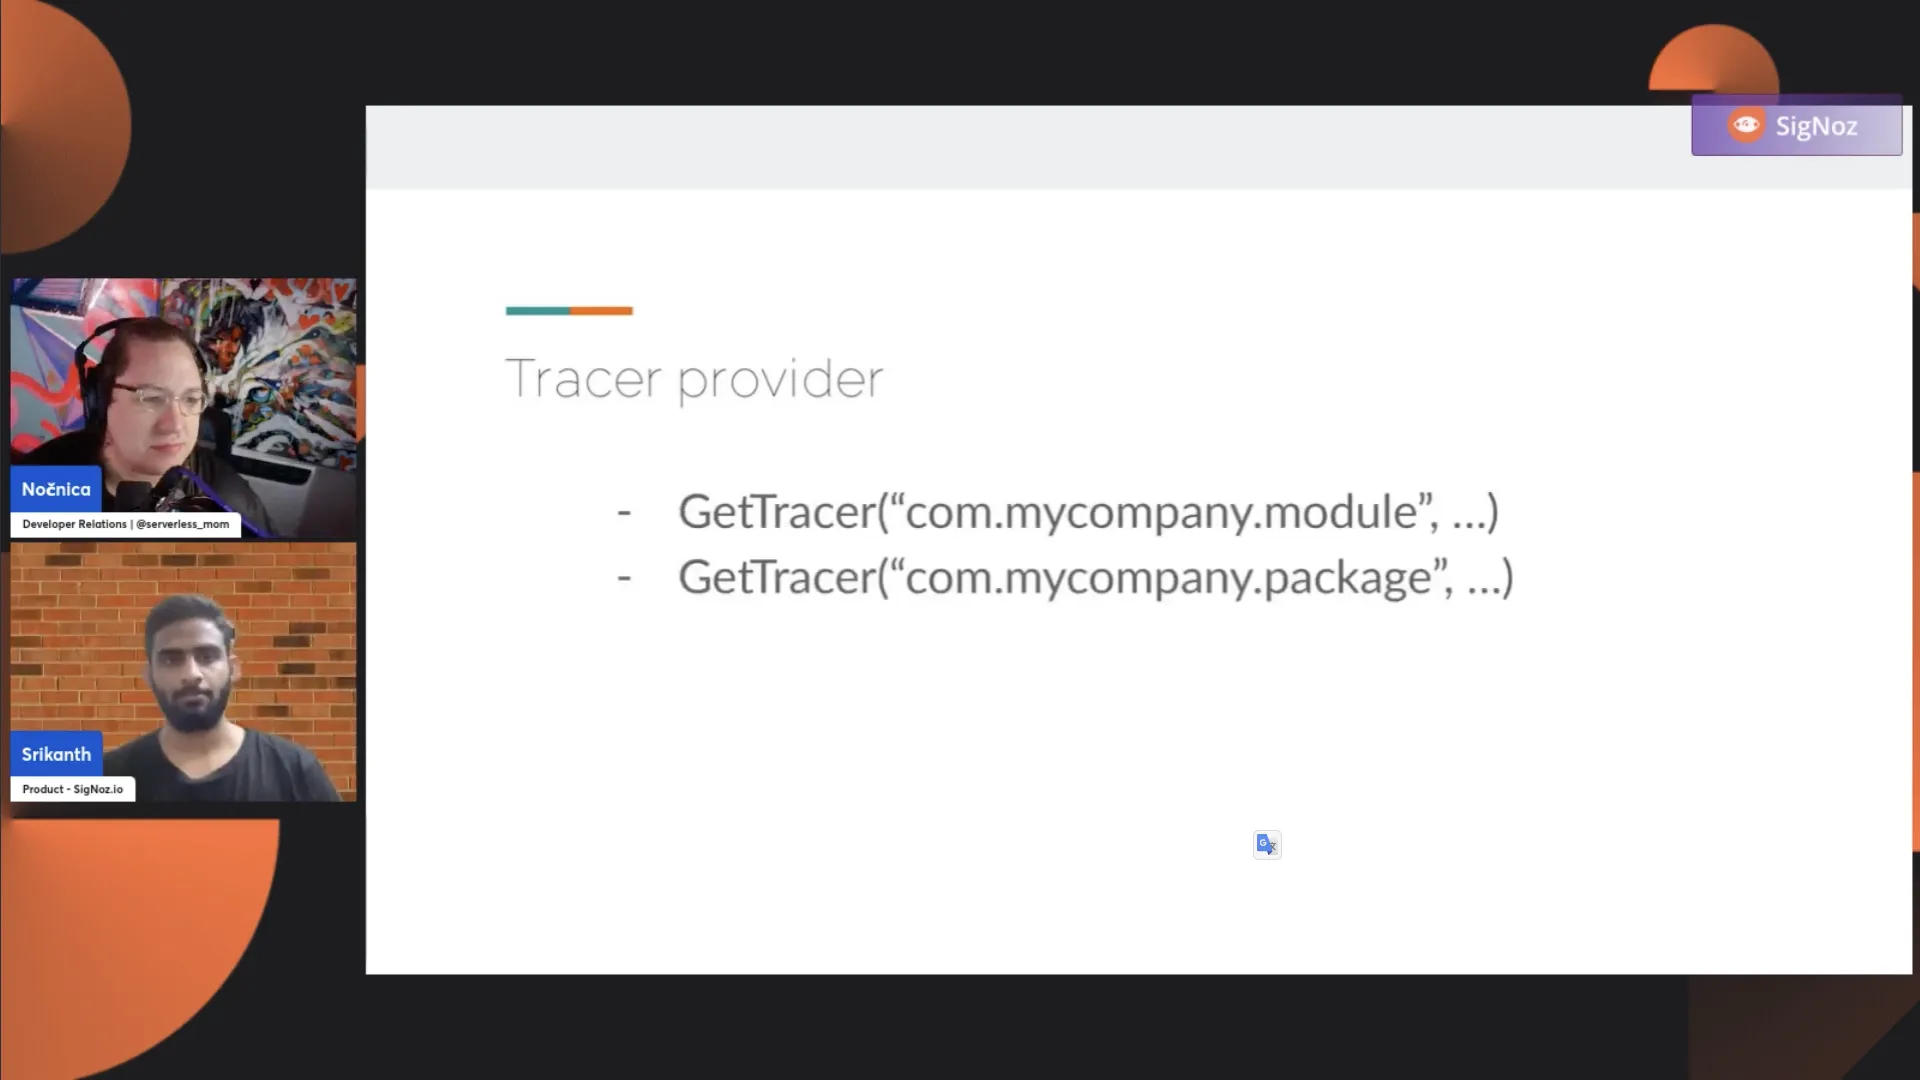
In general, you may not need this many scoped tracers in practice, but it is possible to have different traces for different purposes. For example, within a certain package, you might want to attribute spans to a specific scope, like com.mycompany.package.
If you want even further granularity, you could use com.mycompany.module. It's up to you whether, from a business or code perspective, you want to use scope separation between the tracer and the associated spans. You can certainly use it if it makes sense, but if not, you can have one global tracer used everywhere within your application.
Next, I want to talk about the context. This is important for you to know because tracing is based on spans connected by parent-child relationships. This relationship is preserved based on context, known as context propagation.
There are two types: in-process and out-of-process context propagation. Let's focus on in-process context propagation, which needs to be managed manually. Out-of-process context propagation is automatically taken care of by the client libraries.
In in-process context propagation, when you start a span in function foo() and another in the function bar(), you want to establish a parent-child relationship.
In languages like Go, explicit context propagation is required. In languages like Python, JavaScript, and Java, implicit context propagation happens via thread locals, and you don't need to interact with the context directly.
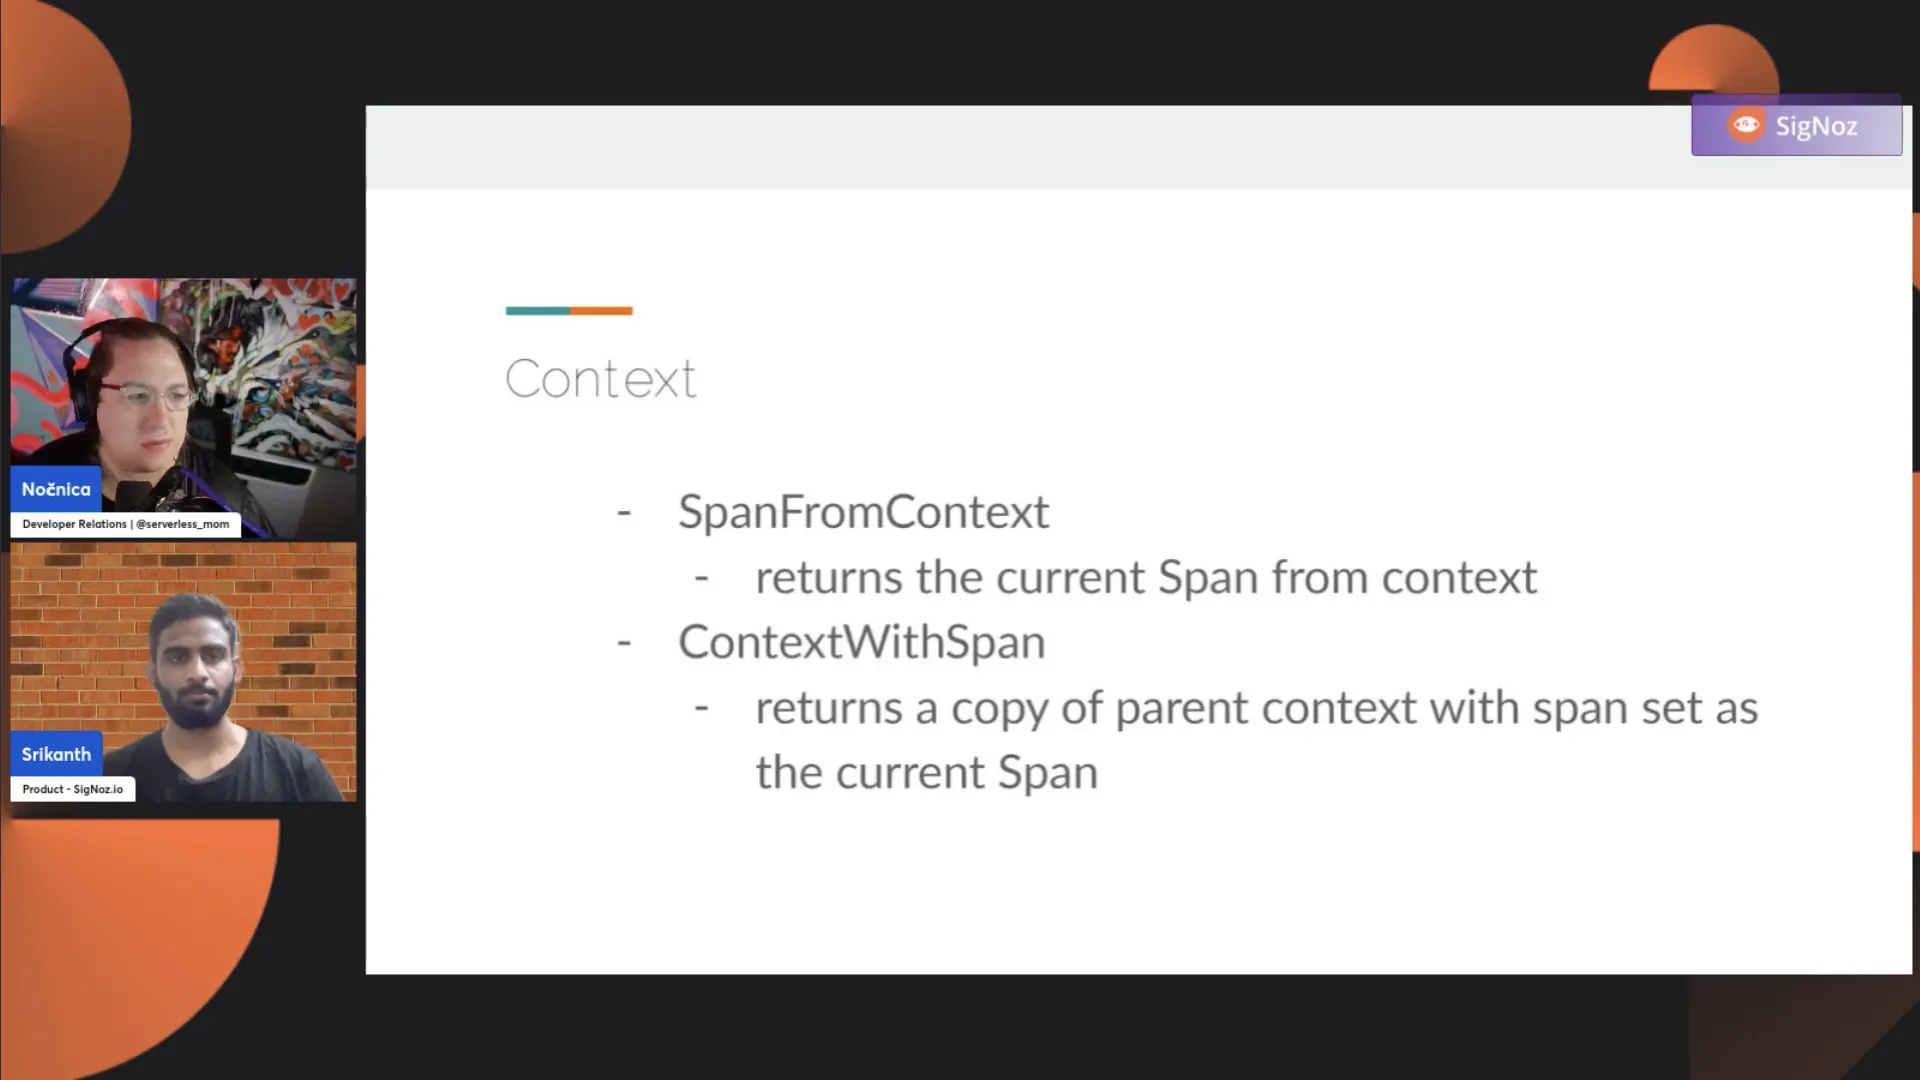
In Go, you need to interact with the context. There are two functions to be aware of: SpanFromContext and ContextWithSpan. The span from context gives you the span within a given context object. If the span doesn't exist, it returns nil. You use this object to add attributes, events, etc. Context with span is used to create a new context object with a span for in-process context propagation.
If you have three functions, for example, and you want to start a span in functions one and three but not in two, you need to propagate the parent from function one to function three. This is done by creating a new context object with the span and passing it down the function calls.
Nika: If you get back just a span from the span from context, can you add a child to that span object?
Srikanth: Yes. When you start a new span with the received context object, it automatically adds it as a child, so you don't need to do it manually.
If you want to add a child, just start a new span with the given context. If you want to add certain attributes or perform certain operations on the existing span object, you will use SpanFromContext; otherwise, you just start a span with the given context object.
Nica: So, yeah, the reason you'd be loading the span would be to ask some questions like, "Hey, what span am I currently in? Let me find that value."
Srikanth: Yes, so whatever is part of the context object, there can be one span as part of the context, if you send it down to some function, if you start a new span with the context, the parent-child relationship is automatically formed.
If you don't use that context, that's where, if you come across broken traces, you need to start looking into it. You need to use the context that has been given to you; otherwise, what should be a single trace is now a broken trace in your application. So, you get a context with the span and pass it down to the functions where you want to have a parent-child relationship and use the given context object so that the trace is continued without any broken spans.
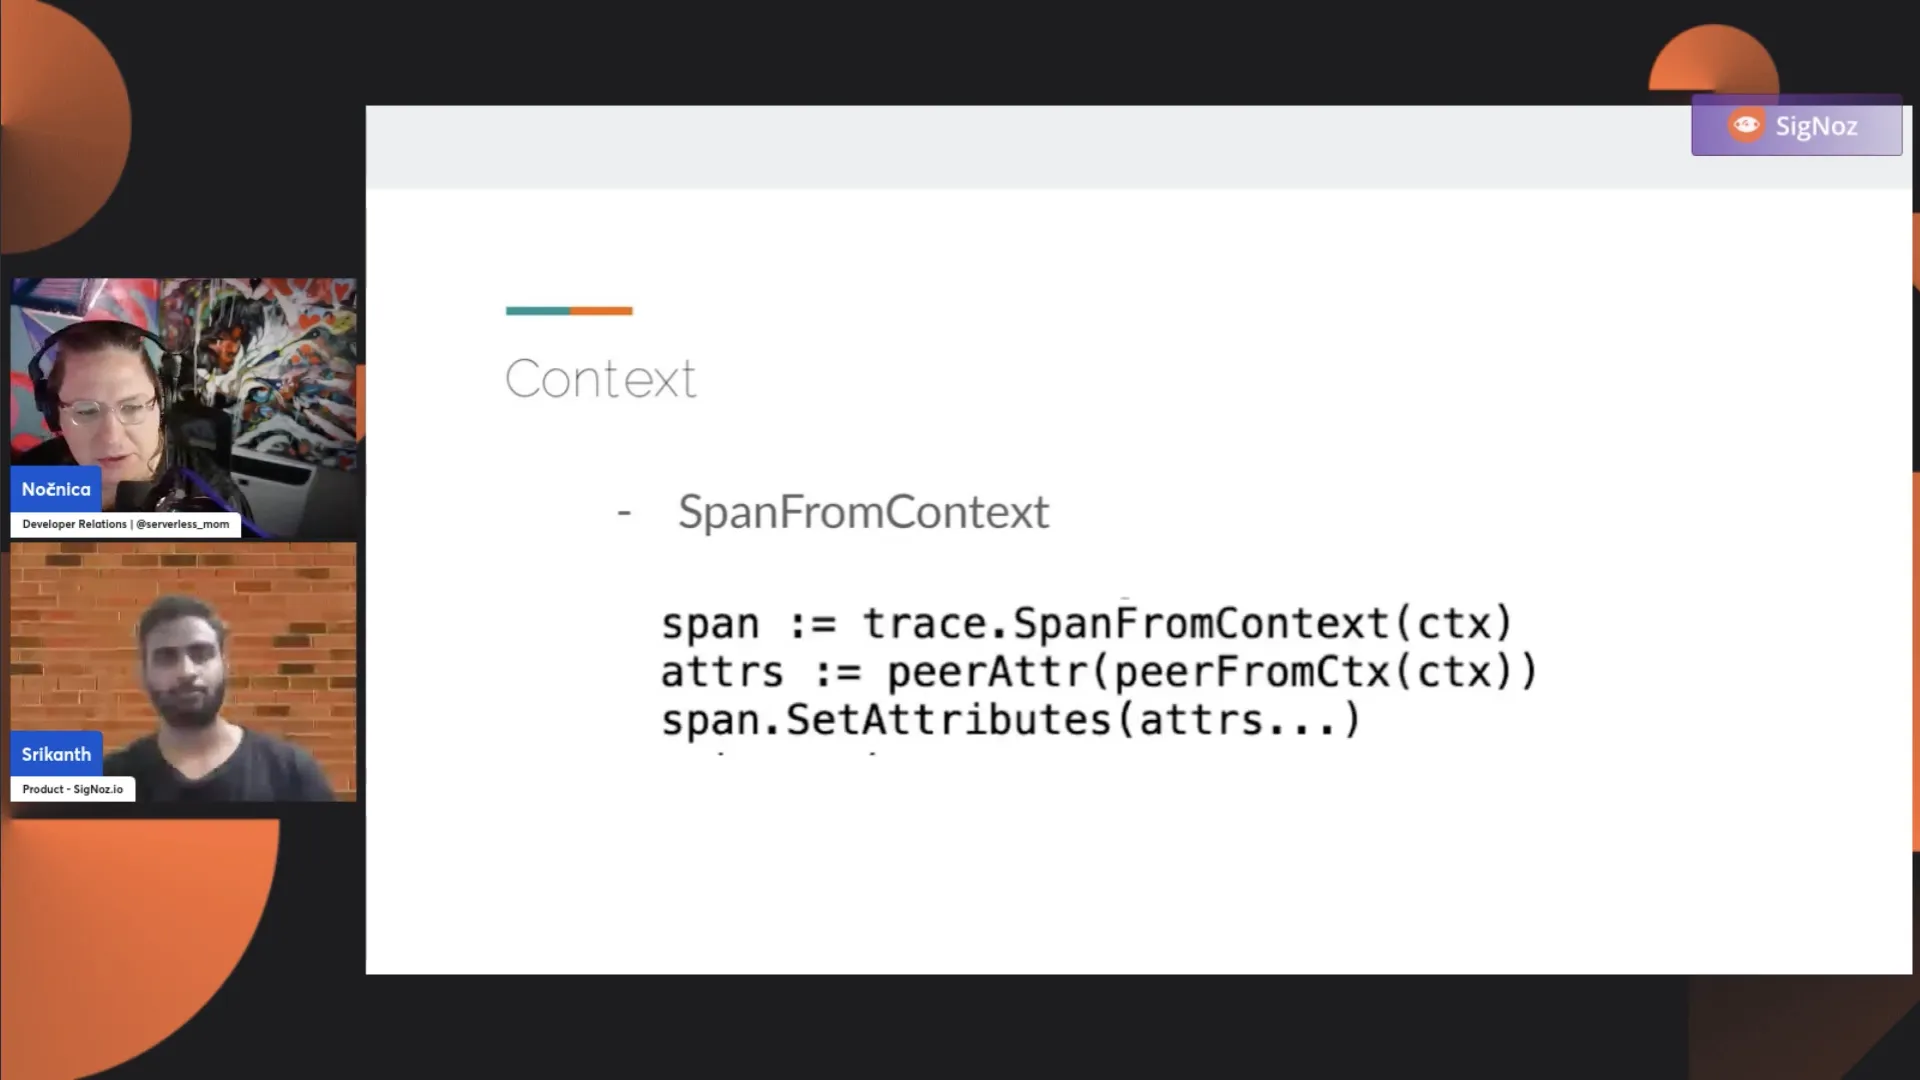
Yeah, this [IMAGE] is another example where you don't want to create a new span but rather want to pass it down and add certain more attributes or add certain more metadata and then end the span in that function. So, the context you received here would have the parent context, and what you do is trace that span from context. It extracts the span object out of the context given to this function, and then you can set attributes and end the span here or continue passing down the context object to another set of functions.
Yeah. So, that was about the context, having proper context propagation to avoid broken traces. If you have broken traces or need to connect spans that aren't connected, the go-to place is to look at the context and ensure that it's propagated properly. In many languages, you don't need to worry about it, but in languages without implicit context propagation, you should take care of that detail. Next up, we have the Tracer.
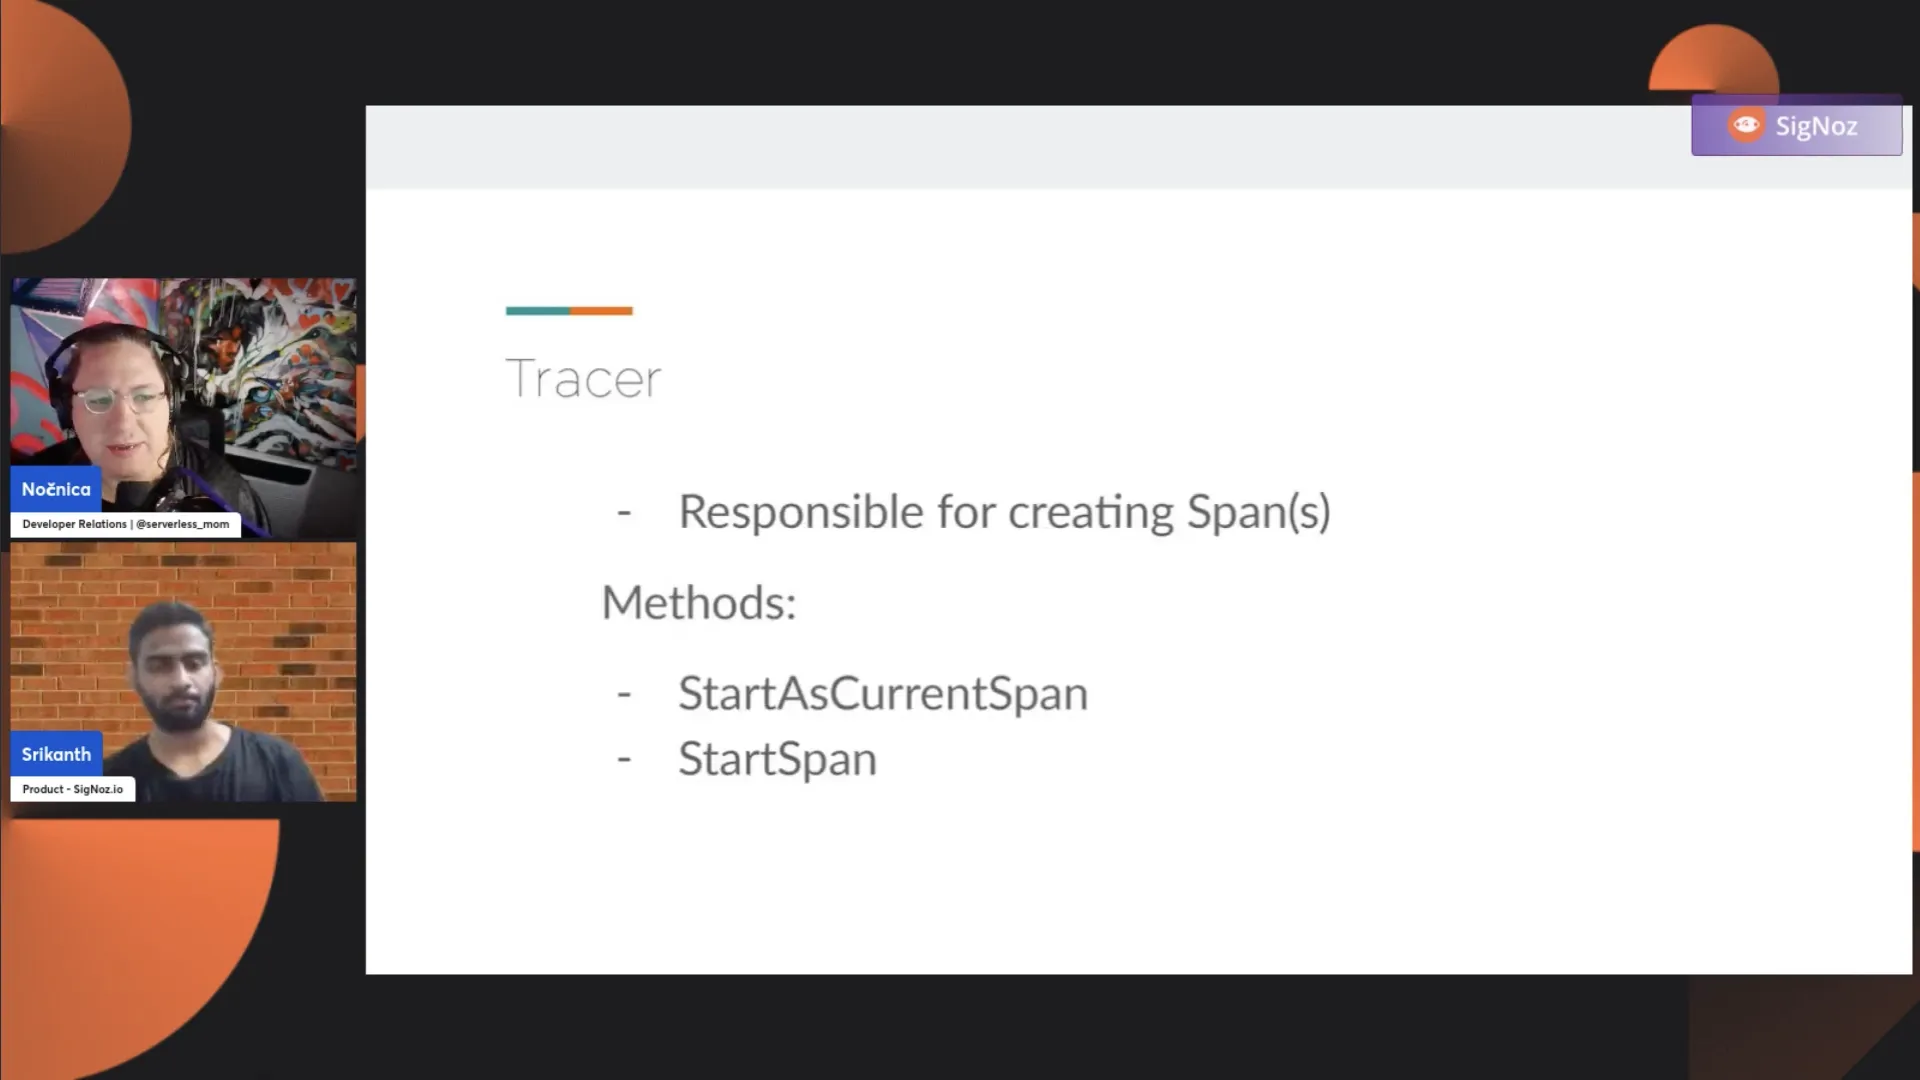
We've seen that there's a provider that gives you access to the Tracer, and the Tracer is the object responsible for creating spans. You cannot instantiate a span directly in OpenTelemetry; it has to happen via the Tracer object.
The Tracer object has two primary operations: StartAsCurrentSpan and StartSpan. StartAsCurrentSpan starts the span and sets it in the context. It's a convenient method to avoid manually setting the span inside the context. The StartSpan operation creates a span and gives you an instance.
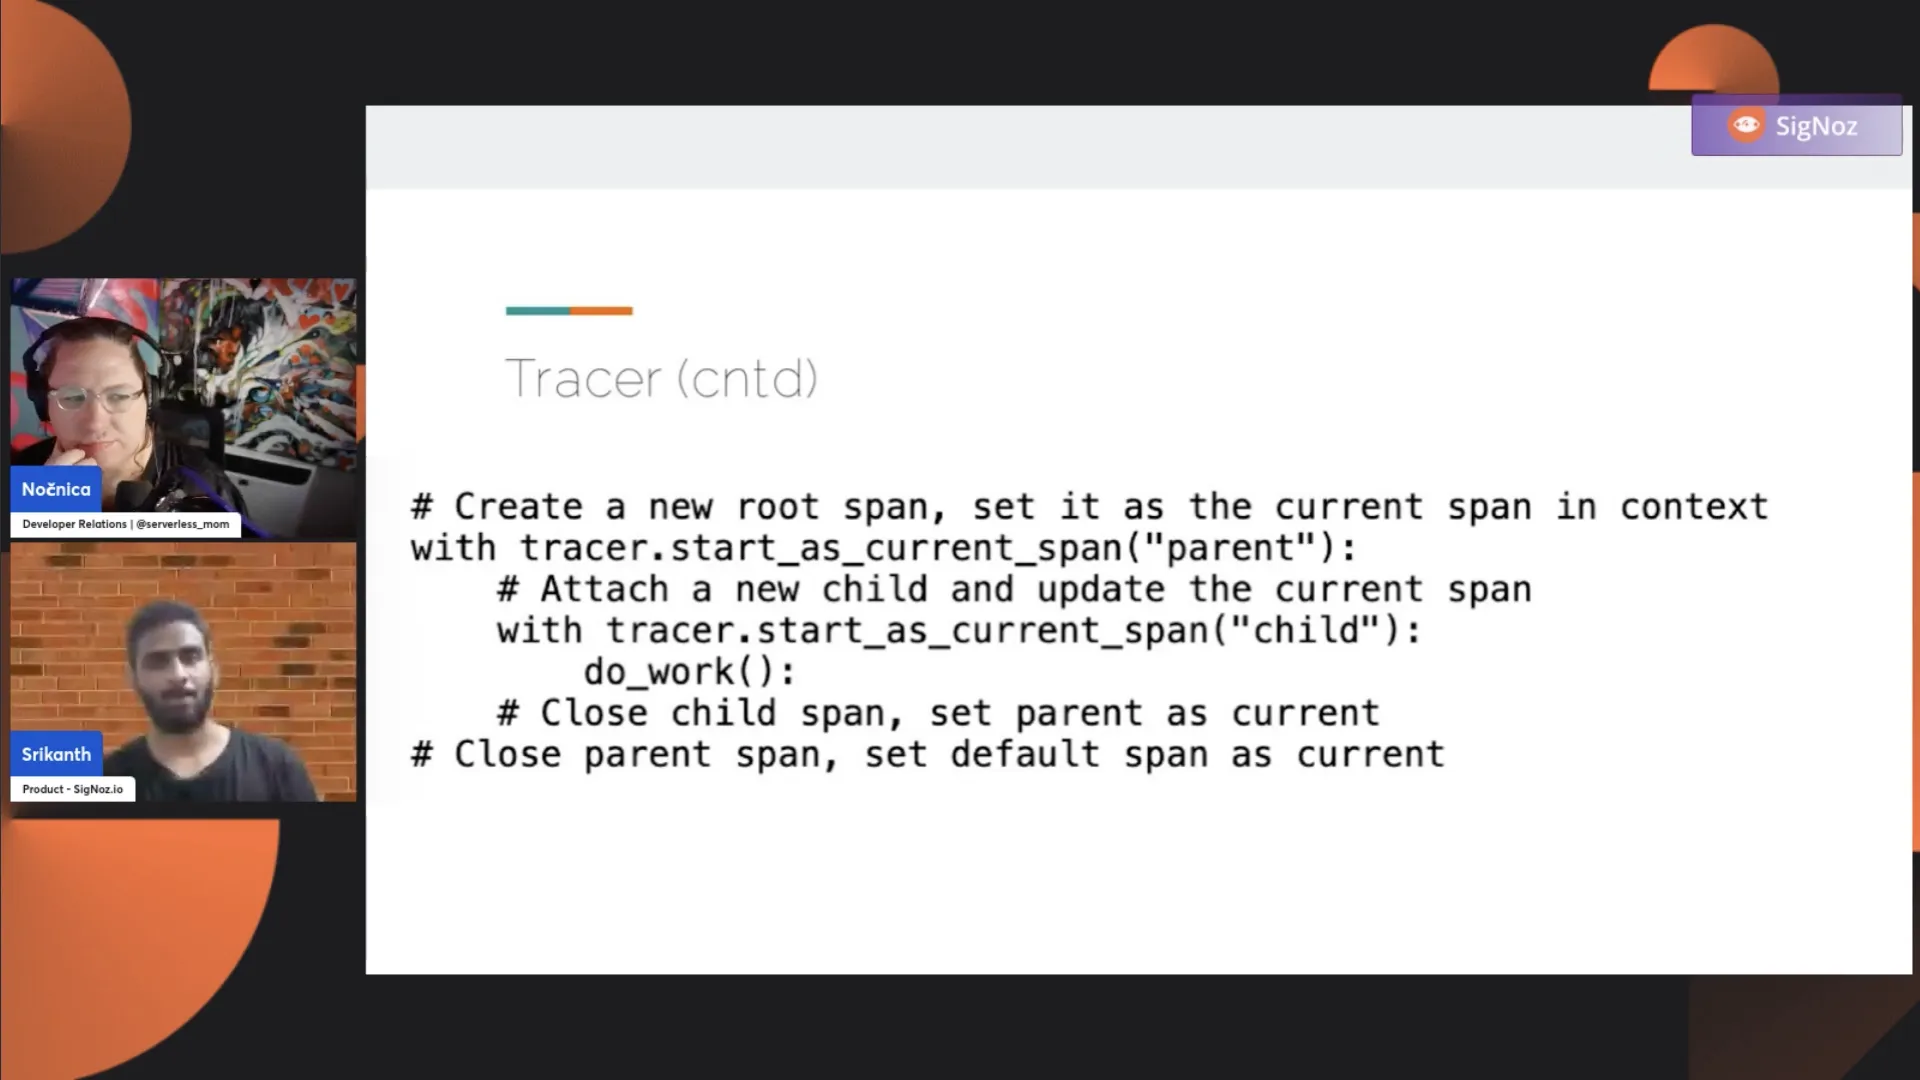
In the slides, I used multiple languages just to give the audience a brief idea. I put together some examples. If you look at the example here on the first span, you have tracer.start_as_current_span. So, by using start as the current span, you don't need to manually work with the context. You don't need to worry about whether there will be a parent-child relationship preserved or not. The convenience wrapper does the work for you, creates the span, and sets it into the context. Anytime the child span starts, there's a parent-child relationship preserved.
Nica: In Hazel Weekly's talk four weeks ago, I was just seeing and name-checking it. I'll share a link to the video once it's shared, but I didn't think you could create these parent-child relationships or connect spans after the fact like you can't do it with a collector setting in OpenTelemetry.
If you're seeing orphan spans or broken traces, you need to go fix it within your code instrumentation. It's not currently practical to try and fix it afterward.
Srikanth: You cannot do that at the collector level because the collector does not know how to have this parent-child relationship. It doesn't know how to connect these spans. Any broken relationship has to be fixed in the application where you have instrumented.
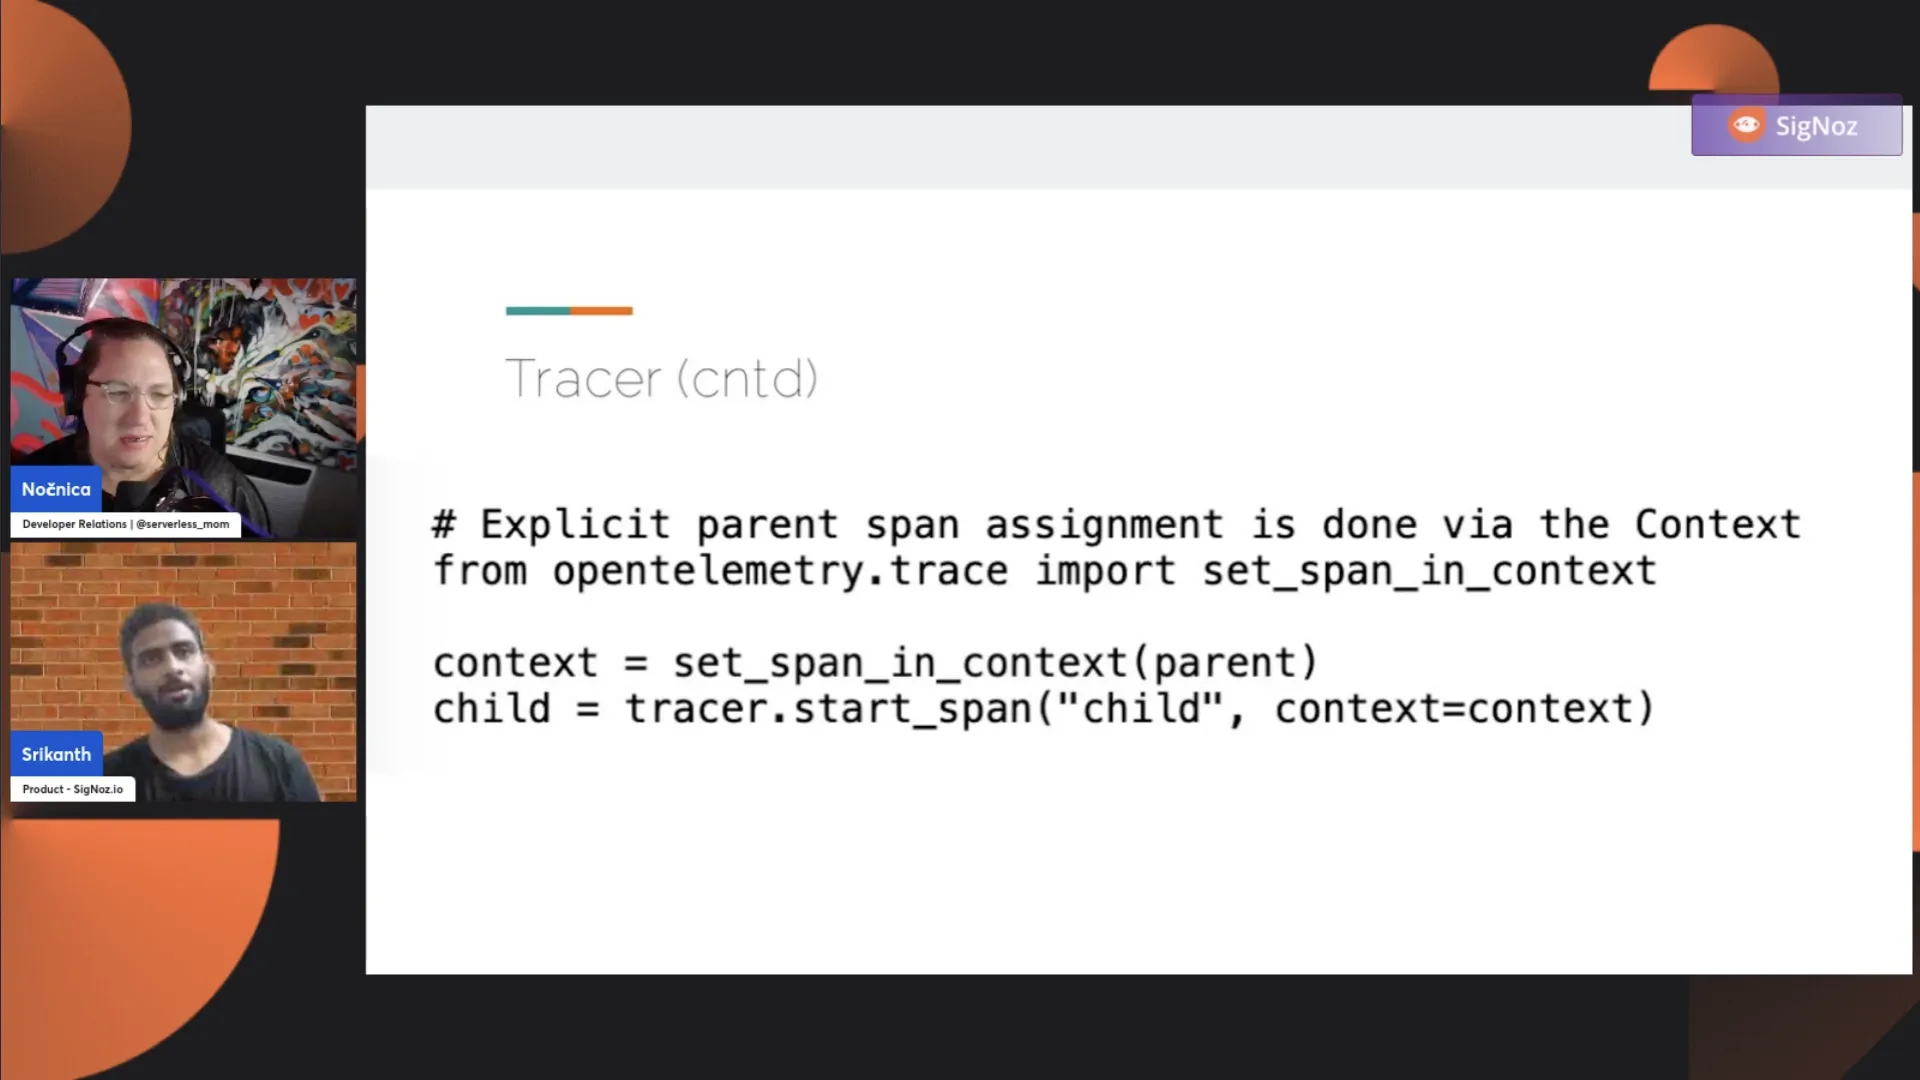
This is another example where we are not using StartAsCurrentSpan; we are just using StartSpan. If you use a StartSpan, it is your responsibility to make sure that the context is managed properly.
So, let's say you get the parent and set it as the span in the context. You have to pass the context object to the child span.
If you remember, we did not have this line of context = set_span_in_context in the previous code. That is because that convenience span does the work for you. But if there are certain use cases, certain cases where you don't want to start a span as a current span, this is how you would have to do that.
It could be because when you do the start as a current span, the timer, the start time, everything is automatically set at the point in time. But let's say if you do StartSpan, you have the option to, so you have the ability to pass the start timestamp.
So, when did this span start? You are not starting this as a current timestamp. It gives you the ability to say what is the timestamp when this span has started. So that's an advantage. There can be certain use cases where you don't want to immediately start a span but start a span with a certain, sometime later or some custom start time, which is not the current timestamp. So in those use cases where you do this, we make sure to have context in idea otherwise you would get a broken, I see.
Nica: Yeah, that's interesting. I didn't actually realize that that was possible. I've seen that, like, it's an asynchronous process. There's a network between you and the database, but we don't really care about that. And so it's like, "Oh, I wish I could start it when the database actually starts to handle it," you know? So it's like not the current time.
Srikanth: I've seen certain users had certain use cases where, like, with some use cases where they had to pass, and then they use this pretty extensively because they get the data from somewhere. Like, they don't immediately have this tracing information, but they want to have the traces. So what they do is they get this start time somewhere from the database or some other means.
So they get this, "When should I start this operation?" So they get that start time from somewhere and use that information to start spans. And still, in the end, when you go to your tracing back where you were looking at the data, you do not know whether it actually was, you know, how it was started, whether it was customized or not.
Nica: So, you get a DB return that had like, "Hey, this was the time I received this request, and here's the response, and I want to add that span but on the handler for the return, right? So, it's like, no, don't start it now because I'm just done now, right? Like, don't always make it the span length like a millisecond. Let's show what the actual return time was." So, yeah, that's pretty cool. I didn't realize that was an option.
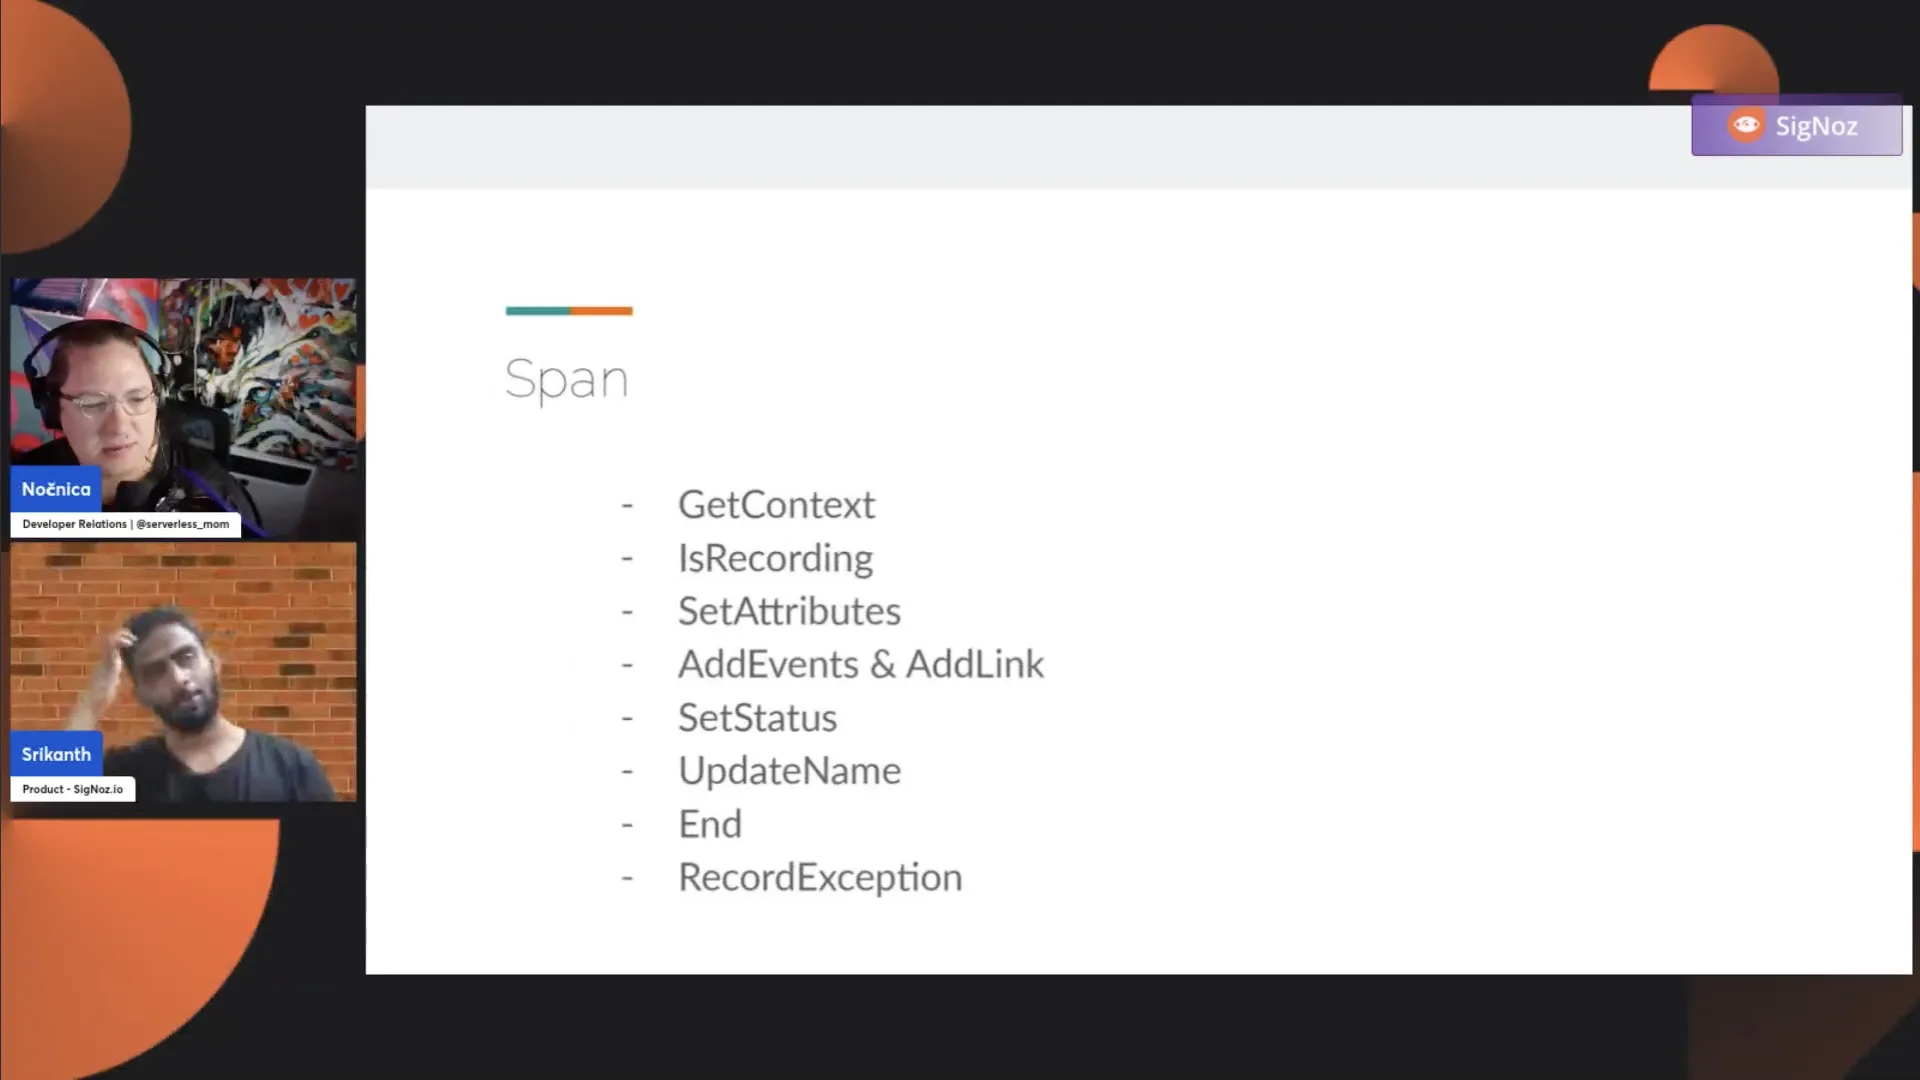
Srikanth: Now we have seen the Tracer object. I'm just repeating myself. There's a provider that gives you access to the Tracer, and then there's a Tracer object that helps you to start spans. The entire work of manual instrumentation will be revolving around the span. Anything that you do will be on the span object, and there are several operations you can perform on the span object. I've listed them, and we'll go through them one by one.
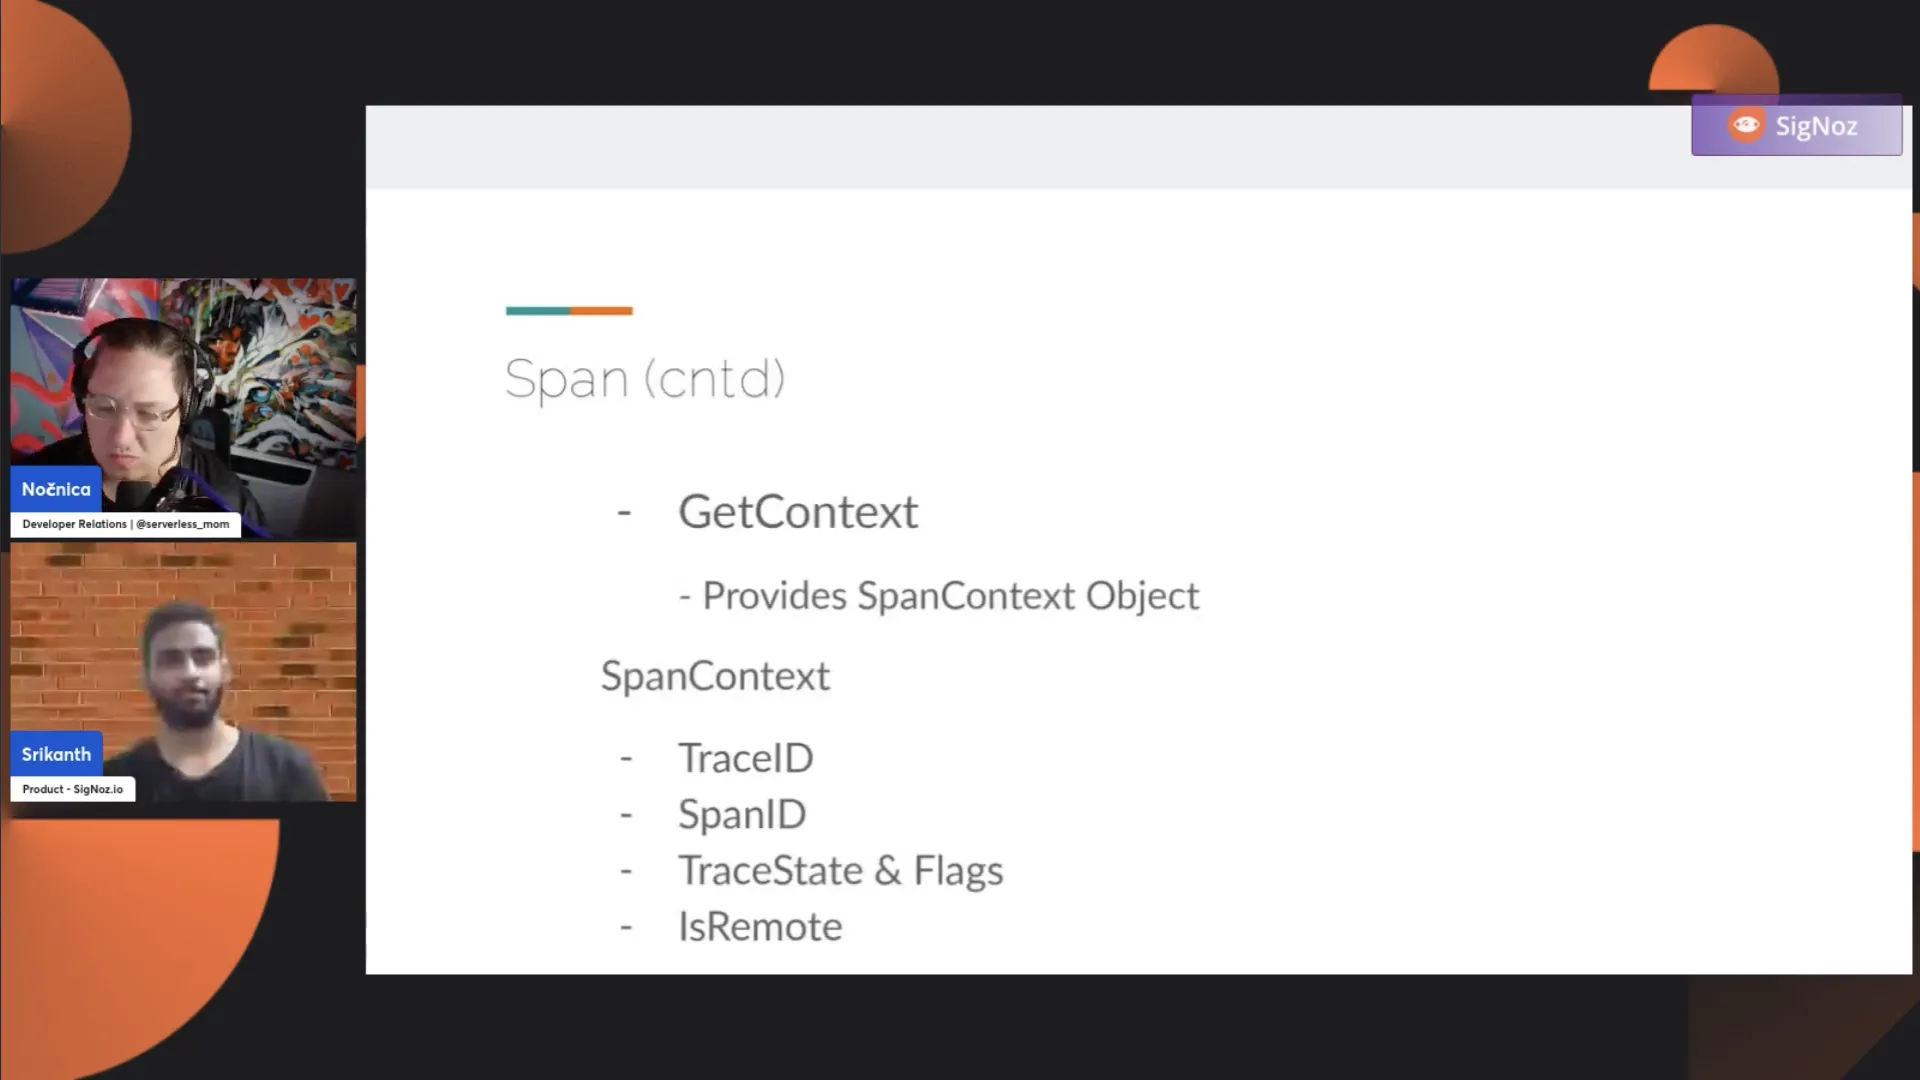
Now, we have the GetContext. So, what does it give you? A span has a context associated with it. What does that SpanContext contain? It contains a TraceID, it contains a SpanID, it contains a TraceState and Flag, and it contains a IsRemote. Every span you create has this information. Is this span IsRemote or is this not?
When a span is a remote span, it means the span, you just have it. So let's say you have two services, and you have a service B, which is not creating a trace on its own, but it is just propagating the context, like propagating the trace. Like, it is not continuing the trace that has originated in service A. So, in service B, how do you know that it should not start a new span but it should just continue the span?
What happens is, under the hood, service B creates a dummy span that has the IsRemote set to true. That indicates, "Okay, someone has already started a trace journey. I will create a dummy span with IsRemote set to true, and it also has the parent TraceID and SpanID, and it sets that span in the context and starts the span so that the trace journey continues."
This GetContext helps you get the TraceID, SpanID, and IsRemote information. For some business use cases, where you want to take this TraceID, SpanID, let's say, you started a span, and you want to give this SpanID to some external system or attach this SpanID to one of your business intelligence reports, you would use this GetContext. You call GetContext on the span object, and you get the span context. This span context has the TraceID, SpanID, TraceState, and metadata.
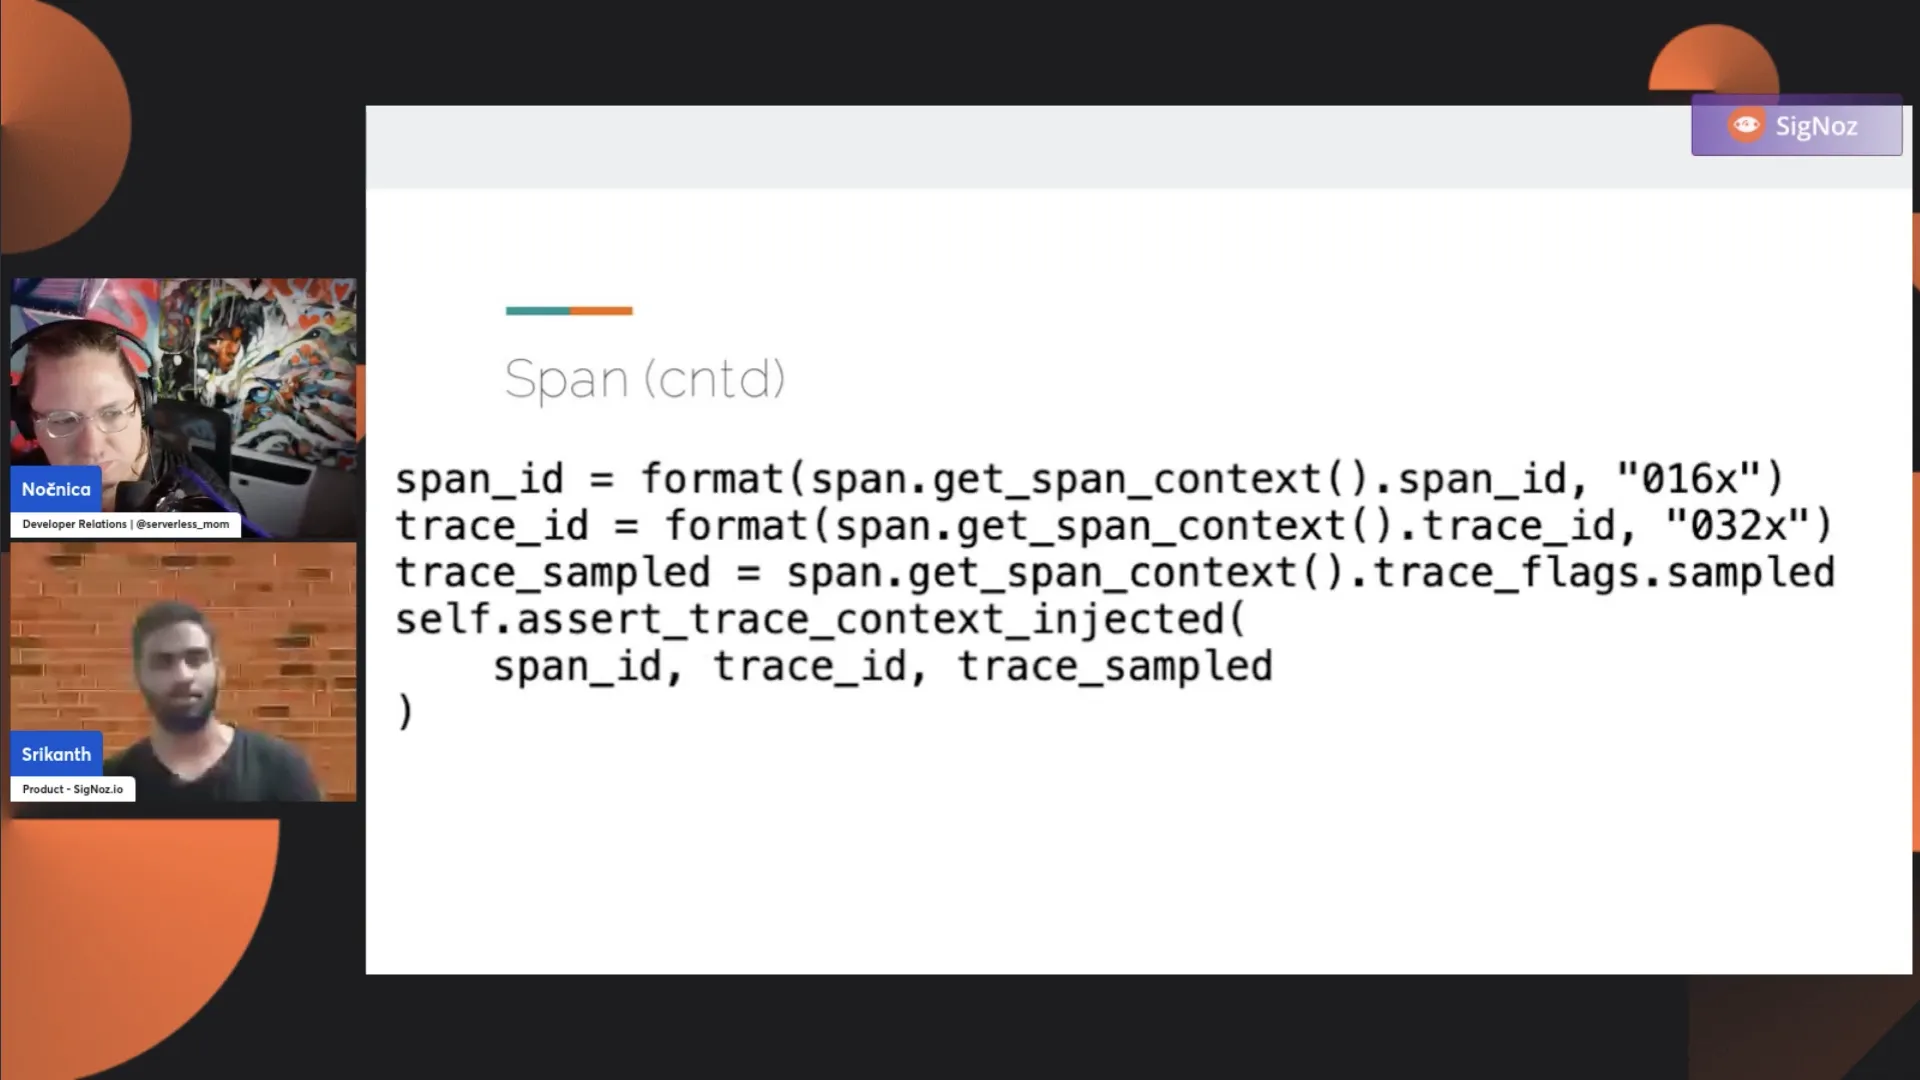
Here, in the example, the first line is span.get_span_context(), which gives you the span context object. We have a span_id that gets the SpanID from the context. One common use case is when you want to include trace contextual information, such as TraceID, and SpanID, as part of your logs. You use GetContext to access the SpanID and TraceID, and you can include them in your logs. This helps correlate between the traces generated and the logs sent to the log backend.
Nica: I hadn't realized that you could set your start time on a span, but the reason I always knew to get your current span was to connect and get out your TraceID and SpanID. So, when I'm logging this, I'll be able to connect it to this trace easily.
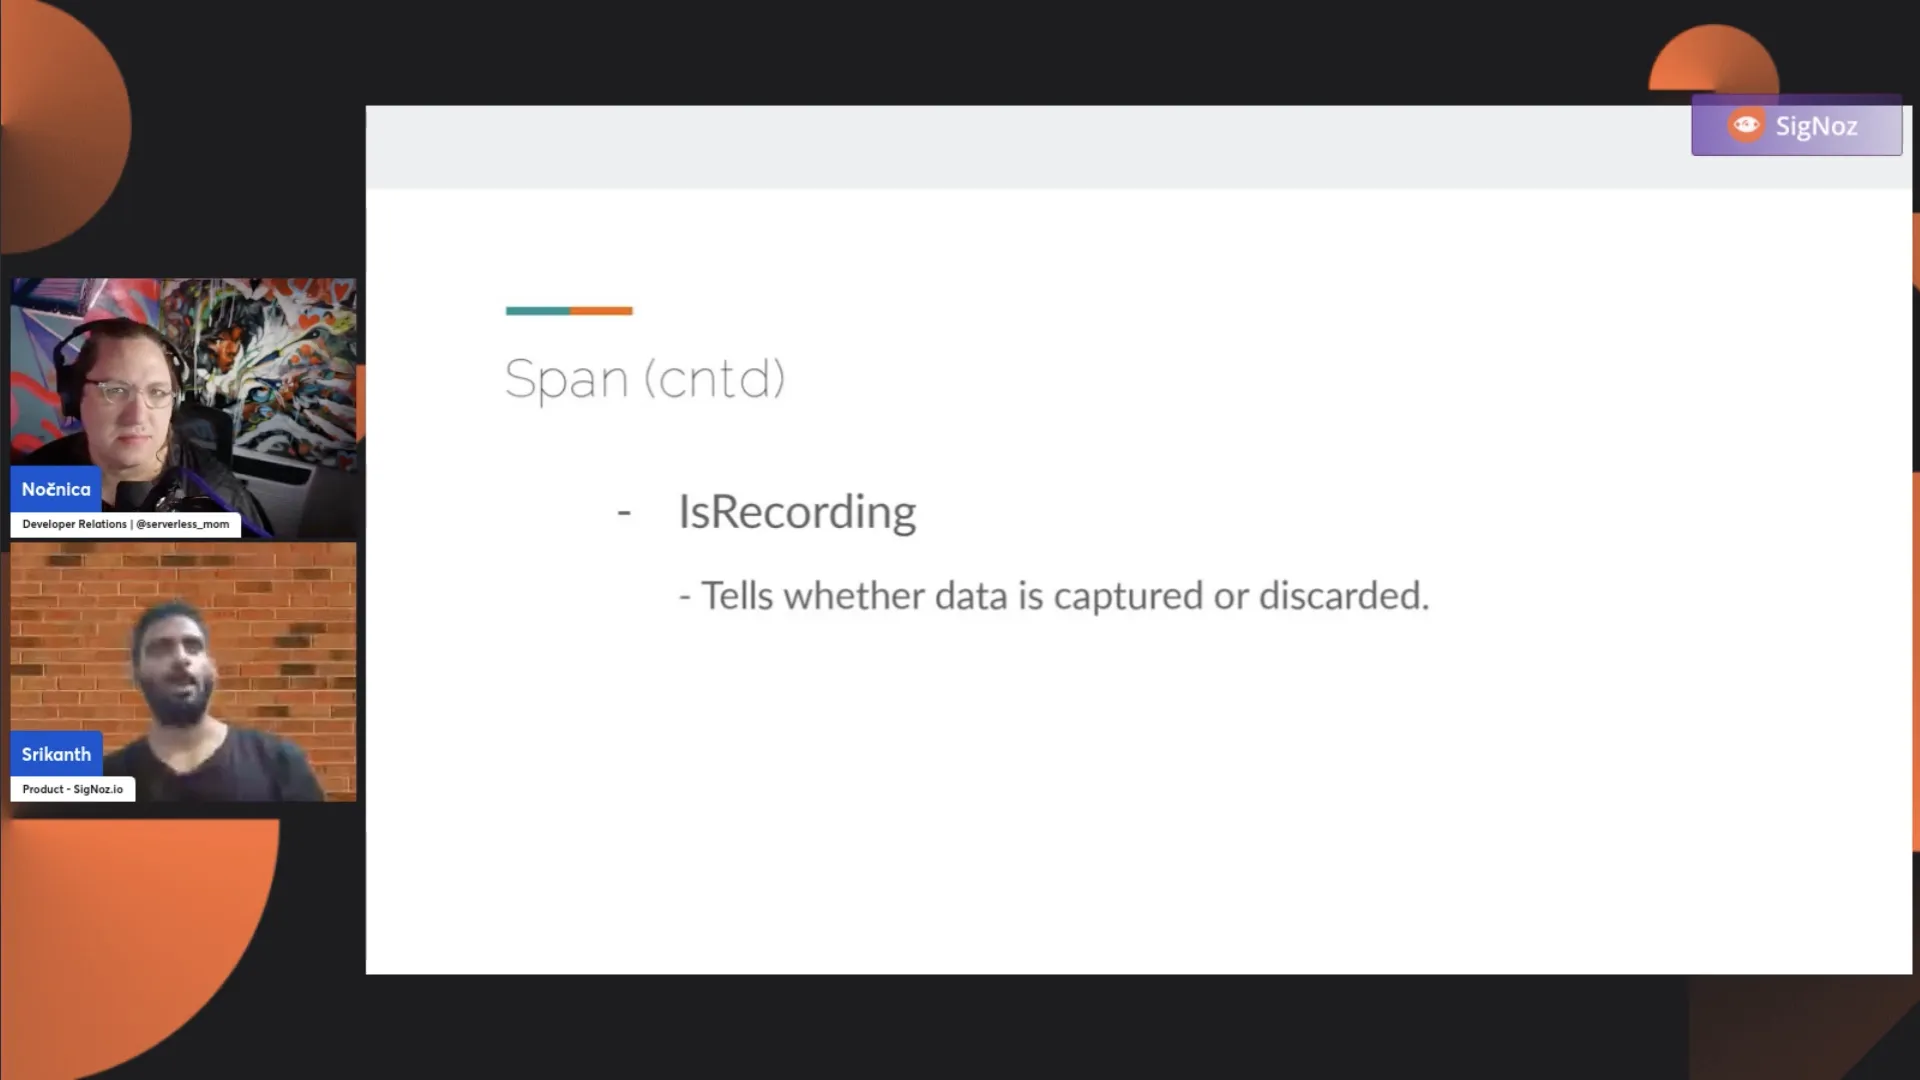
Srikanth: Now, we have another, which is very unknown. There's something called IsRecording. It tells you whether the span is recording the data or not. If IsRecording is set to false, any operation on the span object will be ignored.
Let's say you do SetAttributes, and add event on the span; it is only captured as long as it is recording. This IsRecording is decided by something called the sampler at the SDK level. It's important to note that you can have use cases where you are recording but not sampling. You are recording and processing it, but you don't want the whole span to go into the destination system. In those cases, IsRecording becomes very handy.
Nica: Could this also be for something where maybe you're using the baggage for some other purpose within your engineering, like for testing or something? So, you'd be passing this trace around, but you're not going to record it.
Srikanth: It's not related to baggage. With baggage, you're passing around metadata. But IsRecording is entirely related to sampling, where you don't want to sample but still want to record.
Nica: So, if you're using baggage for something interesting like the trace test guys, they could just be passing the context without passing around a trace. Okay, I got it. Next.
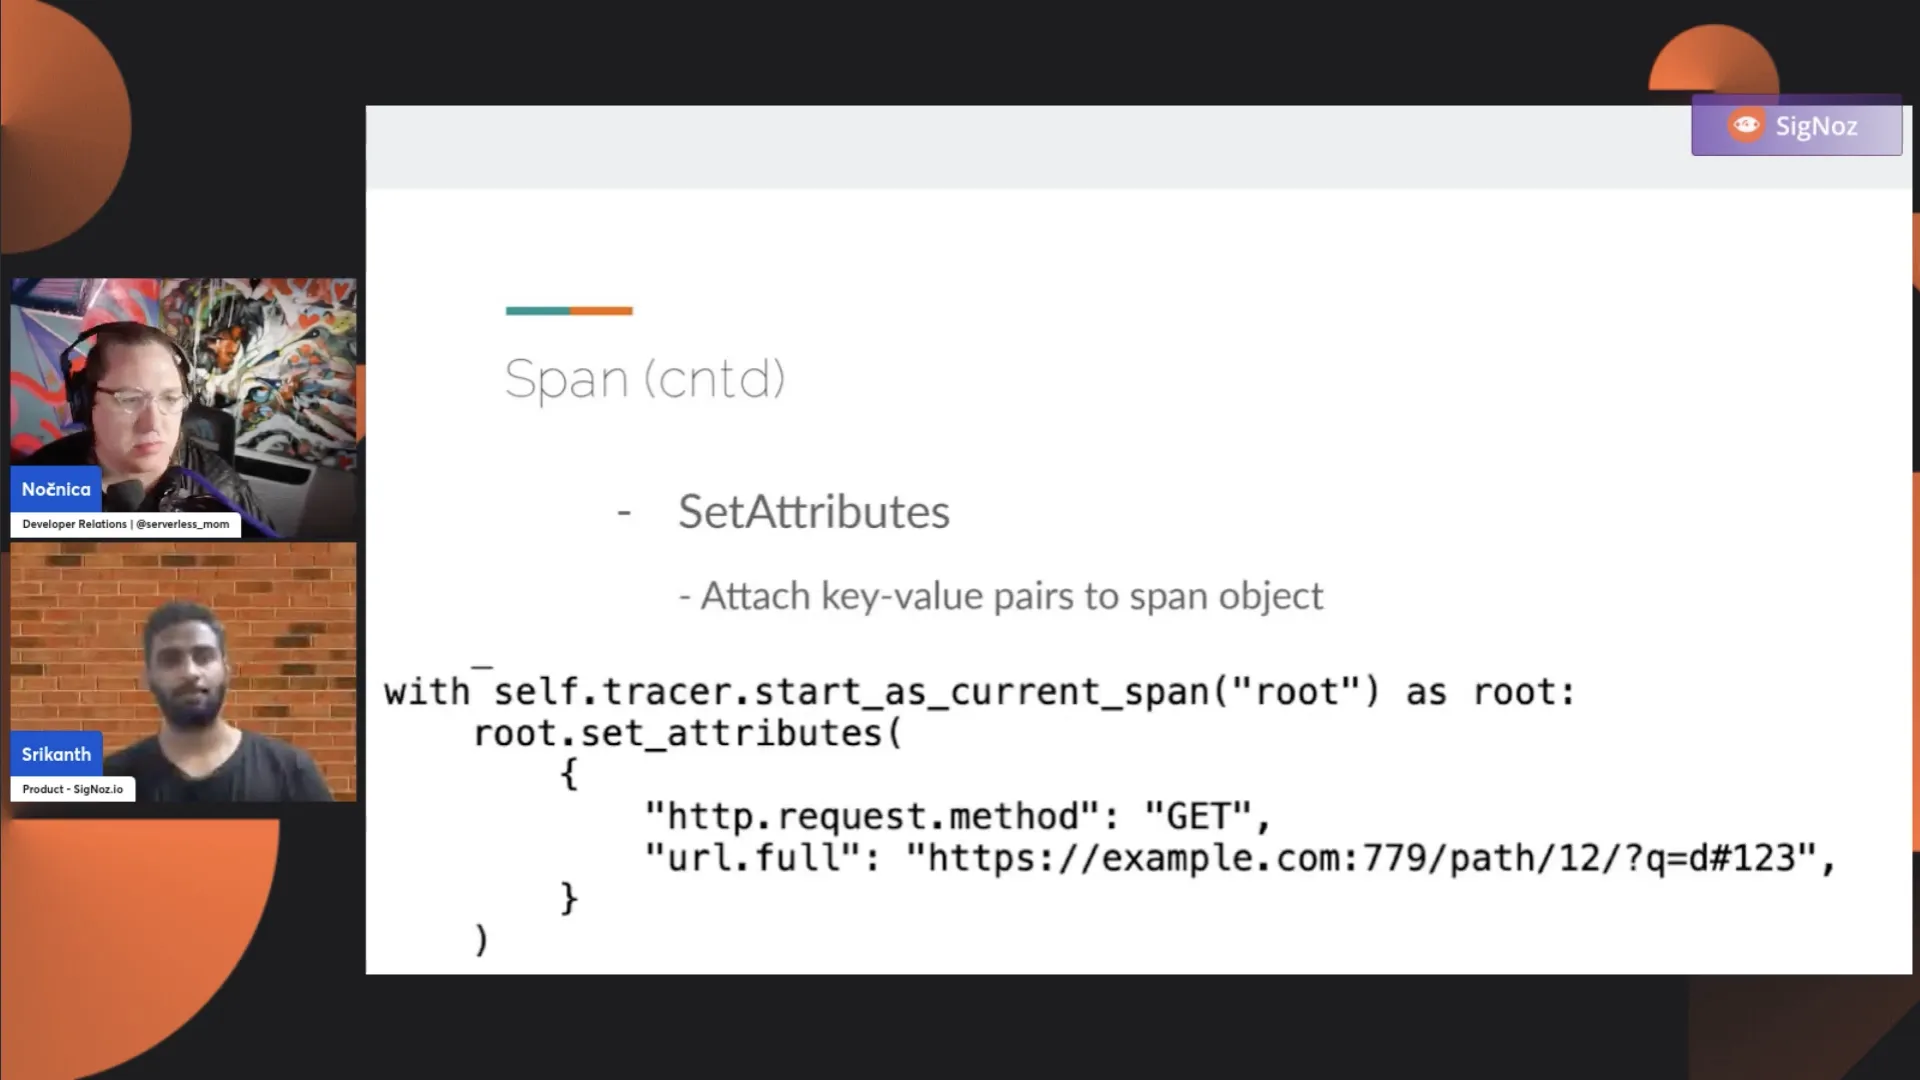
Srikanth: Now, we have SetAttributes. This will be the most common operation you will do on a span when you are doing manual instrumentation. Anytime you create a span, the real value comes when you attach some rich contextual information to it. Just starting a span alone doesn't give you any meaningful information. It's only useful when you have some contextual information on it, like when, local, or whatever contextual information that is associated with when it started.
The SetAttributes operation is what you would call the function or operation on the span object that helps you attach contextual information. For example, you could attach a customer ID or any other contextual information that will help you debug issues later. This is where it's really important. There can be certain requests that are specific to certain customers, and not having that customer ID will not be able to help you.
When you start a span, make sure that you add the necessary information that will help you debug issues later. Otherwise, just creating a span and not having essential attributes set means it's not useful. It's only as useful as the data that you attach to it.
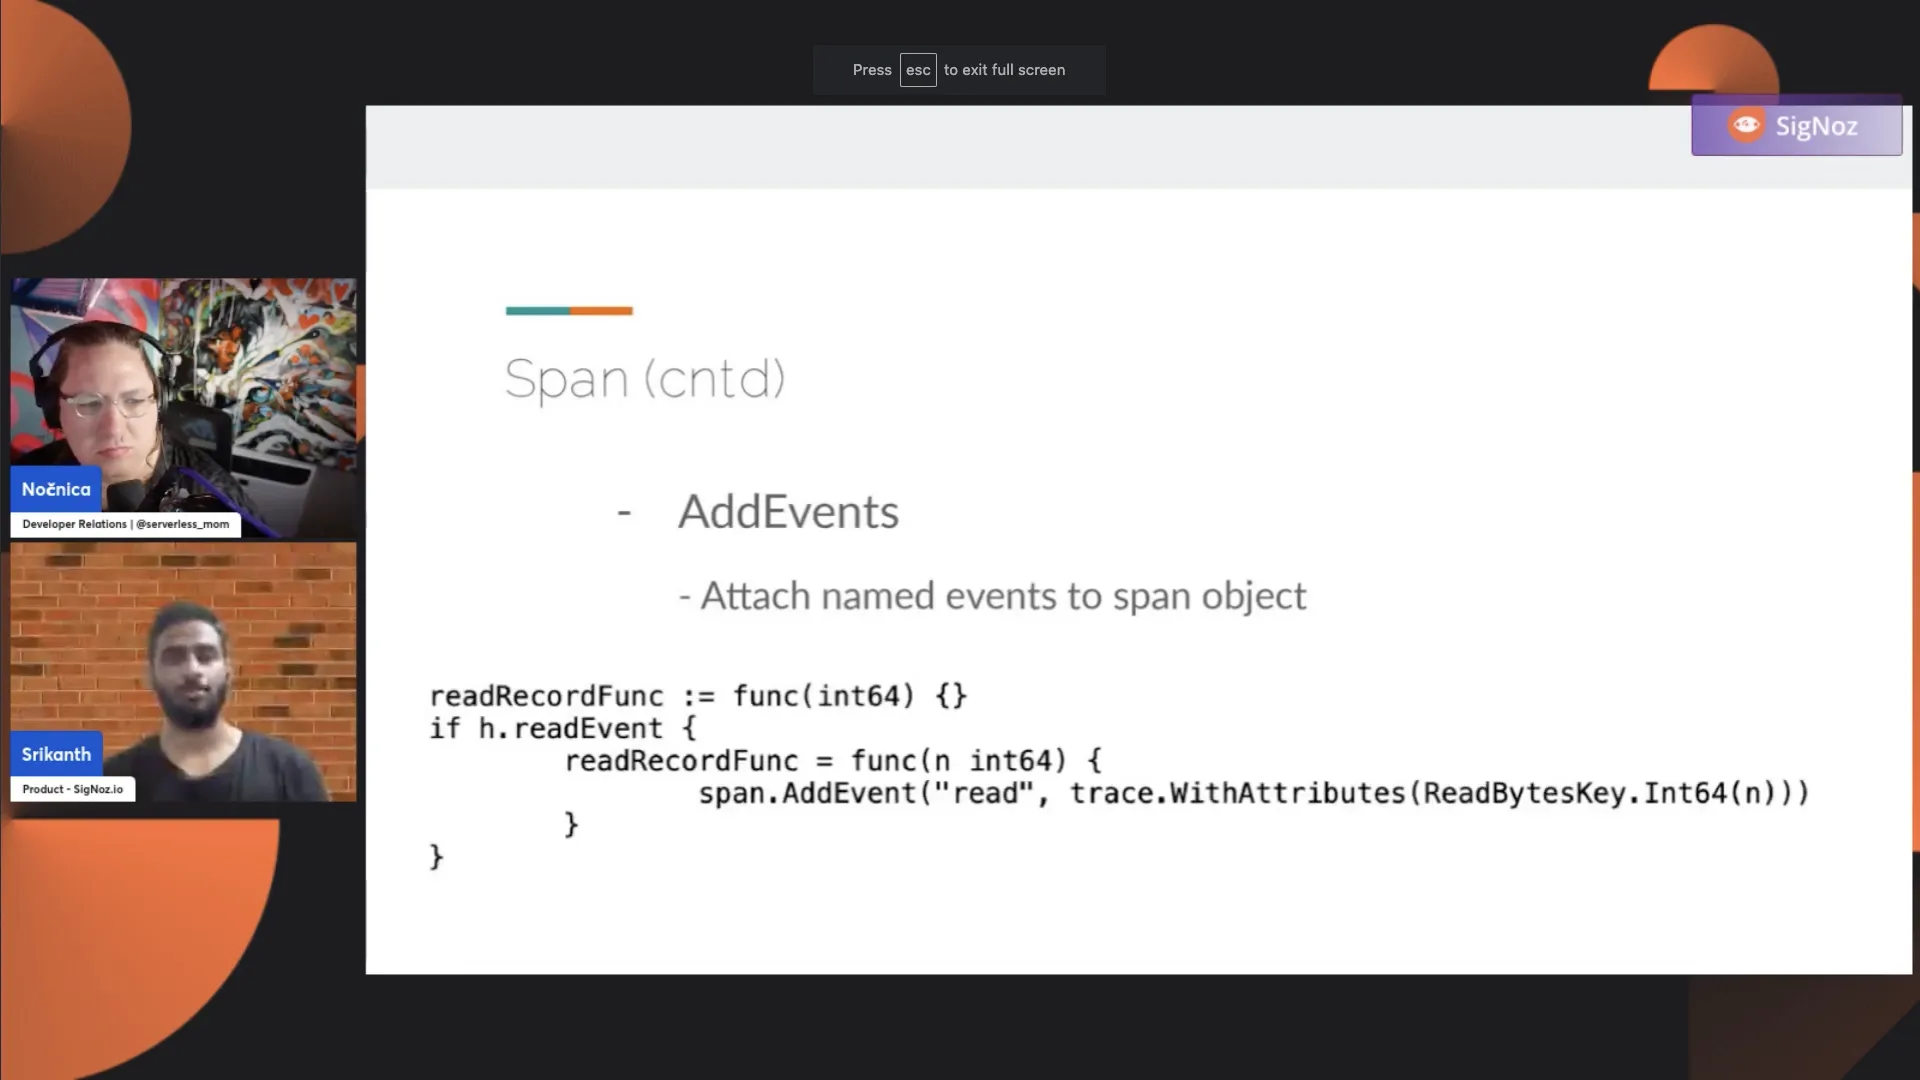
Next, we have AddEvents. During your span journey, there could be many events happening. You could send an event like a request to an external system and know whether it succeeded or not.
For example, if it failed, you would want to add an "external call failed" event to this span. When you look back at your tracing, it has this information about the things it tried and if there was a failure. The event is more useful than attributes because it tells you much more information. For instance, it gives you the time when the event happened and what specific attributes caused the event to fail. Let's say you add an "external event fail" with a timestamp and attributes that caused the failure. AddEvent is helpful in such cases.
Nica: This is always my understanding like an event is just a richer object. It's not just a single key-value pair that you're adding. So, if you have a whole event readout, like from a failure lookup or something, don't add nine attributes to that span. Just add an event. Right?
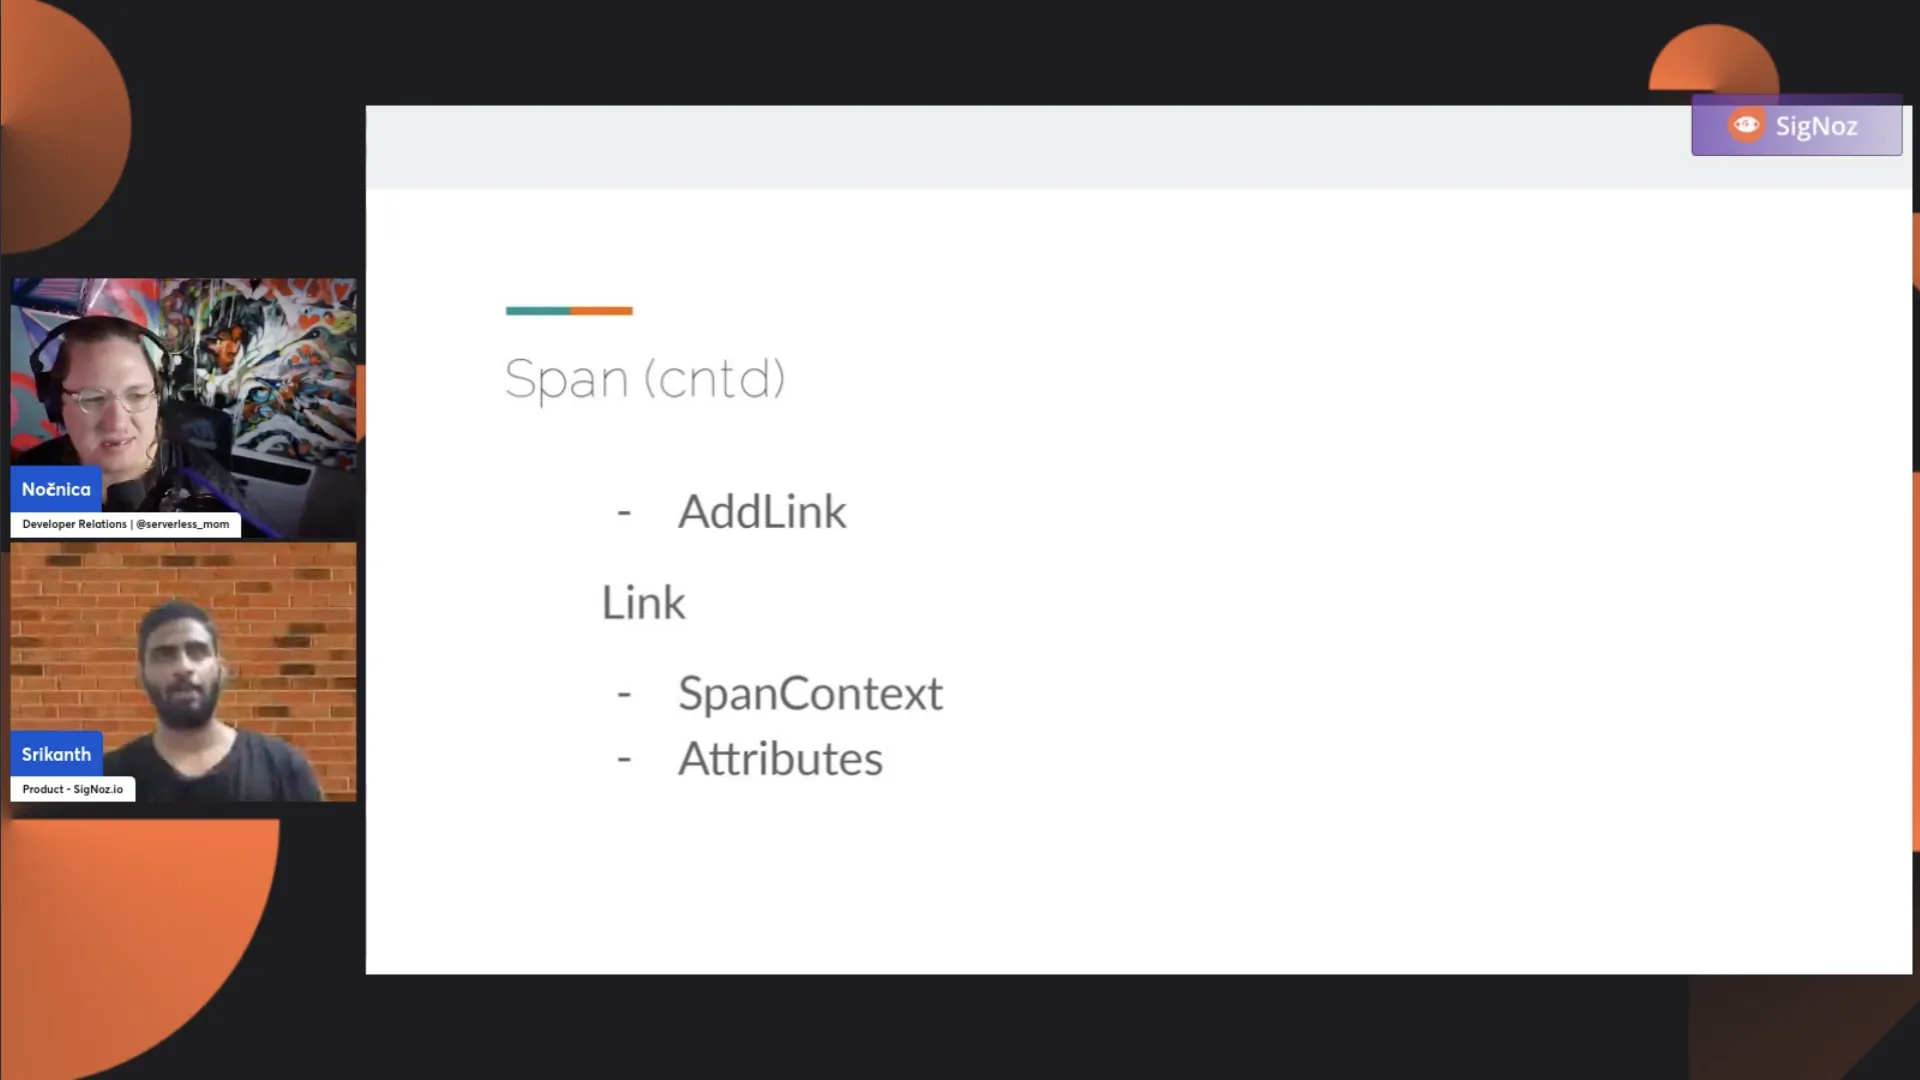
Srikanth: Next, next, we have AddLinks. It's useful when you want to link different traces together, like when you want to add traces together.
For instance, in a regular HTTP request flow, there might be a branch-out logic where a request goes to a queue. Within the regular request flow, it's synchronous, but when you send an event to the queue, you don't know when it will end.
In those cases, how do you connect whatever the queue has received, like whatever message was processed by the queue? How do you know which request triggered the queue processing? This is where AddLinks helps. When you start a new trace in the queue processing system, you link this trace to the existing trace. This helps in tracing back to see which request triggered the message processing. AddLinks is not very common but very helpful in messaging systems. Next.
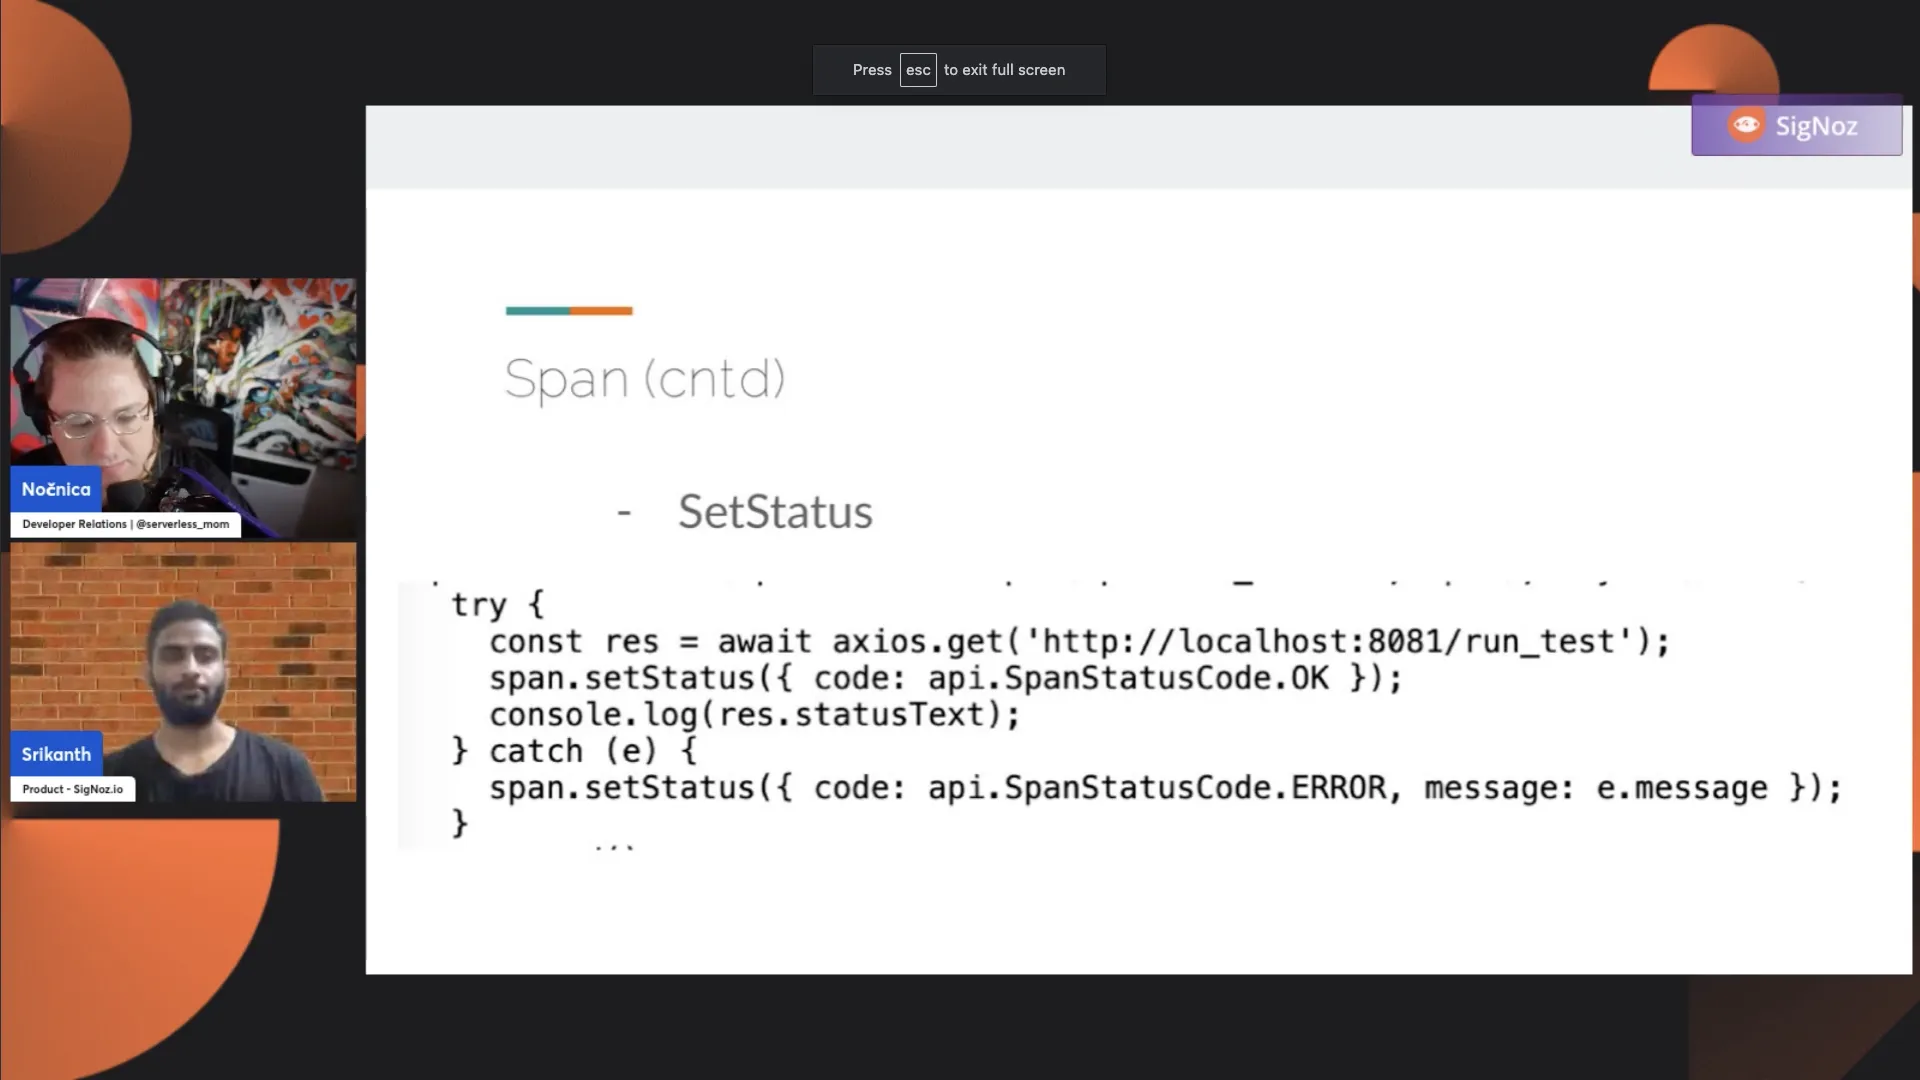
Next, we have SetStatus. Any span that you perform, any operation, has states associated with it—either the operation was successful or it was a failure. A span represents a unit of operation. The SetStatus method lets you set the status of this operation. By default, it is unset. Let's say you make a call to the database and the call fails for some reason. You use SetStatus to indicate that this operation failed.
Here in this example, we are looking at an external event. We are making some request calls, and if the request fails, we are setting the span status as an error. So that when it reaches your tracing backend, you know that it has failed. This is highlighted in your tracing backend. It makes it easy to have a quick look at what are those operations that fail.
Nica: Yeah, and if it's failing with a third-party API or something, right? Like if it's failing to look up a user, that's not going to show up automatically in tracing or automatically track as a failure.
Srikanth: You need to take care of that detail again in manual instrumentation. Anytime you suspect there can be a possibility of an operation failure, make sure that you set the status so that you don't miss whether this operation was successful or a failure when it reaches you back.
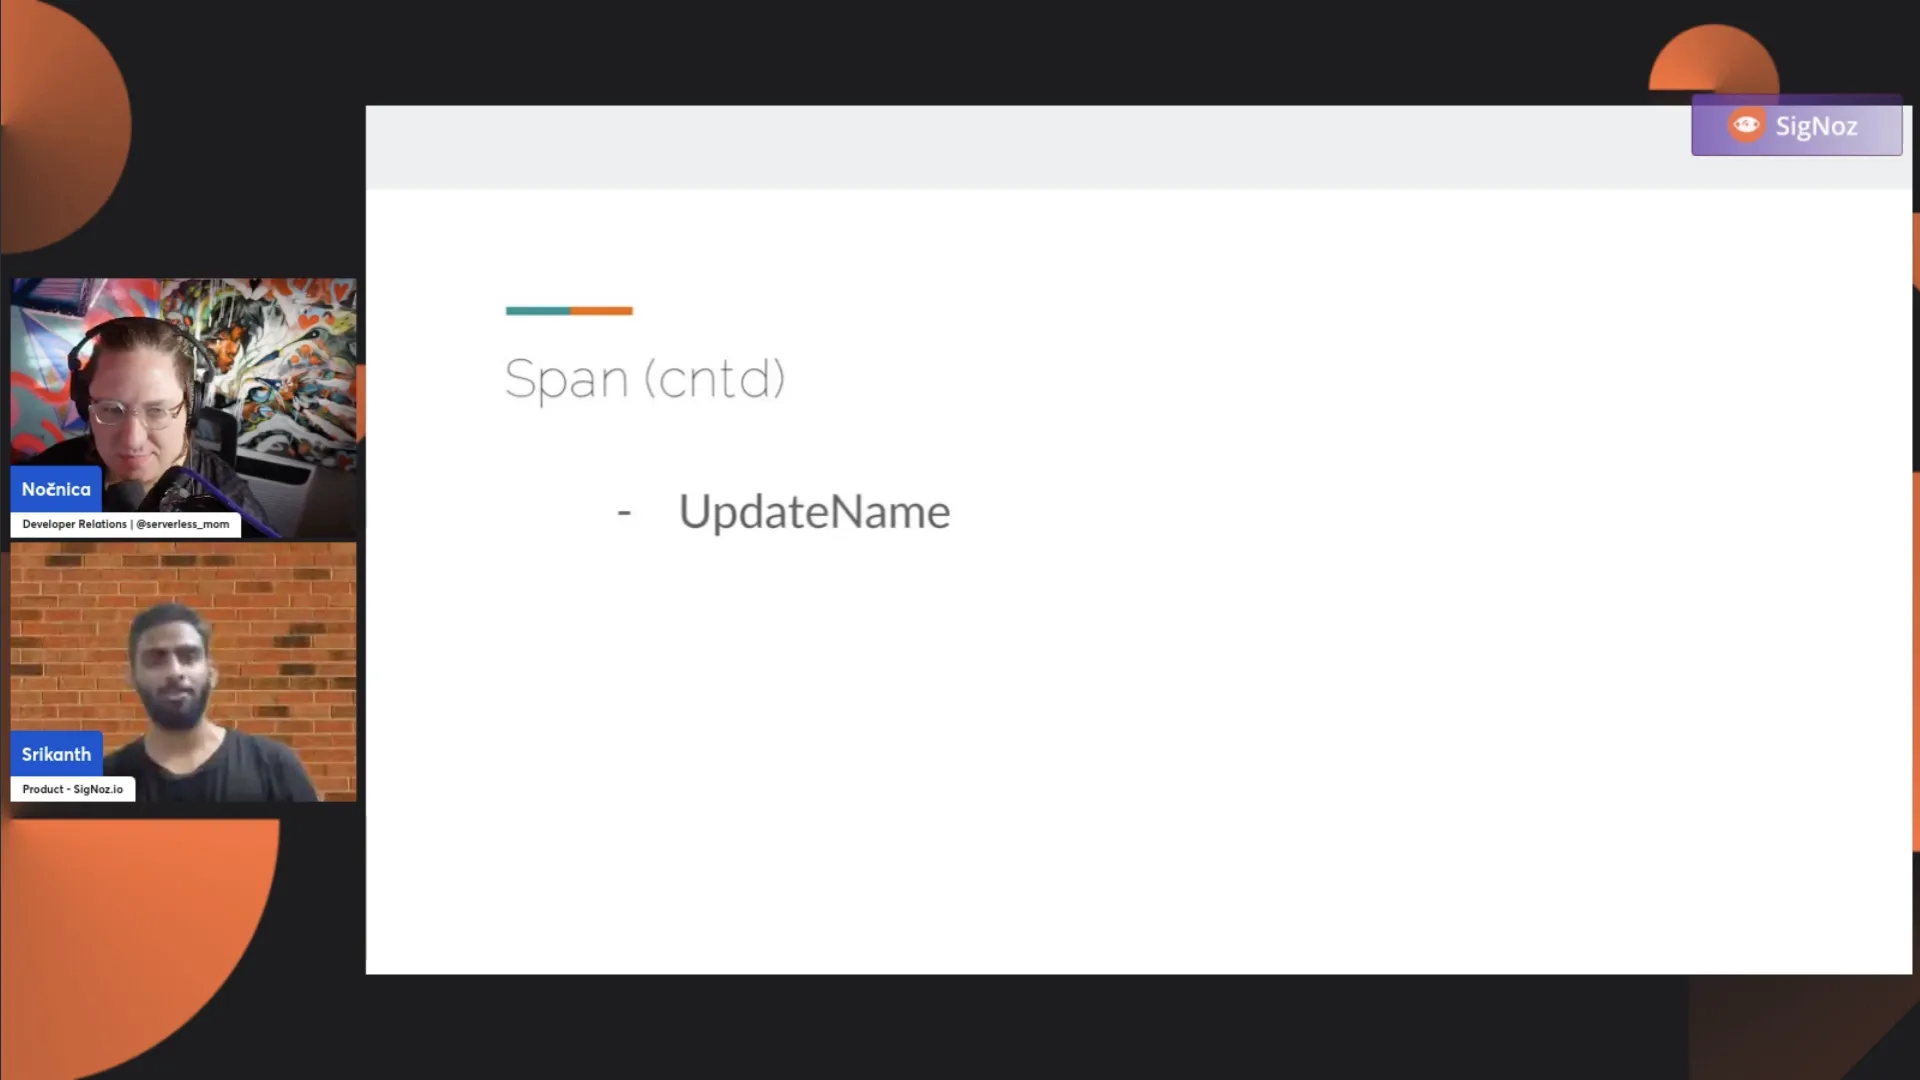
Next, we have UpdateName. I haven't seen anybody use this in practice, but once you start the span name, you can change the name afterward. Also, when you create the span, you generally give the span name. But for some reason, you don't want to use the original span name, updateName gives you the ability to change the span name. I haven't seen this in practice. Not many people use it, but it is possible. Let's say you start with some name, and you don't have enough information to give a proper span name, but you'll get it sometime later. Then it's perfectly fine to start with some name that does not make sense, which is not very useful, but update it later on.
Nica: Yeah, all I can think is like you've bought into OpenTelemetry, and you have a constant annoyance around some span that's not being labeled correctly.
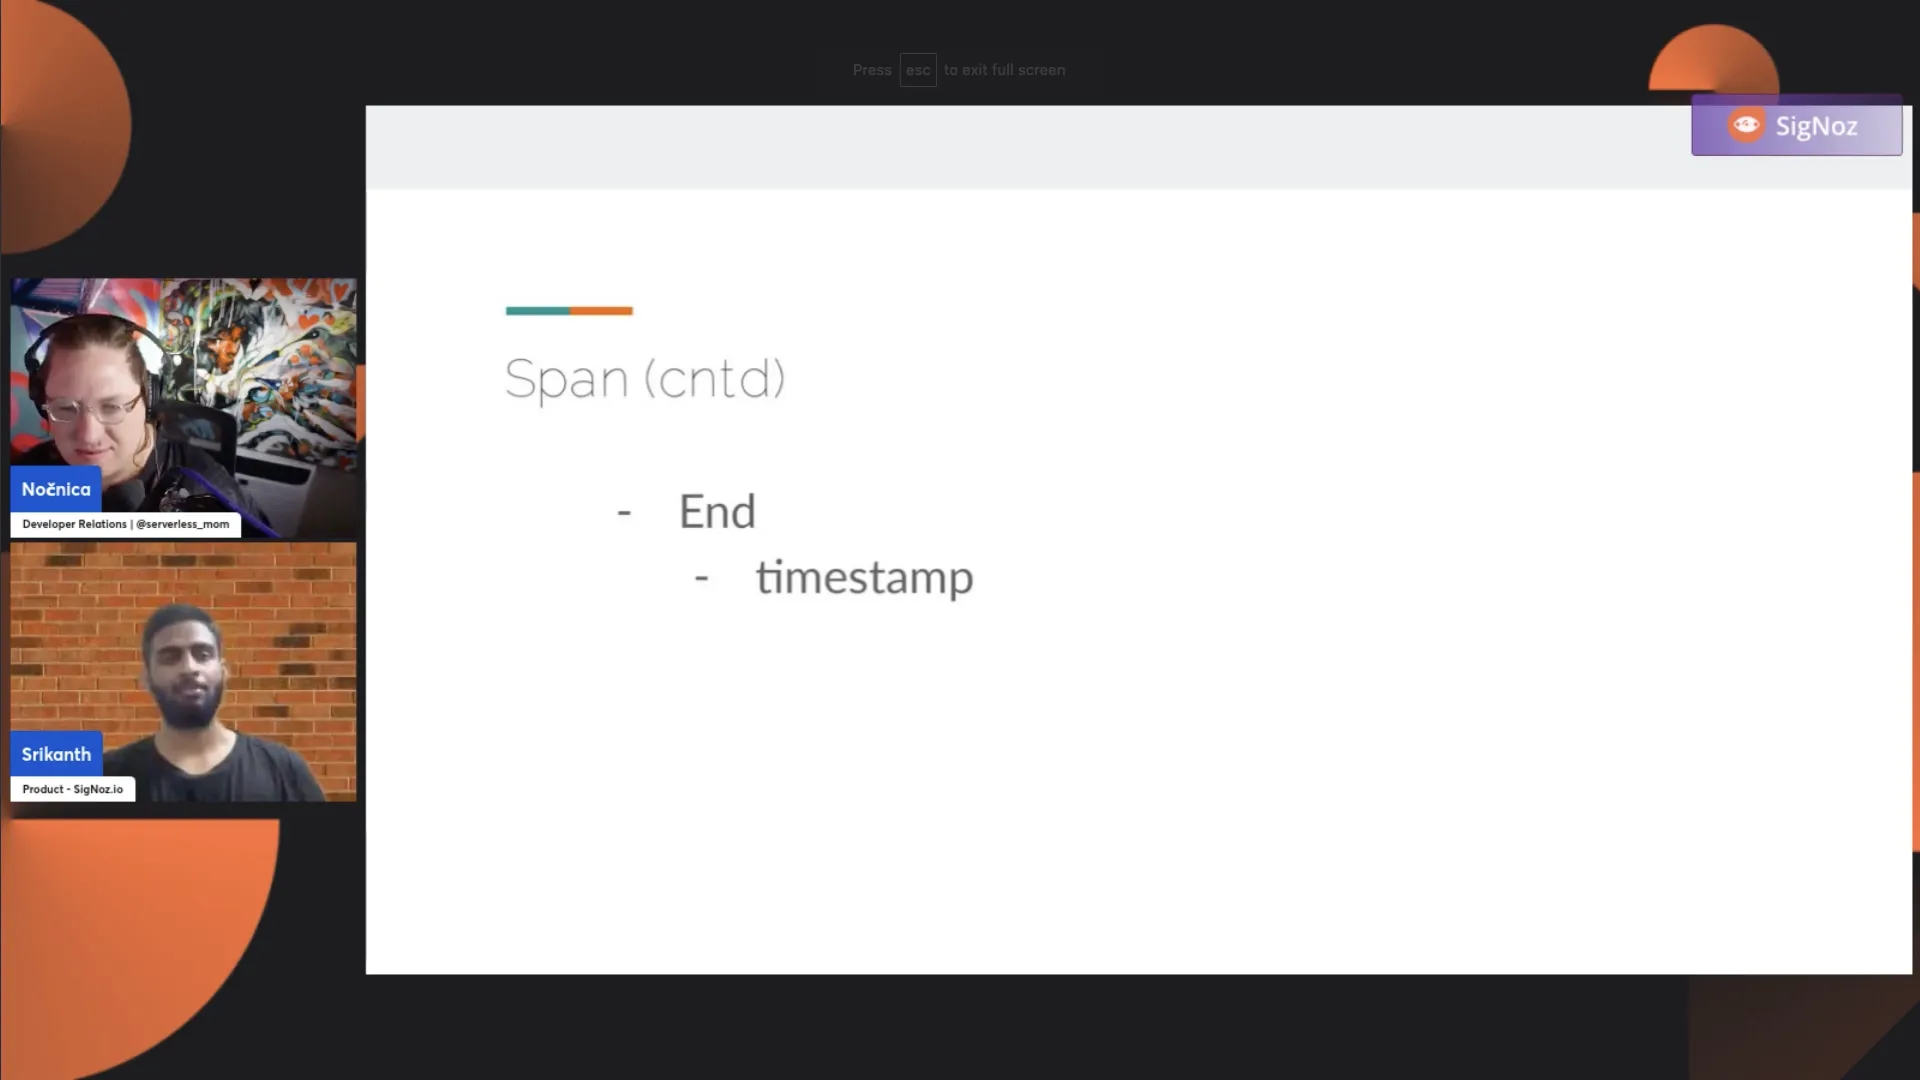
Srikanth: And then we discussed that there's a start span that accepts the timestamp. Similarly, there is an End method which also accepts a timestamp. If you do not provide any timestamp when you perform span.end, it takes the current timestamp as the end timestamp. But it gives you the flexibility to give the custom timestamp.
So, you can start a span at your own time and end a span with your timestamp. You are not bounded by the fact that it will only take the current end time as a current timestamp. This gives you the flexibility. This helps in use cases where you have a start time and end time for certain operations that you get from somewhere, maybe a database or somewhere, maybe some written to file or somewhere where you do not have them. But you want to have a trace created with raw data.
The End also has this optional parameter timestamp. If you don't provide it, it will use the timestamp. But if you provide it, the span end timestamp will be the timestamp that you have given as an argument.
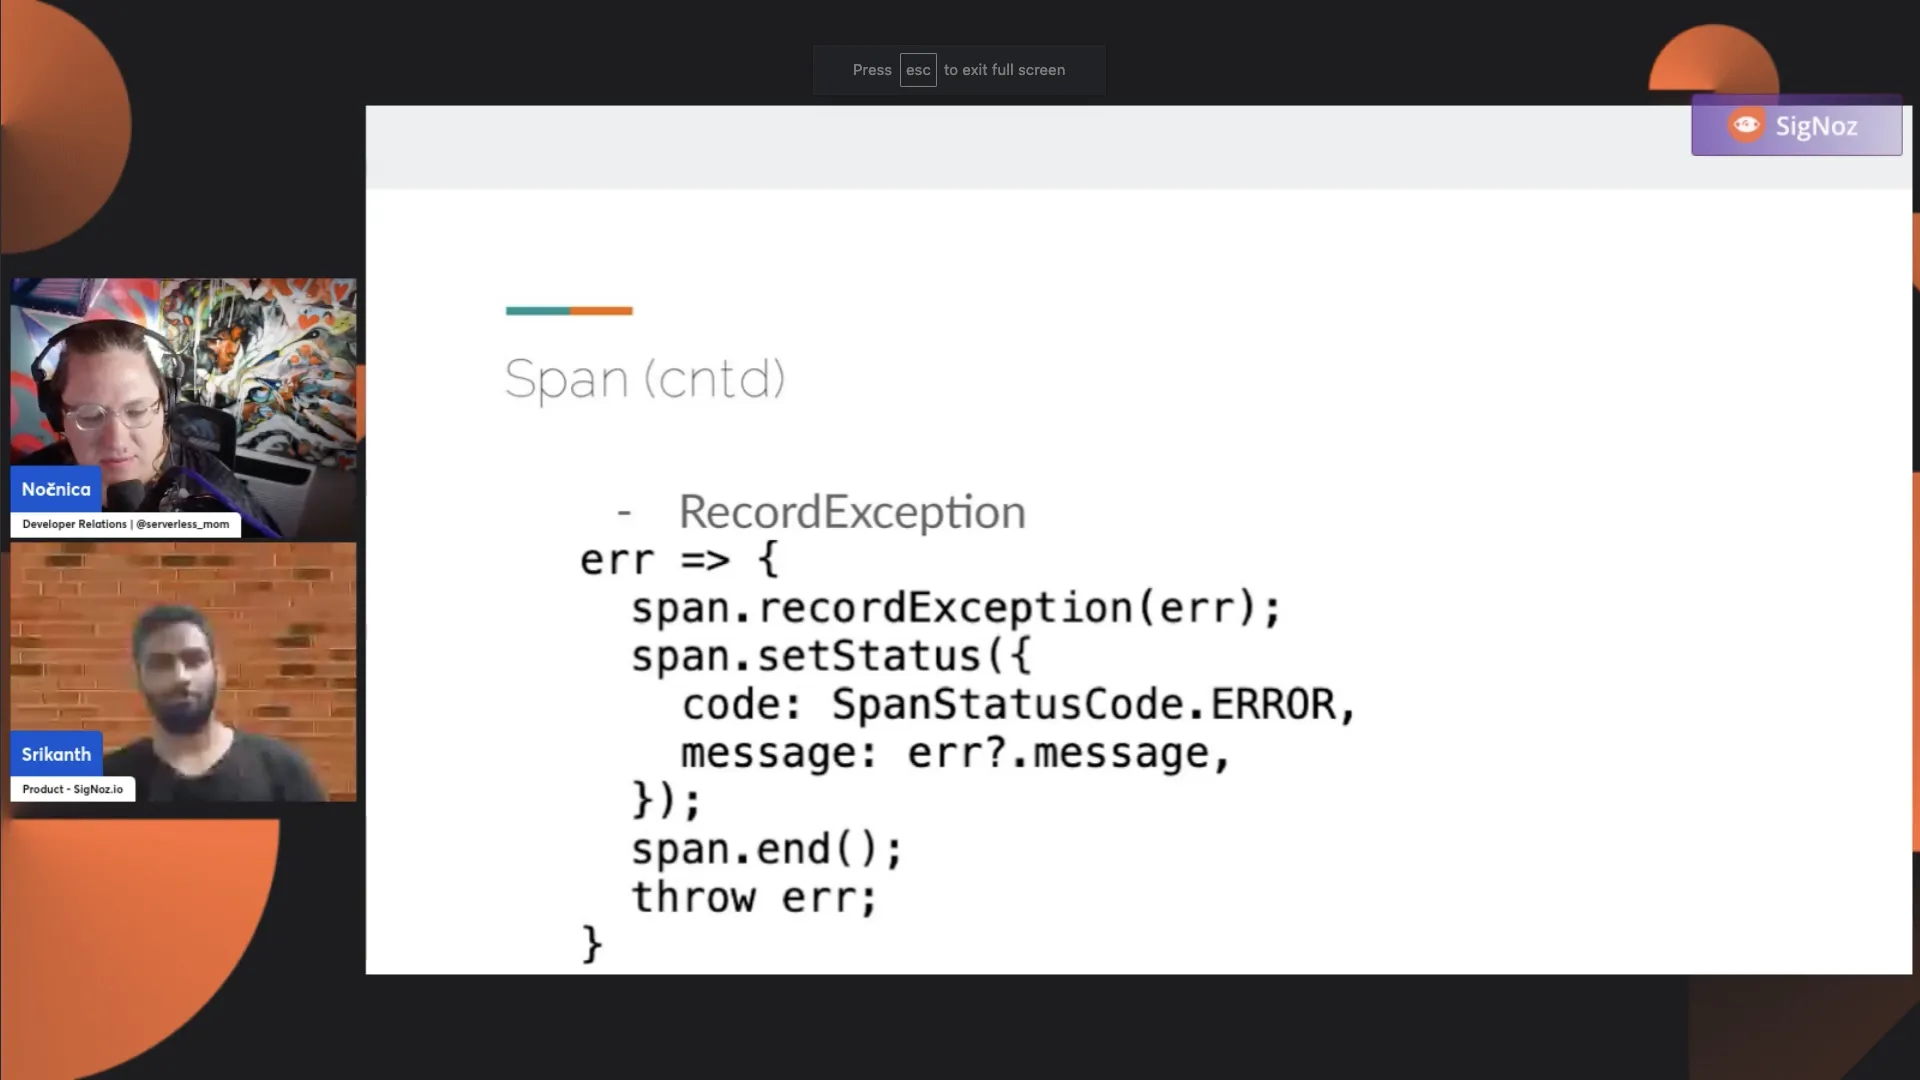
And next, we have RecordException. This is an AddEvent. It's a convenient method again. When you do RecordException, it adds an event with certain attributes like stack trace, exception type, and exception message. There are certain attributes which it neatly formats for you. But it is just a simple convenience around the event.
So that's all. We have seen the provider; we have seen the Tracer object, and we have discussed the span, which is where you work mostly. We have also briefly discussed the context, which is very important so that you don't get broken traces in your system.
Nica: This is so cool because I was writing this week about doing some of this stuff in Python, about adding some manual calls to add details to your traces. But there's a couple that was like, I'd seen them but hadn't thought about how they would be used, like IsRecording, and yeah, that's pretty nice to see.
So, you know, this fills our time. I think we have to come back for another week to ask a couple more of my questions about the tracing strategy. But this was so great. I want to thank you for taking the time. Let's give a few minutes to see if we have some questions coming in, just keeping an eye here on the event.
Let me see if we're getting questions here in the chat. One sec. And yeah, I'll take a look on YouTube as well. Thank you so much, guys. Usually, you do ask some great questions. Looks like chat's quiet today, so we're free. We don't have to stay any later today, so that's the good news.
Well, folks, this will go up as a blog post on the Signal blog as well. You can see us almost every week with their OpenTelemetry webinars. We'll be doing a call soon on using OpenTelemetry to monitor language learning models, which we're super excited about. This was great. Of course, we have to have you back again very soon. And I'm remembering which direction you're in. So it's this way.
Thank you so much for joining us, folks. If you have questions, either go ahead and drop them under the video as comments or join our community Slack and ask them there. Thank you so much, everybody. Thank you.
Thank you for taking out the time to read this transcript :) If you have any feedback or want any changes to the format, please create an issue.
Feel free to join our Slack community and say hi! 👋