Sending and Filtering Python Logs with OpenTelemetry
While support for logging in the OpenTelemetry Python project is listed as 'experimental,' it's completely possible to send logs from your Python application. The Opentelemetry Collector has support for numerous existing logging systems, effectively exporting log data from wherever you were sending logs currently; you can also use the filelog receiver to tail and send logs from files. The only 'experimental' portion of the Python SDK is sending logs directly from code-level instrumentation.
This guide describes how to send logs to the OpenTelemetry Collector, and how to configure the collector to filter and transform your data. If you're using the SigNoz distro of the OpenTelemetry collector, you'll get some filters set by default, but the process and configuration tools remain the same. Default configuration gets you a few details like time and service name, but it’s possible to go much deeper with a relatively simple configuration. It’s also a good idea to check for attributes that may contain Personal Identifying Information (PII) and remove them with filters.

Logs, one of the three signals of OpenTelemetry
OpenTelemetry is designed to make it easy for engineers to gather a complete Observability picture of their application. OpenTelemetry focuses on three main signals: traces, metrics, and logs.
- Traces: Traces provide a detailed view of the path that a request takes through an application. They allow developers to see where time is being spent, where bottlenecks are occurring, and how different services are interacting. Traces are made of time spans or just 'spans' that record time elapsed on a single service or method.
- Metrics: Metrics are numerical values that are recorded over time, providing a way to measure the behavior of systems. They can include values like error rates, response times, and system resource utilization.
- Logs: Logs are textual or binary records generated by components in the system. They provide detailed contextual information about what the system is doing at any given time, and they can be correlated with trace and metric data to provide a comprehensive view of system behavior.
Critically, while logs have often been considered a data stream separate from tracing and metrics, OpenTelemetry focuses on the correlation between all three signals. While the rest of this tutorial will purely cover sending logs, it's important to note that, as the OpenTelemetry project becomes more mature, Logs will be more integrated into the complete observability picture. In the future every trace will come with context information that connects it to the appropriate logs, and most logs will include a 'trace context' that shows what request was being handled at the time.
I. Instrument your python application
While you don't have to report any traces or metrics to be able to send logs, you will need to add OpenTelemetry dependencies to your project, and run the OpenTelemetry agent.
Logging can be sent from an application that has been automatically instrumented with the opentelemetry-bootstrap command, and there is support for most major Python frameworks to send extensive tracing and metric data without any modification of your code. However, automatic instrumentation will not send any logs, so you'll still need to add code to send logs, or export logs directly to the collector as described in section II.
Alternatively, you can manually add OpenTelemetry to your application along with the code to create an export path for your logger to OpenTelemetry. This exporter will use the OpenTelemetry Protocl (OTLP) to send logs to your collector. In the example application code below, this manual process was used.
You will need a collector
This guide won't show in detail how to install the OpenTelemetry collector, suffice to say that you'll need a collector available to send data. Though in a pinch you can send data to a console, it's possible to run a local collector as a docker image, or you can install SigNoz and get both an OpenTelemetry collector, data store, and observability dashboard. This guide will assume that your collector is available to receive at localhost:4317.
II. Send Logs
The majority of production applications using OpenTelemetry adopted the standard sometime after they were first architected. As such the most common use case is routing an existing log pipeline to the OpenTelemetry collector. This is mainly accomplished with the Bridge API; intended to connect existing logging with OpenTelemetry. It can be used together with existing logging libraries to automatically inject the trace context in the emitted logs, and provide an easy way to send the logs via OTLP.
If you aren't currently sending your logs anywhere, or there's no support for your tool with the bridge API, you can always get your logs by brute force as a file or stdout export - if you have access to read your logging file periodically or tail your logs, you can parse bare files or .csv or json-formatted and send them to the collector. If you cannot parse your logs yourself, another log collection agent, for example FluentBit, can collect the logs, then send the logs to OpenTelemetry Collector.
Currently, only the OpenTelemetry Java project sends logs automatically without any special work. But you can manually send logs with the Python SDK as well as a few others.
For my example below, I sent logs directly via network calls using OTLP, but this approach is specifically not recommended for production use, and I doubt anyone wants to maintain dozens of network calls from all over their code! But it will work for initial exploration.
import logging
from opentelemetry import trace
from opentelemetry._logs import set_logger_provider
from opentelemetry.exporter.otlp.proto.grpc._log_exporter import (
    OTLPLogExporter,
)
from opentelemetry.sdk._logs import LoggerProvider, LoggingHandler
from opentelemetry.sdk._logs.export import BatchLogRecordProcessor
from opentelemetry.sdk.resources import Resource
import json
import os
from random import randint
from flask import Flask, request

resource = Resource.create(
        {
            "service.name": "demo-dice",
            "service.instance.id": "demo-dice",
        }
    )

# create the providers

logger_provider = LoggerProvider(resource=resource)

# set the providers

set_logger_provider(logger_provider)

exporter = OTLPLogExporter(endpoint=os.getenv("OTLP_ENDPOINT", "localhost:4317"), insecure=json.loads(os.getenv("INSECURE", "true").lower()))

# add the batch processors to the trace provider
logger_provider.add_log_record_processor(BatchLogRecordProcessor(exporter))


handler = LoggingHandler(level=logging.DEBUG,logger_provider=logger_provider)
# Create different namespaced loggers
logger1 = logging.getLogger("myapp.area1")
logger2 = logging.getLogger("myapp.area2")
logger2.addHandler(handler)
logger2.setLevel(logging.DEBUG)

app = Flask(__name__)
app.logger.addHandler(handler)


@app.route("/rolldice")
def roll_dice():
    final_roll = str(do_roll())
    args = request.args
    user = args.get('user',  "anonymous")
    logger2.info("completed request for user: " + user + "with dice roll of: " + final_roll, extra={"method": "GET", "status": 200, "level": "info"})

    return final_roll

def do_roll():
    return randint(1, 6)

# driver function
if __name__ == '__main__':
    app.run(host='0.0.0.0', port=5002)
    logger_provider.shutdown()
You can run this flask application with a simple flask run and send it requests at localhost:5000/rolldice to receive a dice roll and send logging to your collector. Again, this demo app assumes that your collector is listening at localhost:4317, but you can configure this by setting the environment variable OTLP_ENDPOINT.
III: Configure the Collector
If you take a look at a default collector configuration in otel-collector-config.yaml, you'll see the framework for configuring how we ingest, process, and emit data. More detail is in the OpenTelemetry documentation. In the SigNoz repository you’ll find the configuration for the collector in /deploy/docker/otel-collector-config.yaml If running the collector as a docker image you can edit this file to filter what logs are being stored after being received by the collector.
After editing this file, you’ll need to restart the collector. If using Docker, the command would be docker restart signoz-otel-collector
If deployed to a Kubernetes Cluster via a helm chart, you'll need to use overide values at installation, and update the configuration with helm upgrade.
It’s worth examining some chunks of this config unedited. Again, the SigNoz collector is a fork of the OpenTelemetry collector, and all this configuration is applicable to the collector in general.
How the default filter keeps out unwanted logs
In the receivers: section you’ll find this rather large expression:
- type: filter
  id: signoz_logs_filter
  expr: 'attributes.container_name matches "^signoz-(logspout|frontend|alertmanager|query-service|otel-collector|clickhouse|zookeeper)"'
In this case, we don’t want our SigNoz process to get ‘too meta’ so we’re eliminating logging that’s generated by our own containers and their attached services, so that it’s not confusing your application data.
Notably, the filtering defined here won’t take effect unless it’s referenced in the pipelines section.
In my case, my logging was getting clogged up by docker containers I was running from poking around with another Kubernetes tool called Testkube, so I updated the pattern to exclude anything with the name testkube:
- type: filter
  id: signoz_logs_filter
  expr: 'attributes.container_name matches "^(signoz-(logspout|frontend|alertmanager|query-service|otel-collector|clickhouse|zookeeper)|.*testkube.*)"'
IV: Transform and filter log attributes
With the unneeded logs filtered out, we can start transforming and filtering our logs data. This is done by transforming data, using the OpenTelemetry Transformation Language (OTTL). It’s not necessary or practical to learn all the ins and outs of this language, but let’s start with a simple bit of processing that adds some useful attributes.
Transform attributes
Within the processors section. we’ll add a transform
transform:
log_statements:
- context: log
statements:
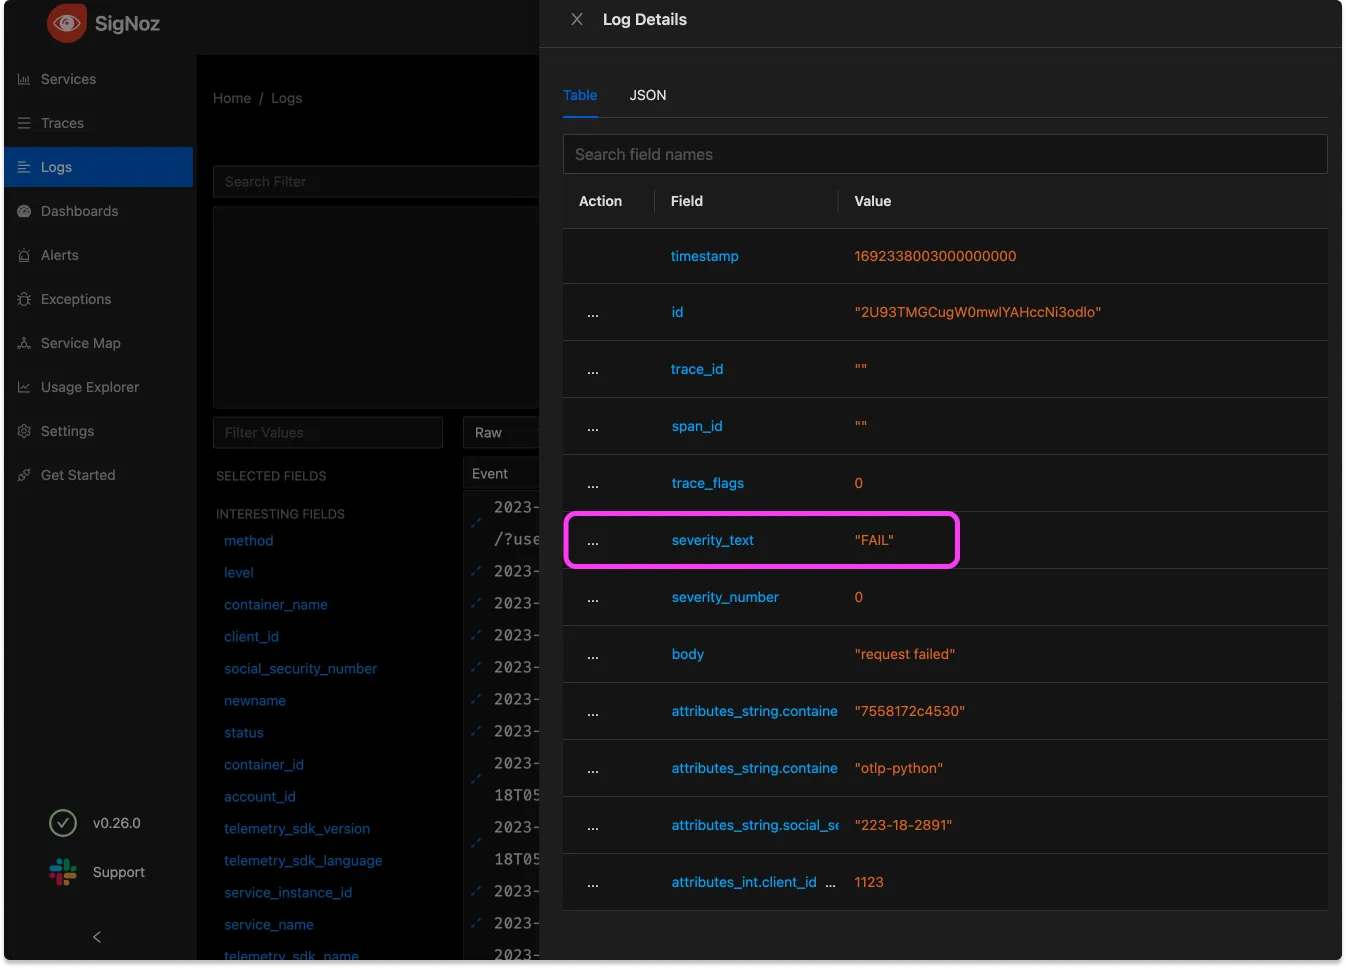
- set(severity_text, "FAIL") where body == "request failed"
This config has the goal of adding an attribute that’s clearly readable when there’s a particular request body. Note that it’s possible to do more complex matching here, but == works fine for this
Adding this mapping, however, isn’t enough to add the attribute, we haven’t yet added this processor to our pipeline, check the pipelines mapping for logs:
logs:
  receivers: [otlp, tcplog/docker]
  processors: [logstransform/internal, batch]
  exporters: [clickhouselogsexporter]'
To actually affect our data, we must add it to the pipeline. The revised version looks like this:
logs:
  receivers: [otlp, tcplog/docker]
  processors: [transform, logstransform/internal, batch]
  exporters: [clickhouselogsexporter]
Processors are executed in order so we want to add this processor before the batch processor. This is more critical if one of our processors scrubs out concerning data. In general, custom processors should go before those that are standard.
Filter data
Next, there's some data that we don't want at all, like sensitive user data. Let's filter some:
transform:
log_statements:
- context: log
statements:
- set(severity_text, "FAIL") where body == "request failed"
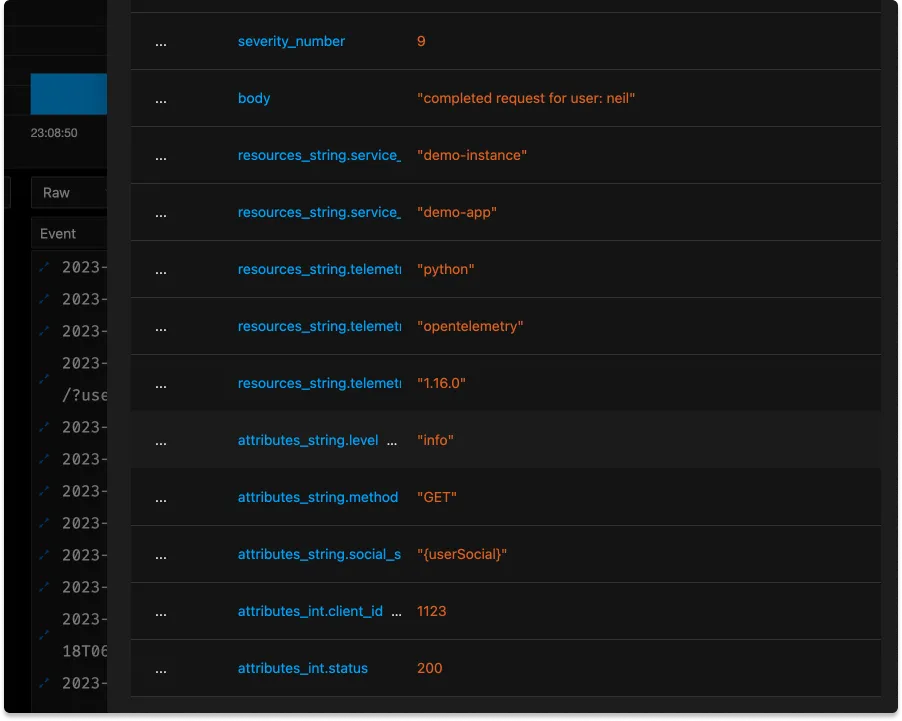
- replace_match(attributes["social_security_number"], "*", "{userSocial}")
Since, in this case, the PII was nicely labeled it’s easy enough to replace any possible value with a generic.
In a real-world scenario it might be worthwhile to try and filter out such vital information at the instrumentation layer if possible. However it’s always good to be filtering for PII twice!
Reduce data cardinality
High cardinality is often a concern with metrics data, but not usually with logs. High cardinality means that there are many unique combinations of attributes, which can lead to an explosion in the amount of data that needs to be stored and processed, but shouldn't logs always have (nearly) unique data? Remeber that with the transformations above we're creating structured logs that have multiple data attributes. If we store attributes where every single value is unique, we won't be able to chart or process that data later with something like the SigNoz logs query builder or elasticsearch. Here's one example where removing cardinality makes sense:
logs:
  replace_match(attributes["http.target"], "/user/*/list/*", "/user/{userId}/list/{listId}")
Notably it is possible that we will wish we had a userID for this log, but if so we should parse it out as its own attribute in the next section. Keeping ID’s in an [http.target](http://http.target) attribute will make it impossible to do any collation of data. Transformations can be a key step in normalizing our data.
Automatic vs Manual Instrumentation
OpenTelemetry supports both automatic and manual instrumentation:
Automatic instrumentation uses the
opentelemetry-bootstrapcommand to instrument your application without modifying the code. It's quick to set up but offers less control.Manual instrumentation requires you to add OpenTelemetry calls to your code explicitly. It provides more flexibility and allows you to capture custom metrics and events.
For most applications, a hybrid approach works best: use automatic instrumentation for common libraries and frameworks, and add manual instrumentation for critical business logic.
Conclusion
In the future, as OpenTelemetry grows into the de facto standard for all observability in microservice architectures, logs will be a part of a cohesive 'braid' of telemetry signals. Offering structured information on events with included unstructured components, logs will help tell the detailed story of individual events within your application.
Today, prepare for the future by learning the process of collecting and processing logs in Python with OpenTelemetry. For further reading, see the OpenTelemetry processor operations documentation.
FAQs
How does OpenTelemetry improve Python logging compared to traditional methods?
OpenTelemetry provides a unified approach to observability, combining logs, metrics, and traces. This integration allows for better context and easier debugging compared to standalone logging solutions.
Can I use OpenTelemetry with existing Python logging libraries?
Yes, OpenTelemetry can integrate with popular logging libraries like logging. You can use bridges or exporters to send logs from these libraries to OpenTelemetry.
What are the performance implications of using OpenTelemetry for logging?
While OpenTelemetry adds some overhead, it's generally minimal. The batching and asynchronous processing features help minimize the impact on application performance.
How can I troubleshoot common issues when sending logs with OpenTelemetry?
Common troubleshooting steps include:
- Verify your OpenTelemetry configuration
- Check network connectivity to your log backend
- Enable debug logging for the OpenTelemetry SDK
- Use the OpenTelemetry Collector to diagnose issues in the logging pipeline
What are the three main signals in OpenTelemetry?
The three main signals in OpenTelemetry are traces, metrics, and logs. Traces provide a detailed view of request paths, metrics are numerical values recorded over time, and logs are textual or binary records generated by system components.
How can I send logs from a Python application using OpenTelemetry?
You can send logs from a Python application using OpenTelemetry by either using the Bridge API to connect existing logging with OpenTelemetry, or by manually adding OpenTelemetry to your application and creating an export path for your logger to OpenTelemetry using the OTLP protocol.
What is the OpenTelemetry Collector, and why is it important for logging?
The OpenTelemetry Collector is a component that receives, processes, and exports telemetry data. It's important for logging because it allows you to centralize the collection of logs, apply filters and transformations, and forward the data to various backends or analysis tools.
How can I filter out unwanted logs in the OpenTelemetry Collector?
You can filter out unwanted logs in the OpenTelemetry Collector by using the filter processor in the collector's configuration file. This allows you to define expressions to match and exclude specific log entries based on their attributes or content.
What is the OpenTelemetry Transformation Language (OTTL), and how is it used in log processing?
The OpenTelemetry Transformation Language (OTTL) is a domain-specific language used to transform and filter telemetry data in the OpenTelemetry Collector. It's used in log processing to add, modify, or remove attributes from log entries, change log severity levels, or perform other transformations on the log data before it's exported.
