SigNoz + Tracetest: OpenTelemetry-Native Observability Meets Testing
What is the hidden potential of OpenTelemetry? It goes a lot further than the (awesome) application of tracing and monitoring your software. The OpenTelemetry project is an attempt to standardize how performance is reported and how trace data is passed around your microservice architecture. This context propagation is a superpower for those who adopt OpenTelemetry tracing. Tracetest promises to make this deep tracing a huge new asset in your testing landscape, and SigNoz helps all engineers get insight into what OpenTelemetry can see.

Check out this hands-on Demo example of how Tracetest works with SigNoz! Or, if you like watching videos more, view a demo of Tracetest in the SigNoz Community call.
What is SigNoz?
SigNoz is an open-source, OpenTelemetry-native observability tool that helps you monitor your applications and troubleshoot problems. It provides traces, metrics, and logs under a single pane of glass.
It collects data using OpenTelemetry, an open-source observability solution. OpenTelemetry is backed by the Cloud Native Computing Foundation. The project aims to standardize how we instrument our applications for generating telemetry data (traces, metrics, and logs).
With SigNoz, you can:
- Visualize Traces, Metrics, and Logs in a single pane of glass.
- Monitor application metrics like p99 latency, error rates for your services, external API calls, and individual endpoints.
- Find the root cause of the problem by going to the exact traces that are causing the problem and see detailed flame graphs of individual request traces.
- Run aggregates on trace data to get business-relevant metrics.
- Filter and query logs, build dashboards and alerts based on attributes in logs.
- Monitor infrastructure metrics such as CPU utilization or memory usage.
- Record exceptions automatically in Python, Java, Ruby, and Javascript.
- Easily set alerts with DIY query builder.
What is Tracetest?
Tracetest is a tool for trace-based testing. It’s open source and part of the CNCF landscape.
Tracetest uses your existing OpenTelemetry traces to power trace-based testing with assertions against your trace data at every point of the request transaction. You only need to point Tracetest to your existing trace data source or send traces to Tracetest directly!
Tracetest makes it possible to:
- Define tests and assertions against every single microservice a trace goes through.
- Build tests based on your already instrumented system.
- Improve your OpenTelemetry instrumentation by ensuring rules and semantic convention standards are met.
- Define multiple transaction triggers, such as a GET against an API endpoint, a GRPC request, a Kafka message queue, etc.
- Define assertions against both the response and trace data, ensuring both your response and the underlying processes worked as intended.
- Save and run the tests manually or via CI build jobs with the Tracetest CLI.
Tracetest Now Works with SigNoz!
Tracetest now works with SigNoz, allowing you to bring the combined power of Tracetest and SigNoz to your developer workflows, and write trace-based tests with Tracetest!
If you already have OpenTelemetry instrumentation configured in your code and are using an OpenTelemetry Collector with SigNoz, adding Tracetest to your infrastructure can enable you to write detailed trace-based tests.

When running integration tests, it's hard to pinpoint where an HTTP transaction fails in a network of microservices. Tracetest solves this by letting you run tests with assertions using existing trace data across all services. These tests can then be seamlessly integrated into your CI/CD process to ensure your system works well and to catch any regressions.
Elevate your testing approach by harnessing Tracetest for test creation and SigNoz for analyzing test results. SigNoz empowers you to monitor test executions, establish connections between relevant services across different time frames and gain valuable perspectives on system performance. This combination enables you to understand system behavior, gives you insights into system performance and highlights the impact of changes on performance.

When using Tracetest, you can find problems by checking trace data over time in SigNoz. Any problems you encounter can become new tests or points to check in Tracetest. This gives you a quick feedback loop for continuous improvement.

Try Tracetest with SigNoz
Install SigNoz on-prem or sign up for a free trial, then configure your OpenTelemetry collector to send traces to SigNoz (see below).
Tracetest is open-source and easy to install. Start by installing the Tracetest CLI:
brew install kubeshop/tracetest/tracetest
From here, follow the official documentation to install the Tracetest server. Once the server is installed, open the Tracetest Web UI in the browser and follow the instructions for connecting the OpenTelemetry Collector with Tracetest.

The Collector is the recommended way to send OpenTelemetry data to an observability back-end. It is a highly configurable binary that allows you to ingest, process, and export OpenTelemetry data.
Enabling the SigNoz integration in Tracetest is as simple as configuring your OpenTelemetry collector to send spans to both Tracetest and SigNoz.
Copy this OpenTelemetry Collector configuration and paste it into your own configuration file.
# collector.config.yaml

# If you already have receivers declared, you can just ignore
# this one and still use yours instead.
receivers:
  otlp:
    protocols:
      grpc:
      http:

processors:
  batch:
    timeout: 100ms

exporters:
  debug:
    verbosity: detailed
  # OTLP for Tracetest
  otlp/tracetest:
    endpoint: tracetest:4317 # Send traces to Tracetest.
    tls:
      insecure: true
  # OTLP for Signoz
  otlp/signoz:
    endpoint: address-to-your-signoz-server:4317
    # Send traces to Signoz.
    tls:
      insecure: true

service:
  pipelines:
    traces/tracetest: # Pipeline to send data to Tracetest
      receivers: [otlp]
      processors: [batch]
      exporters: [debug, otlp/tracetest]
    traces/signoz: # Pipeline to send data to Signoz
      receivers: [otlp]
      processors: [batch]
      exporters: [debug, otlp/signoz]
Next, edit the config to add your SigNoz endpoint.
Create a Trace-based Test in Tracetest
For this example, we’ll use the official example app for Tracetest and SigNoz. To quickly access the example, run the following:
git clone https://github.com/kubeshop/tracetest.git
cd tracetest/examples/tracetest-signoz-pokeshop/
docker compose up --build
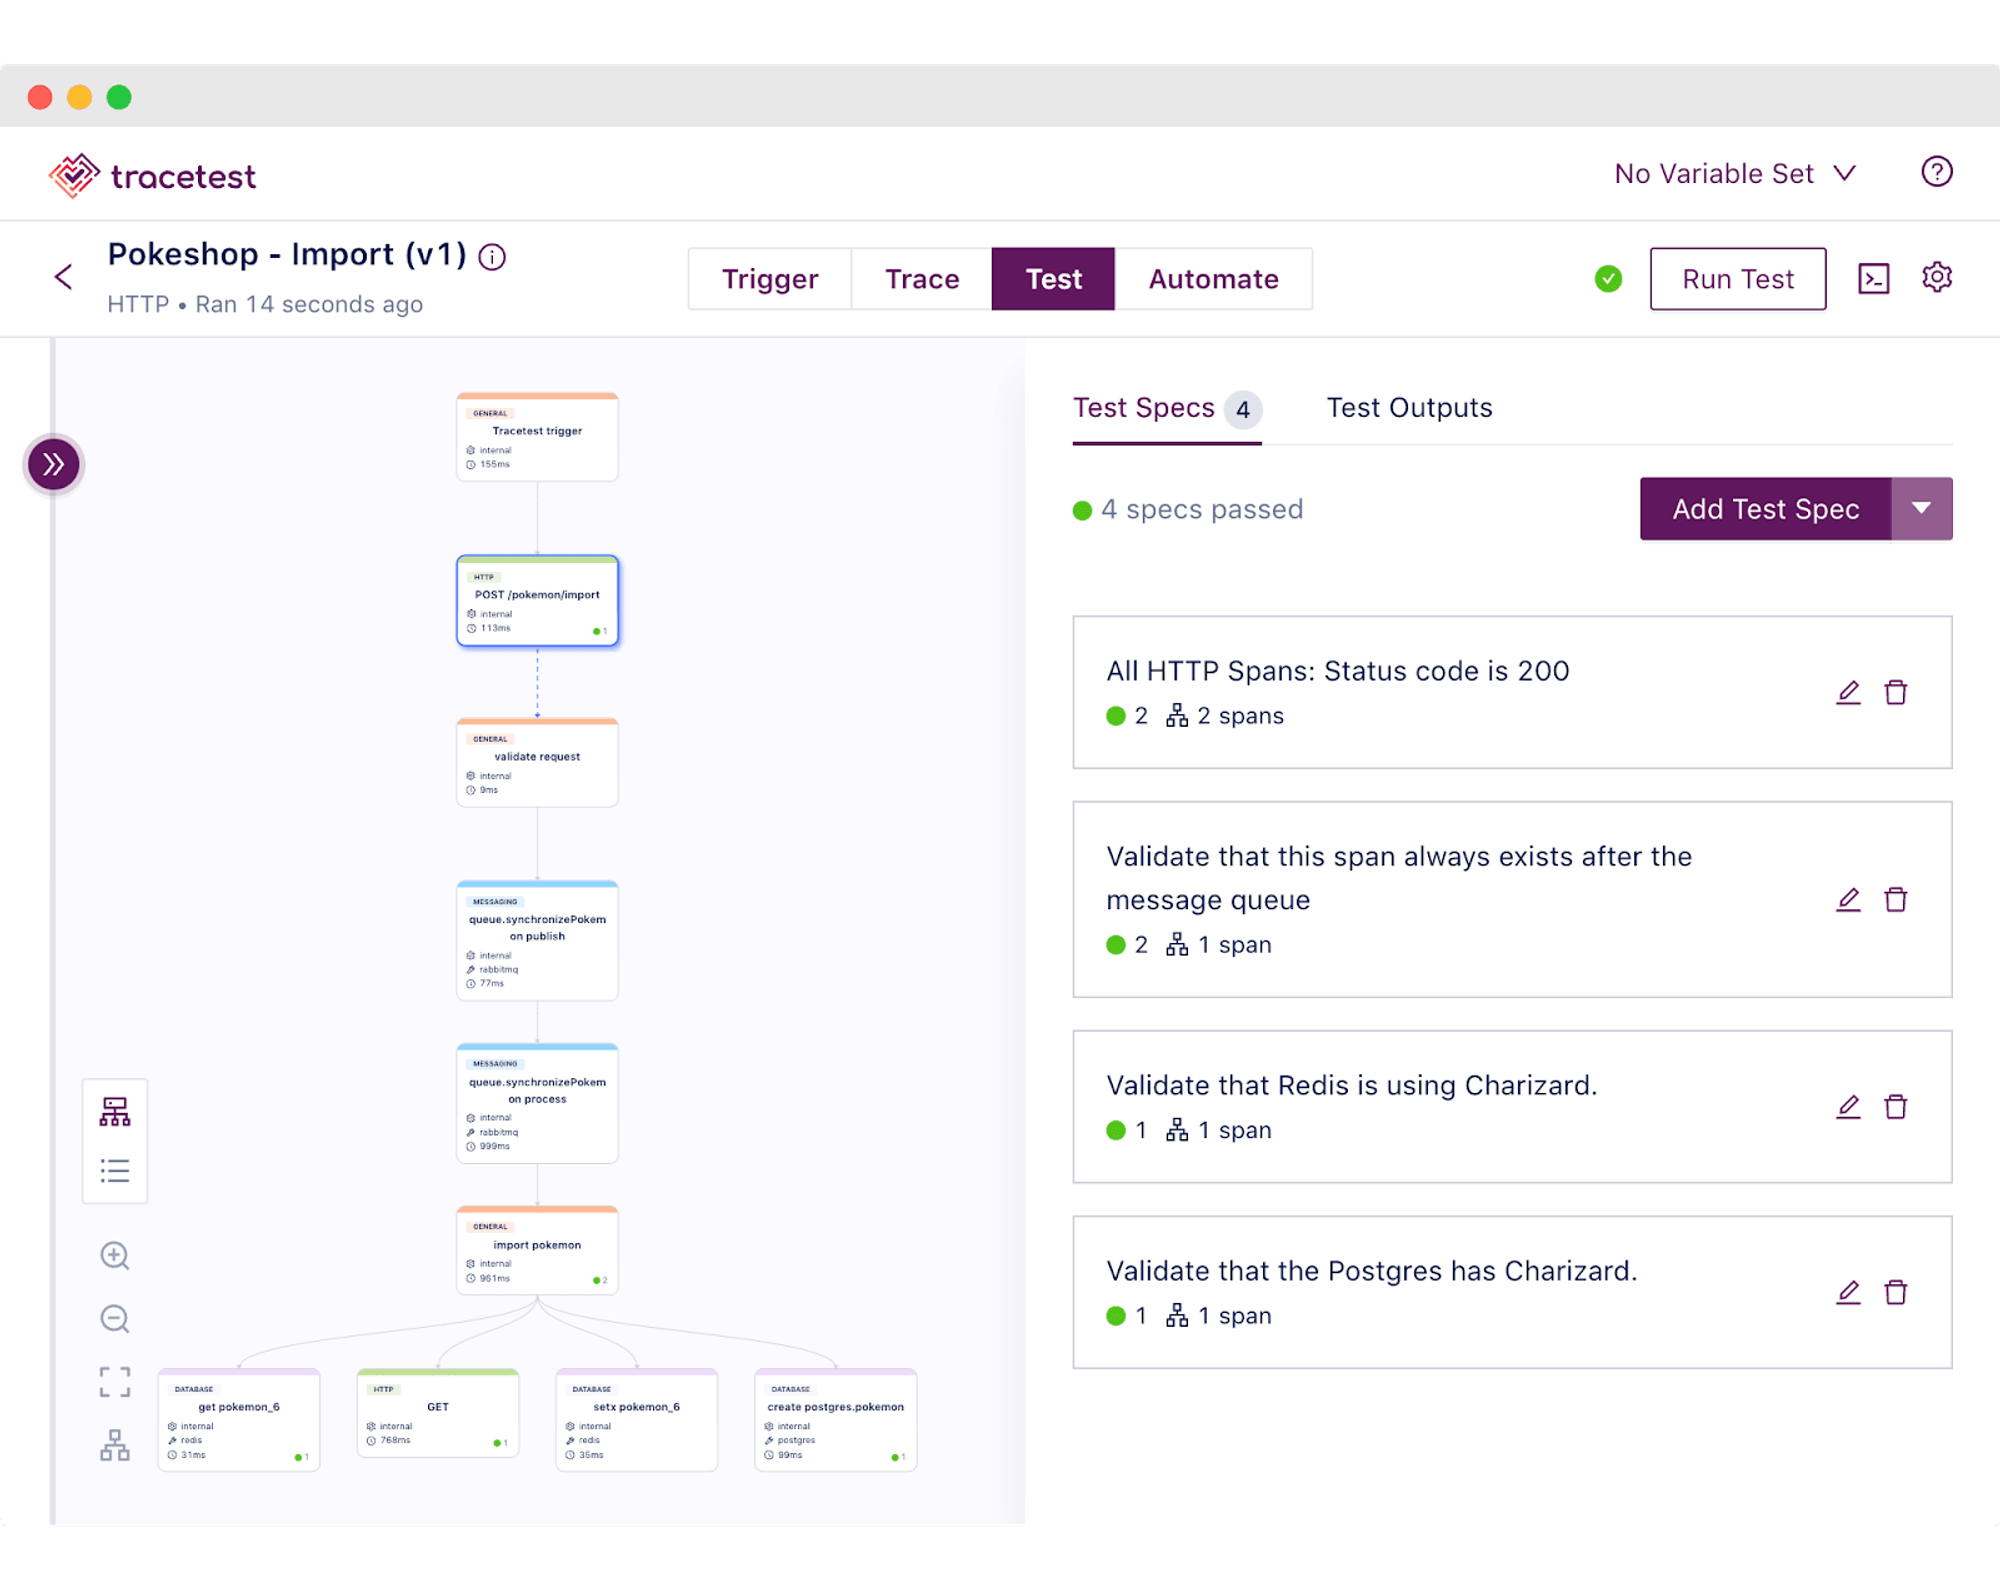
To create a test in Tracetest, start by clicking Create > Create New Test > HTTP Request > Next > Add a name for your test > Next > The URL field should be http://demo-api:8081/pokemon/import and a POST request, where the body should contain {"id":6} > Create and Run.
This will trigger the test and display a distributed trace in the Trace tab. You’ll also see the results of the Trace Analyzer. These results show rules and conventions to adhere to while writing code instrumentation.

Proceed to add a test spec to assert that all HTTP requests return status code 200. Click the Test tab and proceed to click the Add Test Spec button.
In the span selector, add this selector:
span[tracetest.span.type="http"]
It will select the HTTP spans.
In the assertion field, add:
attr: http.status_code = 200;
Save the test spec and publish the test.

If an HTTP span is returning anything other than a 200 status code it will be labeled in red. This is an example of a trace-based test that can assert against every single part of an HTTP transaction, including Kafka streams, and external API calls. (See image 2)
However, Tracetest cannot give you a historical overview of all test runs and distributed traces. Let's show how SigNoz makes it possible.
Monitor Trace-based Tests Over Time with SigNoz
Because you are using two pipelines in the OpenTelemetry Collector, all distributed traces generated will be stored in SigNoz. Additionally, if you configure the Tracetest server with Internal Telemetry, you will see the traces the Tracetest server generates in SigNoz. Using the example above, traces from the services in the Pokeshop API will be stored in SigNoz with a defined Service Name property, while the traces from Tracetest will be stored with the “tracetest” Service Name.
Data in the Tracetest service will give you insight into every test run. Start by running this query in the Tracetest service to filter all Tracetest test runs.

The distributed traces chart will be filtered and display performance over time.

From here, you can drill down into the specific trace to troubleshoot. Open the Tracetest trigger trace. Choose a trace that is slow. Once open, the trace waterfall within SigNoz can help you pinpoint exactly which span is causing an issue. (Shown in Image 4, above)
What's next?
Would you like to learn more about Tracetest and what it brings to the table? Check the docs and try it out today by downloading it today!
Also, please feel free to support SigNoz and Tracetest by giving both a star on GitHub. ⭐
