What is syslog monitoring - a quick introduction & steps to set it up
Syslog monitoring is a process of collecting, storing, and analyzing system log messages generated by devices on a network. These log messages contain information about the operation and status of devices, as well as any errors or issues that may have occurred.
Syslog monitoring is typically used to keep track of system and network events, detect security threats, and troubleshoot problems. It can be performed manually or through the use of a syslog monitoring tool.
In this blog, we will introduce SigNoz - an open source APM that you can use to collect and monitor syslogs.
Benefits of Syslog monitoring
Improved Security
Syslog monitoring can help detect and prevent security threats by alerting administrators to unusual activity or suspicious log messages. For example, if a device on the network is attempting to access unauthorized resources or is behaving in a way that is outside of the normal range of activity, syslog monitoring can alert the administrator to this activity.
Additionally, syslog monitoring can be used to detect and prevent security threats by analyzing log messages for patterns or indicators of potential attacks.
Enhanced network visibility
By collecting and analyzing log messages from all devices on the network, syslog monitoring can provide a comprehensive view of network activity and help administrators identify and resolve issues.
For example, syslog monitoring can help administrators identify devices that are experiencing problems or are generating a high volume of log messages, which could indicate an issue that needs to be addressed. It can also help administrators identify patterns of activity on the network, such as a sudden increase in traffic or a spike in errors, which could indicate a problem or a potential security threat.
Improved troubleshooting
Syslog monitoring can help administrators quickly locate and fix problems, as well as identify and fix the root cause of issues. It can help identify patterns of activity or error messages that may indicate a broader issue that needs to be addressed. For example, if multiple devices on the network are generating similar log messages, it may be a sign that there is a problem with a shared component or configuration.
Enhanced compliance
Syslog monitoring can help organizations meet regulatory requirements by collecting and storing log messages for later review. Many regulatory bodies, such as HIPAA, PCI DSS, and SOX, have specific requirements for the collection, storage, and analysis of log messages as a way to ensure the security and integrity of systems and networks.
By using syslog monitoring to collect and store log messages from all devices on the network, organizations can demonstrate compliance with these requirements by providing a record of all activity on the network.
Setting up Syslog monitoring
There are several steps involved in setting up syslog monitoring:
-
Determine the devices that need to be monitored: Identify all the devices on the network that generate log messages, including servers, routers, switches, firewalls, and other networking equipment.
-
Configure the devices to send log messages to a central location: Each device on the network will need to be configured to send log messages to a central location, such as a syslog server or a log analytics tool like SigNoz. This can usually be done through the device's configuration interface.
-
Set up a syslog server: A syslog server is a central location where log messages from all the devices on the network can be collected and stored. There are a variety of syslog servers available, both free and commercial, which can be installed on a dedicated machine or virtualized.
-
Configure the syslog server: The syslog server will need to be configured to receive log messages from the devices on the network. This may involve specifying which devices are allowed to send log messages, setting up rules for filtering and processing log messages, and configuring how log messages are stored and indexed.
-
Set up alerts and notifications: To ensure that administrators are alerted to important log messages in a timely manner, it is important to set up alerts and notifications. This may involve configuring the syslog server to send email or text message alerts when certain log messages are received, or using a separate monitoring tool to monitor the syslog server and trigger alerts when necessary.
Monitoring Syslogs with SigNoz
In production environments, you need to have a centralized logging system in order to effectively use logs for debugging and troubleshooting purposes. SigNoz, an open source APM provides log analytics as one of its features.
SigNoz is a full-stack open source APM that you can use as an alternative to Loki and Elasticsearch. SigNoz uses a columnar database ClickHouse to store logs, which is very efficient at ingesting and storing logs data. Columnar databases like ClickHouse are very effective in storing log data and making it available for analysis.
Getting started with SigNoz
SigNoz can be installed on macOS or Linux computers in just three steps by using a simple install script.
The install script automatically installs Docker Engine on Linux. However, on macOS, you must manually install Docker Engine before running the install script.
git clone -b main https://github.com/SigNoz/signoz.git
cd signoz/deploy/
./install.sh
You can visit our documentation for instructions on how to install SigNoz using Docker Swarm and Helm Charts.

Collecting syslogs with SigNoz
With SigNoz you can collect your syslogs logs and perform different queries on top of it.
In this example we will configure rsyslog to forward our system logs to tcp endpoint of otel-collector and use syslog receiver in otel-collector to receive and parse the logs.
Below are the steps to collect syslogs.
-
Modify the
docker-compose.yamlfile present insidedeploy/dockerto expose a port, in this case54527so that we can forward syslogs to this port.... otel-collector: image: signoz/signoz-otel-collector:0.88.11 command: ["--config=/etc/otel-collector-config.yaml"] volumes: - ./otel-collector-config.yaml:/etc/otel-collector-config.yaml ports: - "54527:54527" ... -
Add the syslog receiver to
otel-collector-config.yamlwhich is present insidedeploy/dockerreceivers: syslog: tcp: listen_address: "0.0.0.0:54527" protocol: rfc3164 location: UTC operators: - type: move from: attributes.message to: body ...Here we are collecting the logs and moving message from attributes to body using operators that are available. You can read more about operators here.
For more configurations that are available for syslog receiver please check here.
-
Next we will modify our pipeline inside
otel-collector-config.yamlto include the receiver we have created above.service: .... logs: receivers: [otlp, syslog] processors: [batch] exporters: [clickhouselogsexporter] -
Now we can restart the otel collector container so that new changes are applied and we can forward our logs to port
54527. -
Modify your
rsyslog.conffile present inside/etc/by runningsudo vim /etc/rsyslog.confand adding the this line at the end*.* action(type="omfwd" target="0.0.0.0" port="54527" protocol="tcp")For production use cases it is recommended to using something like
*.*  action(type="omfwd" target="0.0.0.0" port="54527" protocol="tcp"
        action.resumeRetryCount="10"
        queue.type="linkedList" queue.size="10000")
So that you have retires and queue in place to de-couple the sending from the other logging action.
The value of
targetmight vary depending on where SigNoz is deployed, since it is deployed on the same host I am using0.0.0.0for more help you can visit here. -
Now restart your rsyslog service by running
sudo systemctl restart rsyslog.service -
You can check the status of service by running
sudo systemctl status rsyslog.service -
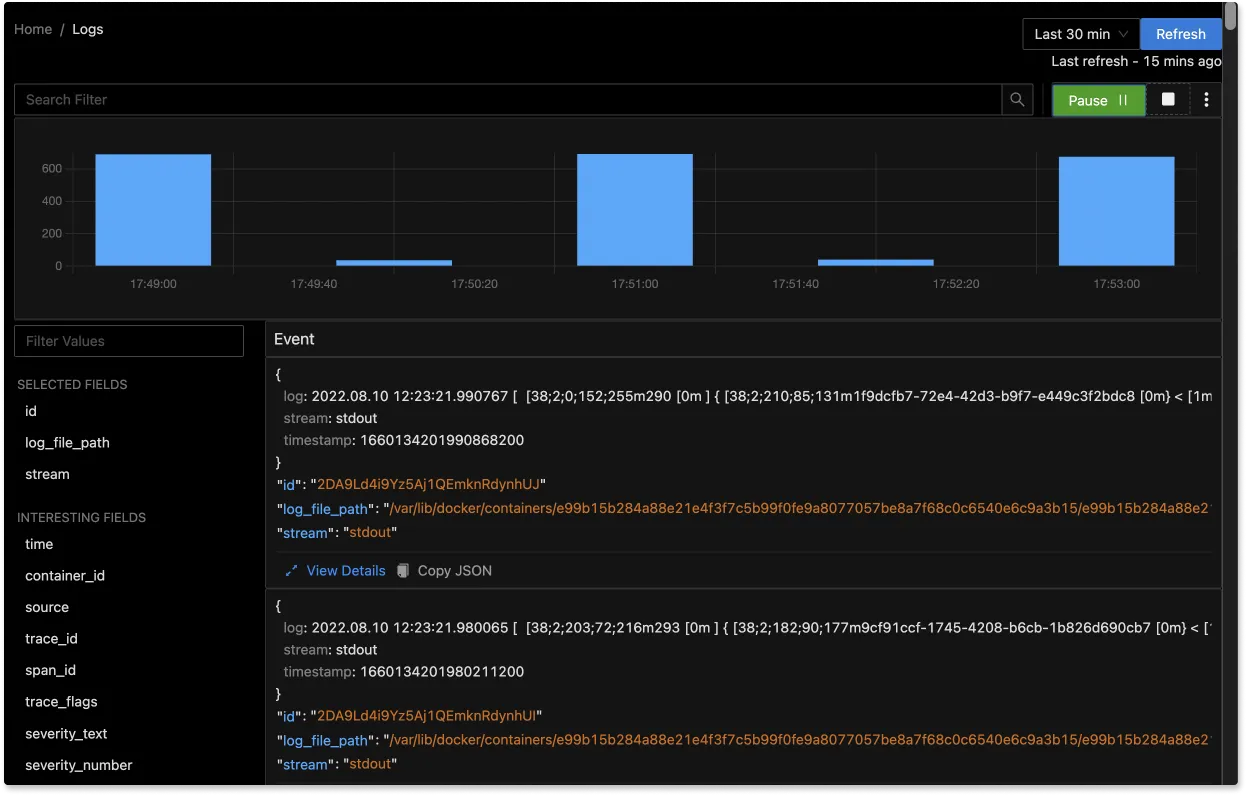
If there are no errors your logs will be visible on SigNoz UI.
The logs tab in SigNoz has advanced features like a log query builder, search across multiple fields, structured table view, JSON view, etc.
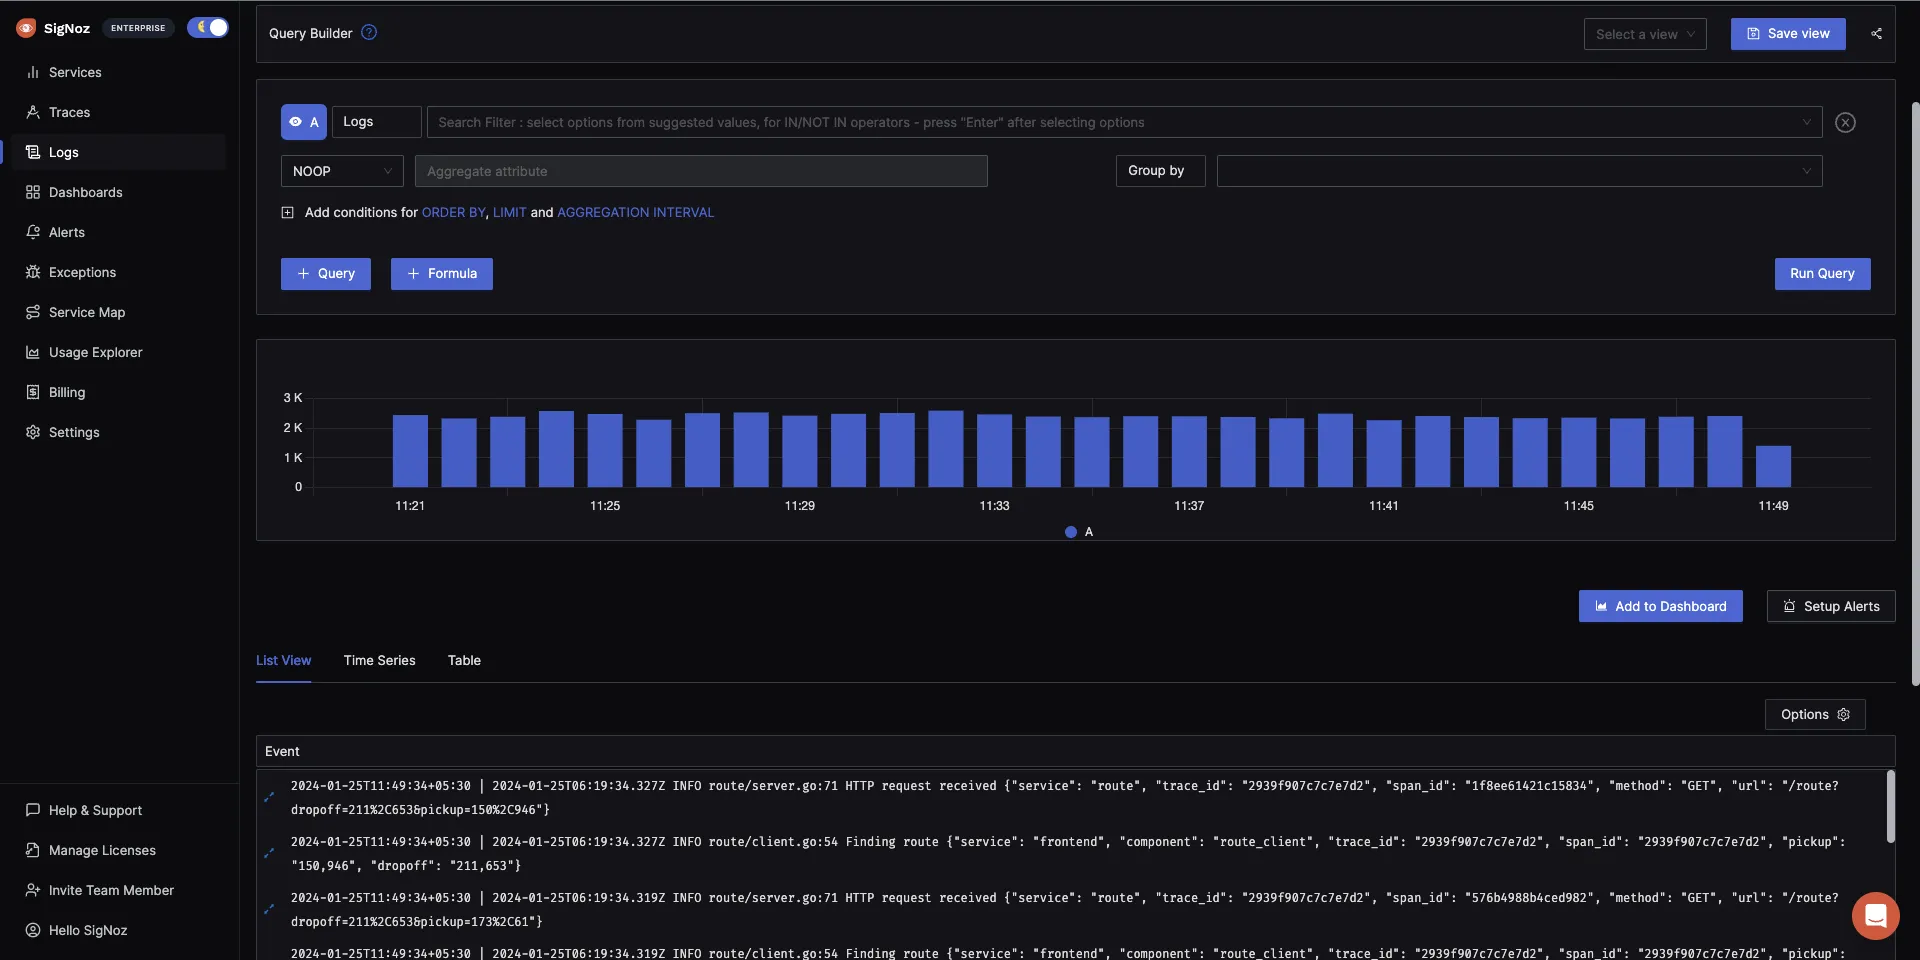
You can also view logs in real time with live tail logging.
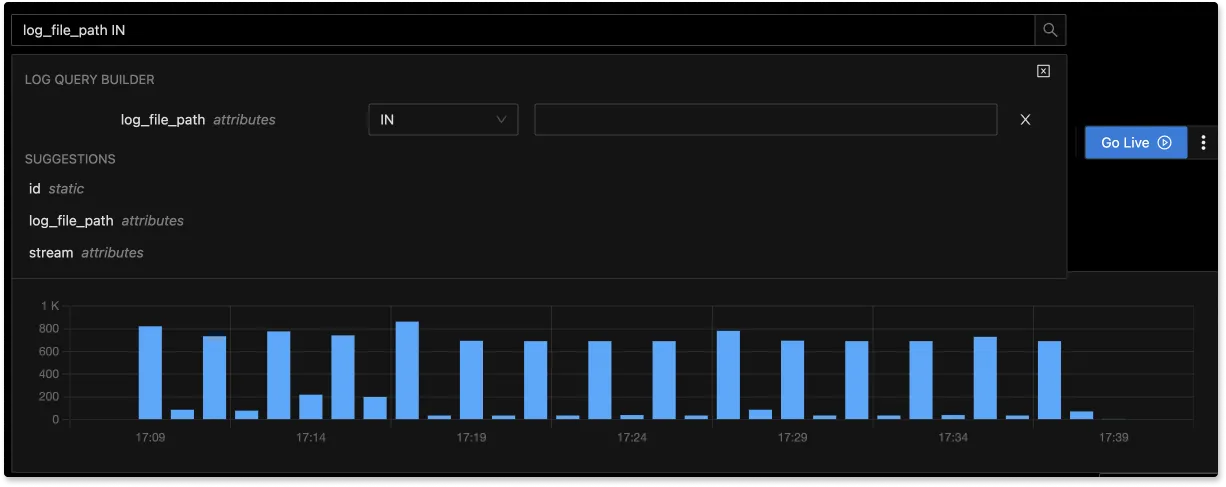
With advanced Log Query Builder, you can filter out logs quickly with a mix and match of fields.
Related Posts
