SigNoz Community Call - Using OpenTelemetry Collector Processor
Tune in to learn more about OpenTelemetry Collector processors and how you can use them effectively in SigNoz with Pranay, one of the the co-founders at SigNoz , and Nočnica Mellifera
Below is the recording and an edited transcript of the conversation.
Find the conversation transcript below.👇
Pranay: Nica, if anybody wants to introduce themselves maybe they can just do it.
Nica: Yeah, so if you have questions or pick things that are on your mind please feel free to drop that in the chat but if you want just to introduce yourself and say hello feel free to join with video or just audio.
Please feel free to submit any questions or thoughts you may have in the chat. If you would like to introduce yourself or say hello, please feel free to join the call with video or audio.
We do not all have the same access to high-quality lighting equipment as Nika, so please do not feel self-conscious if your setup is not as elaborate. I currently have seven lights set up in my office, which I built specifically for live streaming.
If you would like to say hello, please feel free to do so in the chat or by joining the call. We will take a few minutes for introductions, and then we will discuss the collector. I will save my humorous stories for after we have given everyone a chance to share their thoughts on the collector and my initial confusion.
Pranay: Yeah, those funny stories. Hey Yash thanks for joining in.
Yash: Yeah hi everyone!
Pranay: Hi, Yash. So do you want to quickly introduce yourself, just to see who all joined us?
Yash: Certainly, I can summarize my situation briefly. I am the founder of a SaaS business, and we have been considering using SigNoz. I will be candid in stating that I have not yet used it in production, but it is something that we are seriously considering.
Whether we will self-host or not is another decision that needs to be made, but I am currently in the process of learning about and evaluating tools for capturing metrics. We have a very complex SaaS with a lot of data to capture, so SigNoz has been on my radar for some time. I am happy to learn more.
Pranay: Thank you for joining us.
Yash: You're welcome.
Nica: That is splendid! I am currently writing a piece on decisions such as self-hosting observability and some of the considerations involved, so it is great that we are at that point.
Allow me to introduce myself, as I am a new face in this community. My name is Nica, and I use she/her pronouns, as you will see on my Zoom profile. I was previously at New Relic and then worked with a team called TelemetryHub, which was also working on open-source observability in the United States.
Throughout that time, I was observing the emergence of SigNoz and its thriving community. I was very excited, and when I was selected by SigNoz, I was thrilled.
I am very excited to join the community. I have been delving into Kubernetes observability, which is not what we will be discussing today, unless someone has specific questions about it. However, that is what I have been working on in the couple of weeks since I joined.
I recently spoke at the Open Source Summit North America about the collector and about engineering a good process. As a result, I have seen the full range of the OTel experience, from small three-person development shops that just need to know if their systems are up or down, to large organizations with hundreds of employees that need to coordinate a push to staging that takes half an hour. OpenTelemetry can help organizations at both ends of the spectrum.
Pranay: Yeah
Nica: I am deeply grateful to you all for coming out today. It is very kind of you to attend, especially since I know that at New Relic, community events did not always attract a large crowd.
Pranay: Yes, that is because open source projects tend to attract a very engaged and participatory community. You can expect to see a lot of people joining in the discussion and asking questions.
Nica: I am also very excited about the collaborative nature of open source development. In my previous roles, I often felt like I was working in a vacuum, developing products that were used by large teams but never heard from. It was like being the office coffee machine: people might love it or hate it, but they would never tell me either way.
But here, I can see people diving deep into the code and really understanding how it works. It's an amazing feeling.
Pranay: Yep
Nica: Shall we now delve into the collector? Pranay, could you please provide us with an overview of how you understand the collector, how you first came to interact with it, and what are some special things about using it with SigNoz?
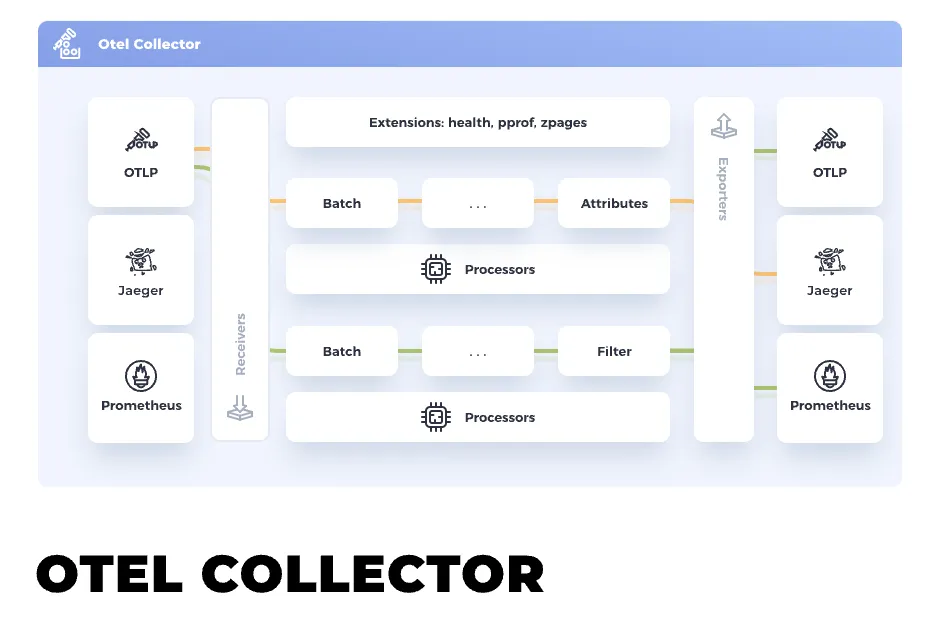
Pranay: Sure. I think the collector is the main orchestrator in OpenTelemetry. To make OpenTelemetry work, you need to send data to something, and then the OTel collector processes it and sends it to the backend, where the data is stored or visualization happens.
I first came to interact with the collector when I was working on a project where we needed to collect telemetry data from a variety of sources. We chose OpenTelemetry because it is a vendor-neutral, open-source project that is well-supported. The collector was easy to set up and use, and it allowed us to collect data from a variety of sources in a single place.
One of the special things about using the collector with SigNoz is that SigNoz provides a pre-built integration for the collector. This integration makes it easy to get started with SigNoz and collect telemetry data from your applications.
The collector has three main components:
- The receiver, which can be of different types and can listen to different sources, such as AWS Cloudwatch, Redis, and the OTel Community's set of receivers.
- The processor, which performs some processing on the received data.
- The exporters, which export the data to the next destination. For example, SigNoz has a SigNoz exporter that exports data to SigNoz.
In summary, the collector receives data from various sources, processes it, and then sends it to the next data store or frontend, where it can be used for various purposes.
Yes, that is all I understand about the Collector at this time. I believe the key component is the modular architecture, which allows for three stages, each with different components that can be used to connect the data pipeline.
Nica: Yes, I agree that is a key part. I think the two things that helped me understand OpenTelemetry early on were:
- Back in my corporate observability role, the Collector was the endpoint that gathered all the data, including the database. So I spent longer than I care to admit (two months) thinking that was what the Collector was.
- Then someone told me that the Collector runs on every single lambda that it's running. I was like, "Wait, no, that's wrong, how could that be?" They were talking about a stateless Collector, and I was like, "That's not possible!" But then I learned the correct thing.
I was also surprised to learn that since a collector is an entity that passes information through and can make semiotic decisions based on that information, one collector can be connected to another. Therefore, multiple collectors can be running inside of sub-clusters.
It is therefore reasonable to say that before hitting the data backend, we can have it hit yet another collector for some other final purpose, such as:
You have five subclusters and you want to calculate the average of all of them, because you have a very high-level metric that you want to see. In this case, it makes sense to say that we have one collector that is simply speaking directly to another.
Pranay: Yeah
Nica: So modular means you could be going anywhere, you could be doing many many possible things.
The modularity of OpenTelemetry is a key concept, and I find it particularly useful that OTLP can be used both as an input and an output protocol. Some common use cases for collectors include aggregation and rate limiting, which can help to reduce the amount of data that needs to be sent over the network.
Pranay: Yeah
Nica: In the past, before OpenTelemetry, I have seen implementations on mobile or at the Edge where large monolithic monitoring systems had nice batching and rate limiting, but the Edge implementations did not.
As a result, every time a transaction occurred, a packet was sent. This worked fine in staging and testing, but in production, the data rate was a complete nightmare. Have you ever wished that there was some kind of batching for the data that was sent?
Pranay: Yes, I think batching is one of the key use cases. It is one of the many times that people want to use it, and we essentially want people to send batched data. I think one thing you might also want to share is the different receivers in OpenTelemetry. I don't know if many people are aware of that.
Receivers are a key part of OpenTelemetry. They are responsible for receiving telemetry data from exporters and sending it to backends. There are a variety of receivers available, each with its own strengths and weaknesses. Some receivers are optimized for performance, while others are optimized for security or flexibility. The right receiver for a particular application will depend on the specific needs of that application.
Nica: Indeed, if you have a good image or list, please feel free to share it. As we discussed this morning, and in general, if you look at the matrix of what is supported in the different language projects for OpenTelemetry, you will see that logs are not listed as ready in any of them.
This may lead you to believe that OpenTelemetry is not ready for prime time, as logs are essential for observability. However, we are already exporting logs, and we are not going to manually load them into the console to view them. This is part of the real power of the collector, which allows us to ingest logs that are already being exported.
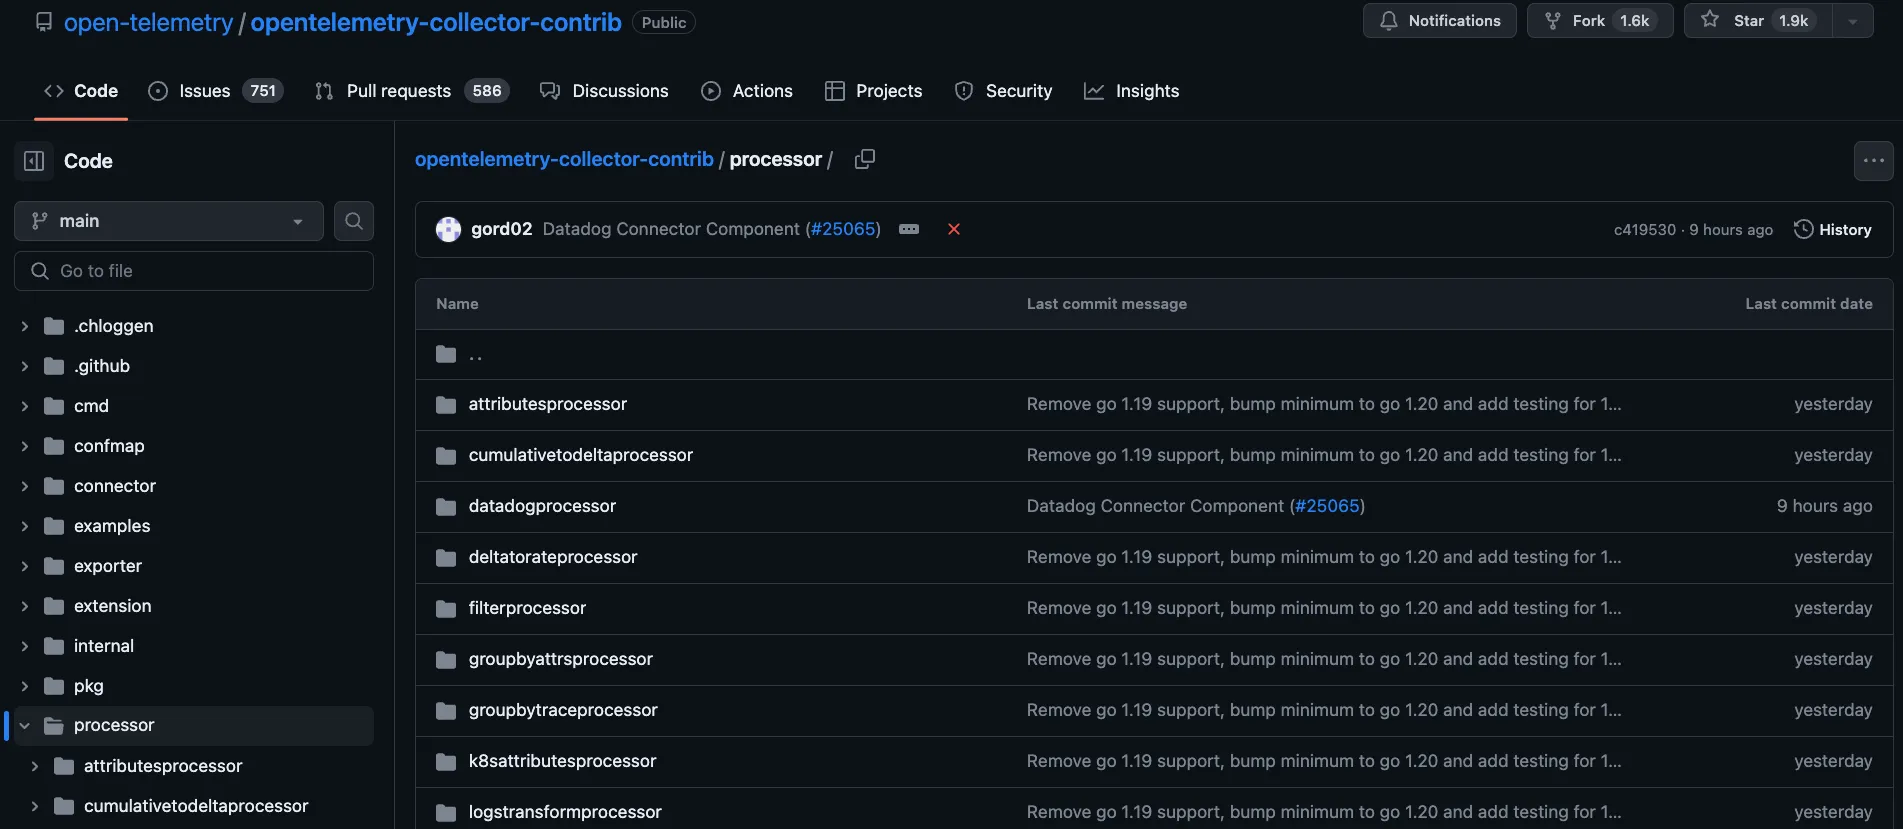
Pranay: So if you go to this OpenTelemetry Collector Contrib repo, this is the place where if anybody who builds a receiver or an exporter, can upstream it here and then anybody in the community can use it. So let's start with the receiver, if you see, there are like lots of receivers.
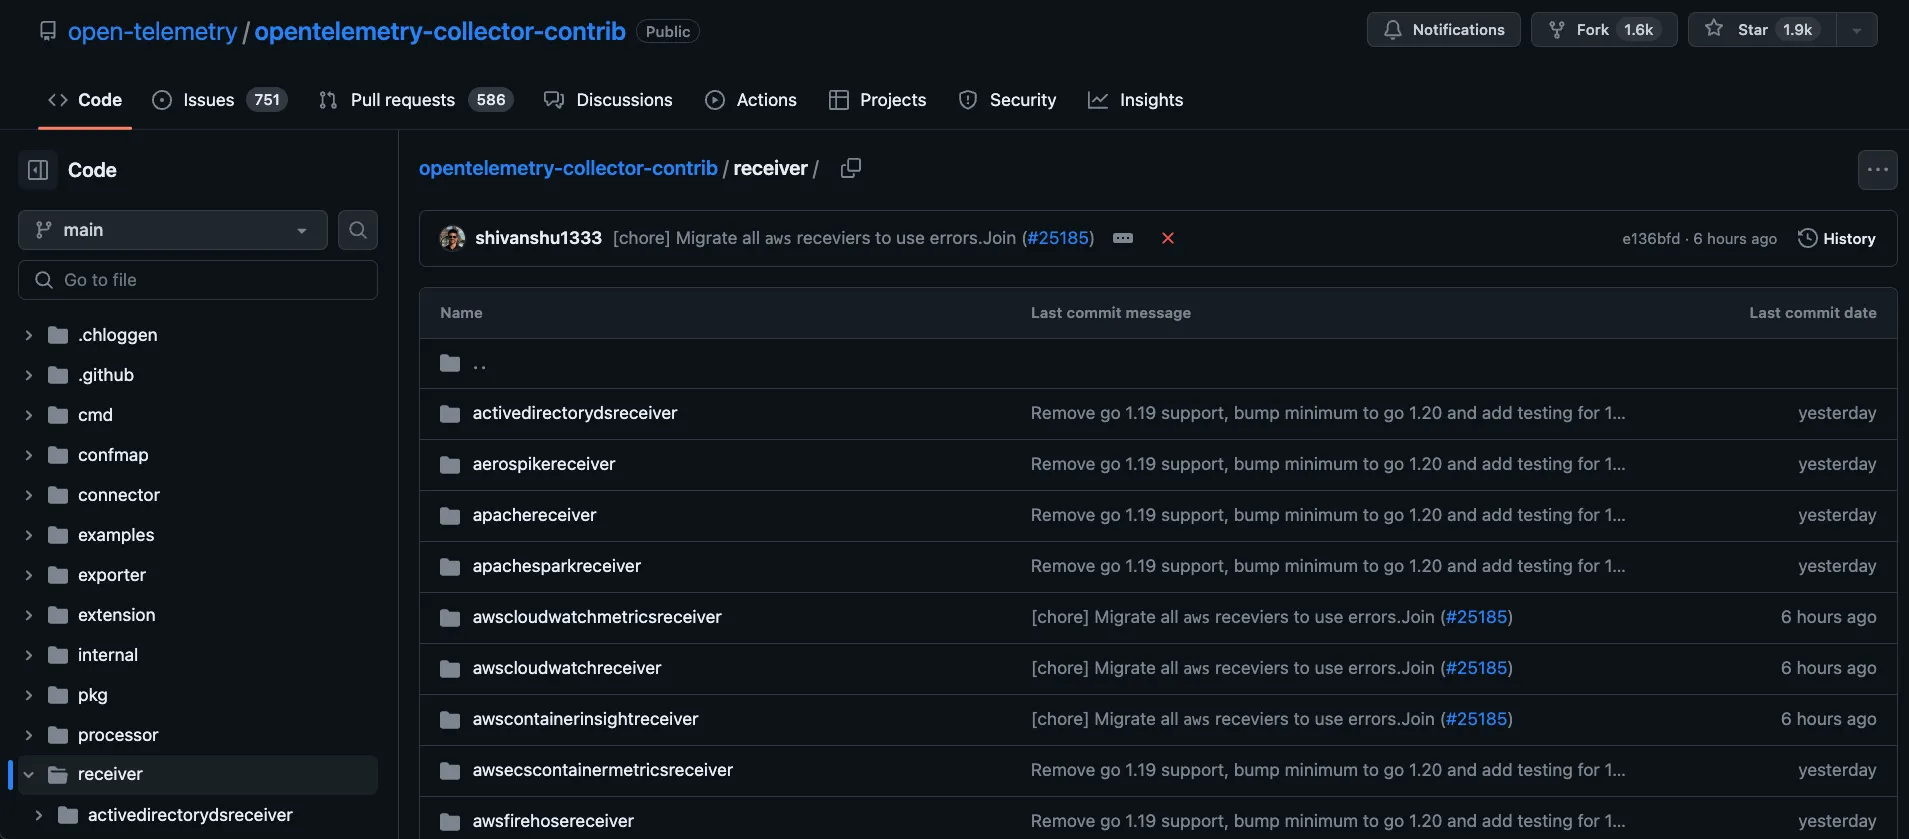
OpenTelemetry receivers are used to collect data from a variety of sources, including AWS X-Ray, Azure Event Hubs, file systems, host metrics, JMX, and Kafka. This modularity allows users to easily collect data from the systems they are using. For example, if a user has a MongoDB implementation, they can simply enable the MongoDB receiver in the OpenTelemetry collector to start collecting data from MongoDB.
Once data has been collected, it can be processed using processors. Processors can be used to transform, filter, or enrich data. For example, a processor could be used to convert data from one format to another, or to remove duplicate data.
The final step is to export the data to a storage system. OpenTelemetry supports a variety of storage systems, including Prometheus, Elasticsearch, and InfluxDB.
The OpenTelemetry data model is designed to be flexible and extensible. It allows users to collect data from a variety of sources, process it as needed, and export it to a variety of storage systems.
Indeed. In that case, you would need to perform attributes processing. One way to do this is with the Kubernetes attributes processor. We use this frequently when we have different attributes being sent and we want to transform those attributes into something else. Another option is the log transform receive processor, which can be used when you are receiving logs in a certain format and you want to transform them into something else.
Nica: This is a critical section, and I don't mean to just skim over it. Both the logs and metrics transform are essential for a few reasons, most notably for filtering out personally identifiable information (PII) data.
You'll inevitably realize that some critical personal information is being accidentally monitored in a metric name or something, so you want to make sure you're familiar with that at a basic level right from the start.
Pranay: Yes, and one key thing that is possible through processes is sampling. So, for organizations that are sending a lot of data, especially for traces, OpenTelemetry has something called Tail Sampling Processor, Probabilistic Sampler Processor, which helps you reduce the amount of data that gets ingested into your data stores.
So people can use this to save their costs and store what is important to them rather than storing everything.
Nica: Tail sampling is a powerful tool for traces. I have not implemented it myself, but I have pointed people to the CNCF project where they can find resources on how to use it. I know that many people have had success with it.
Tail sampling allows you to send only a subset of traces, rather than all of them. This can be useful if you do not want to send traces for every single thing that you do, or for every user. You can also use tail sampling to send only traces for users who are more important, or who have more trading cards on their account.
If your collector is on your network, tail sampling can be even more effective, as you will only be sending traces that you are interested in. This can save you bandwidth and storage space.
Pranay: Yes, and to expand on that, one use case I see for database sampling, especially for business-to-business (B2B) companies, is that they want to sample based on particular customers. If you're a business with different customers, and you just do probabilistic sampling or head-based sampling, you don't know which customer will be sampled how much.
However, with database sampling, you can specify the customer as the ID and then sample 20% or 30% of each customer's data. This way, you know that you're getting a certain amount of data for each customer. This is a very powerful feature, and we can do a session on sampling itself at another time.
Nica: Yes, we can plan two sessions now, one on Kubernetes monitoring and one on sampling.
Pranay: The first piece is the receiver, the second is the processor, and the third piece is the exporter, which allows you to export the data to different places. You have the data, you have processed it, and then you can export it to different places.
There is a ClickHouse exporter, you can expose it to ClickHouse, and then there are different vendors where you can export it. We also have SigNoz as an exporter, but it is not yet upstreamed. You can export to Prometheus, etc.
These are the data syncs that store the data that we received, processed, and then want to export later.
Nica: Indeed, this is one of the key considerations for large organizations: the ability to avoid vendor lock-in. Even if you're not planning to switch providers, adopting OpenTelemetry makes it easier to switch exporters or send data to a different destination in the future.
Pranay: Yes, let's hear from the audience. Has anyone tried implementing OpenTelemetry and encountered any issues?
Nica: If you have any questions about using the collector or have had any unexpected experiences, I'd be happy to discuss them. But I don't want to spend too much time on sampling, as I think that's a separate topic. If anyone else has questions, please feel free to speak up.
Yash RV: I have a question. I was reading about OpenTelemetry and the collector, and I came across the term "service discovery." Could you please explain what that is?
Nica: Service Discovery allows you to automatically add new services to your map when they start operating and report metrics to the collector endpoint. There are many ways to configure this, such as including it as part of the resources available in a container. This allows you to instrument automatically and discover new service names to report.
Pranay: To make this more concrete, service discovery can be done in many ways. For example, in Kubernetes, you can discover different services based on the metrics you see.
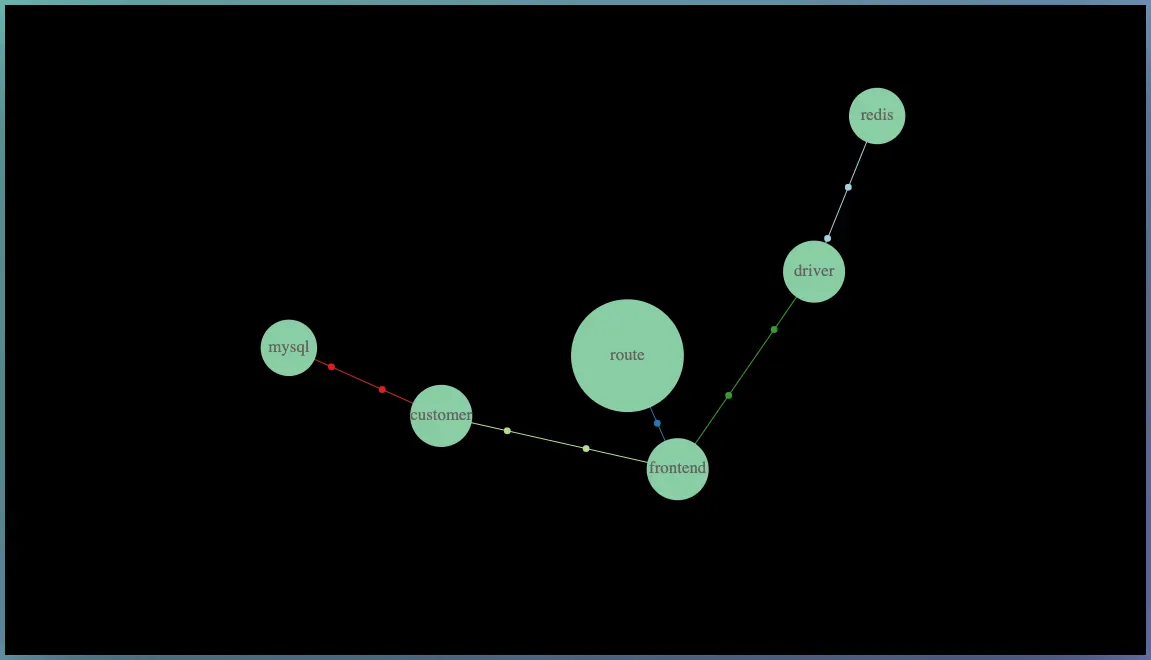
Another way to accomplish this is through tracing. For example, in this example, we are creating a service map for your infrastructure. If you have different services that are communicating with each other, we use tracing data to extract the knowledge of which services are talking to which other services.
We then use this data to provide you with a bird's eye view of your infrastructure's structure, including details such as the speed of transaction volume between different services and the health of each service. In the example, the error rate is zero for the green service, but it is 18% for the red service.
This information can help you focus your attention on areas that need improvement and understand how your services are connected.
Yash RV: Thank you.
Nica: Service discovery is an essential tool because, as I have observed in my work with observability tools since before the term was coined, there is a dirty secret about trace data: while metrics data is often accessed at least 50% of the time, even if only in aggregated form, trace data is almost never viewed.
In fact, the percentage of traces that are never viewed is so low that it is comparable to the percentage of helium in the solar system.
In other words, trace data is a valuable resource that is often underutilized. This is a missed opportunity, as trace data can provide valuable insights into the performance of complex systems. By making trace data more accessible and easier to use, we can help organizations to better understand and improve their systems.
If one considers individual traces, such as "Hey, the trace of this transaction, you have some rate, maybe you're sending 25 traces a cycle, and then when you have an outage, you go flip through 10-15 traces," then out of the whole day of maybe thousands of traces sent during a problem, one will only look at a few of them.
What was interesting here, and what we found back in the open tracing days, was that people wanted a map. We were explaining to people, "Hey, here's how you track all these spans and the individual time chunks, and maybe even the individual parameters on each of these spans," and people would say, "Yeah, here's what I want."
You hear this phrase over and over again: "Just show me which services got hit by this request. That's all I want. I don't care about what happened in each service. I just want to know which service got hit."
The reality of microservice architecture is that there's just there's a lot of services running, a whole lot of services running and that leads to a feeling of "I do not know which services are even affected by this" so you get a call and you hear "Hey service 21A is down and someone asks well can users still check out on the e-commerce site with service 21A down" and the answer is always these days "I don't know".
You wish you could easily see if a specific action, like a checkout, is being processed by a particular service, for example, service 21A. Many people are more interested in knowing this rather than the intricate details of a trace.
Pranay: Yes, it's like you're not directly looking at a single trace, but you're using a summarized view to understand what's happening. Instead of digging into trace details, you might use a service map to see how things connect. Even though you're not looking at one specific trace, you're creating performance metrics like P99 and APM by using aggregated information.
In a way, you're utilizing traces, but not examining each one. Instead, you're drawing insights from the summarized information.
Nica: This example is a bit outdated because when open tracing started, it didn't effectively label spans. You would see spans, but couldn't easily determine their normal duration, especially in the early implementation days.
This is why it was argued that this aspect was crucial. People wouldn't go through individual traces in detail. But if you could combine data to understand how long spans usually take, that would be very helpful. Also, the focus was on how this could improve a service map and help discover which nodes are being used in the network.
Pranay: Alright, we're almost done.
Nica: We plan to continue these discussions every two weeks for the next while. If you have questions, please reach out on the community Slack channel. Starting next Monday, we'll initiate threads for questions related to our chosen theme.
It's amazing to see everyone participating, and I'm really excited. I couldn't manage it this time, but next time we'll recognize the most helpful community members with awards for assisting others.
I've noticed this on Slack, and we'll be keeping track. There's even talk about potentially creating a leaderboard on the website to showcase those who are exceptionally helpful to others.
Pranay: Yes, I'll share the link to our Slack group here. Feel free to ask any questions about SigNoz or if you're trying it out and need assistance with OpenTelemetry. We've been working with OpenTelemetry for the past two years, so if you're dealing with specific challenges, just reach out, and we'll be happy to support you.
Nica: And if you're watching this video, a little later than Monday, July 10th, do look down below in the description you'll see the links are attached there both to a couple of the points we're talking about the documentation and to join us on Slack enter RSVP for next time.
Pranay: Yeah, Okay
Nica: Thanks so much everybody we're gonna call it there. Thank you so much for joining.
Pranay: Yeah, thanks.
Thank you for taking out the time to read this transcript :) If you have any feedback or want any changes to the format, please create an issue
Feel free to join our Slack community and say hi! 👋