Blip provides self-service subscription-based digital ad space across 1000’s of digital billboards in the US and Canada. Many small and medium-sized businesses use Blip services to reach their audience anytime, anywhere they want.
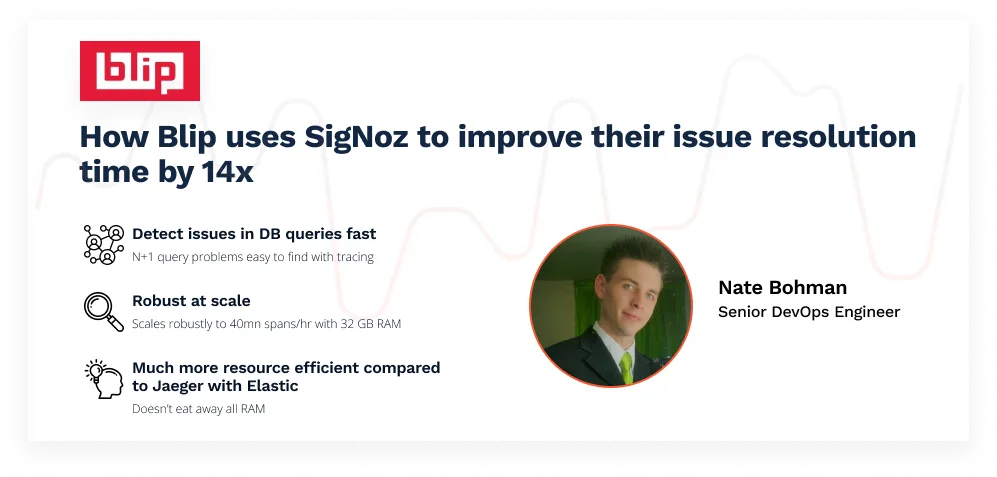
Blip used SigNoz to improve their issue resolution time by 14x. We sat down with Nate Bohman, Senior DevOps Engineer at Blip, to understand how they are using SigNoz to improve their observability. Some of the key points that the team liked about SigNoz:
- Helped detect issues in DB queries quickly
- Scaled robustly to 40mn spans/hr with 32 GB RAM
- Much more resource efficient compared to Jaeger + Elastic combo
- By tracing each request with distributed tracing, the team ensured they figured slow response times and detected issues quickly in production.
Read on to find out how Blip uses SigNoz as their observability backend.
Tell us a bit about yourself.
My name is Nate, and I work as a senior DevOps engineer at Blip. I love everything technical and love to build things.
At Blip, I do a lot of integration with various platforms and services. For monitoring, we use different services in different places to keep an eye on what’s going on and understand how our environments respond. We also don’t want to slow down things with too much monitoring but have enough to get insights into application performance.
So, my primary goal is to try and optimize the application and keep our developers informed about where the application is having issues. It’s also my job to help them fix the issue.
What were the business problems you're trying to solve with SigNoz?
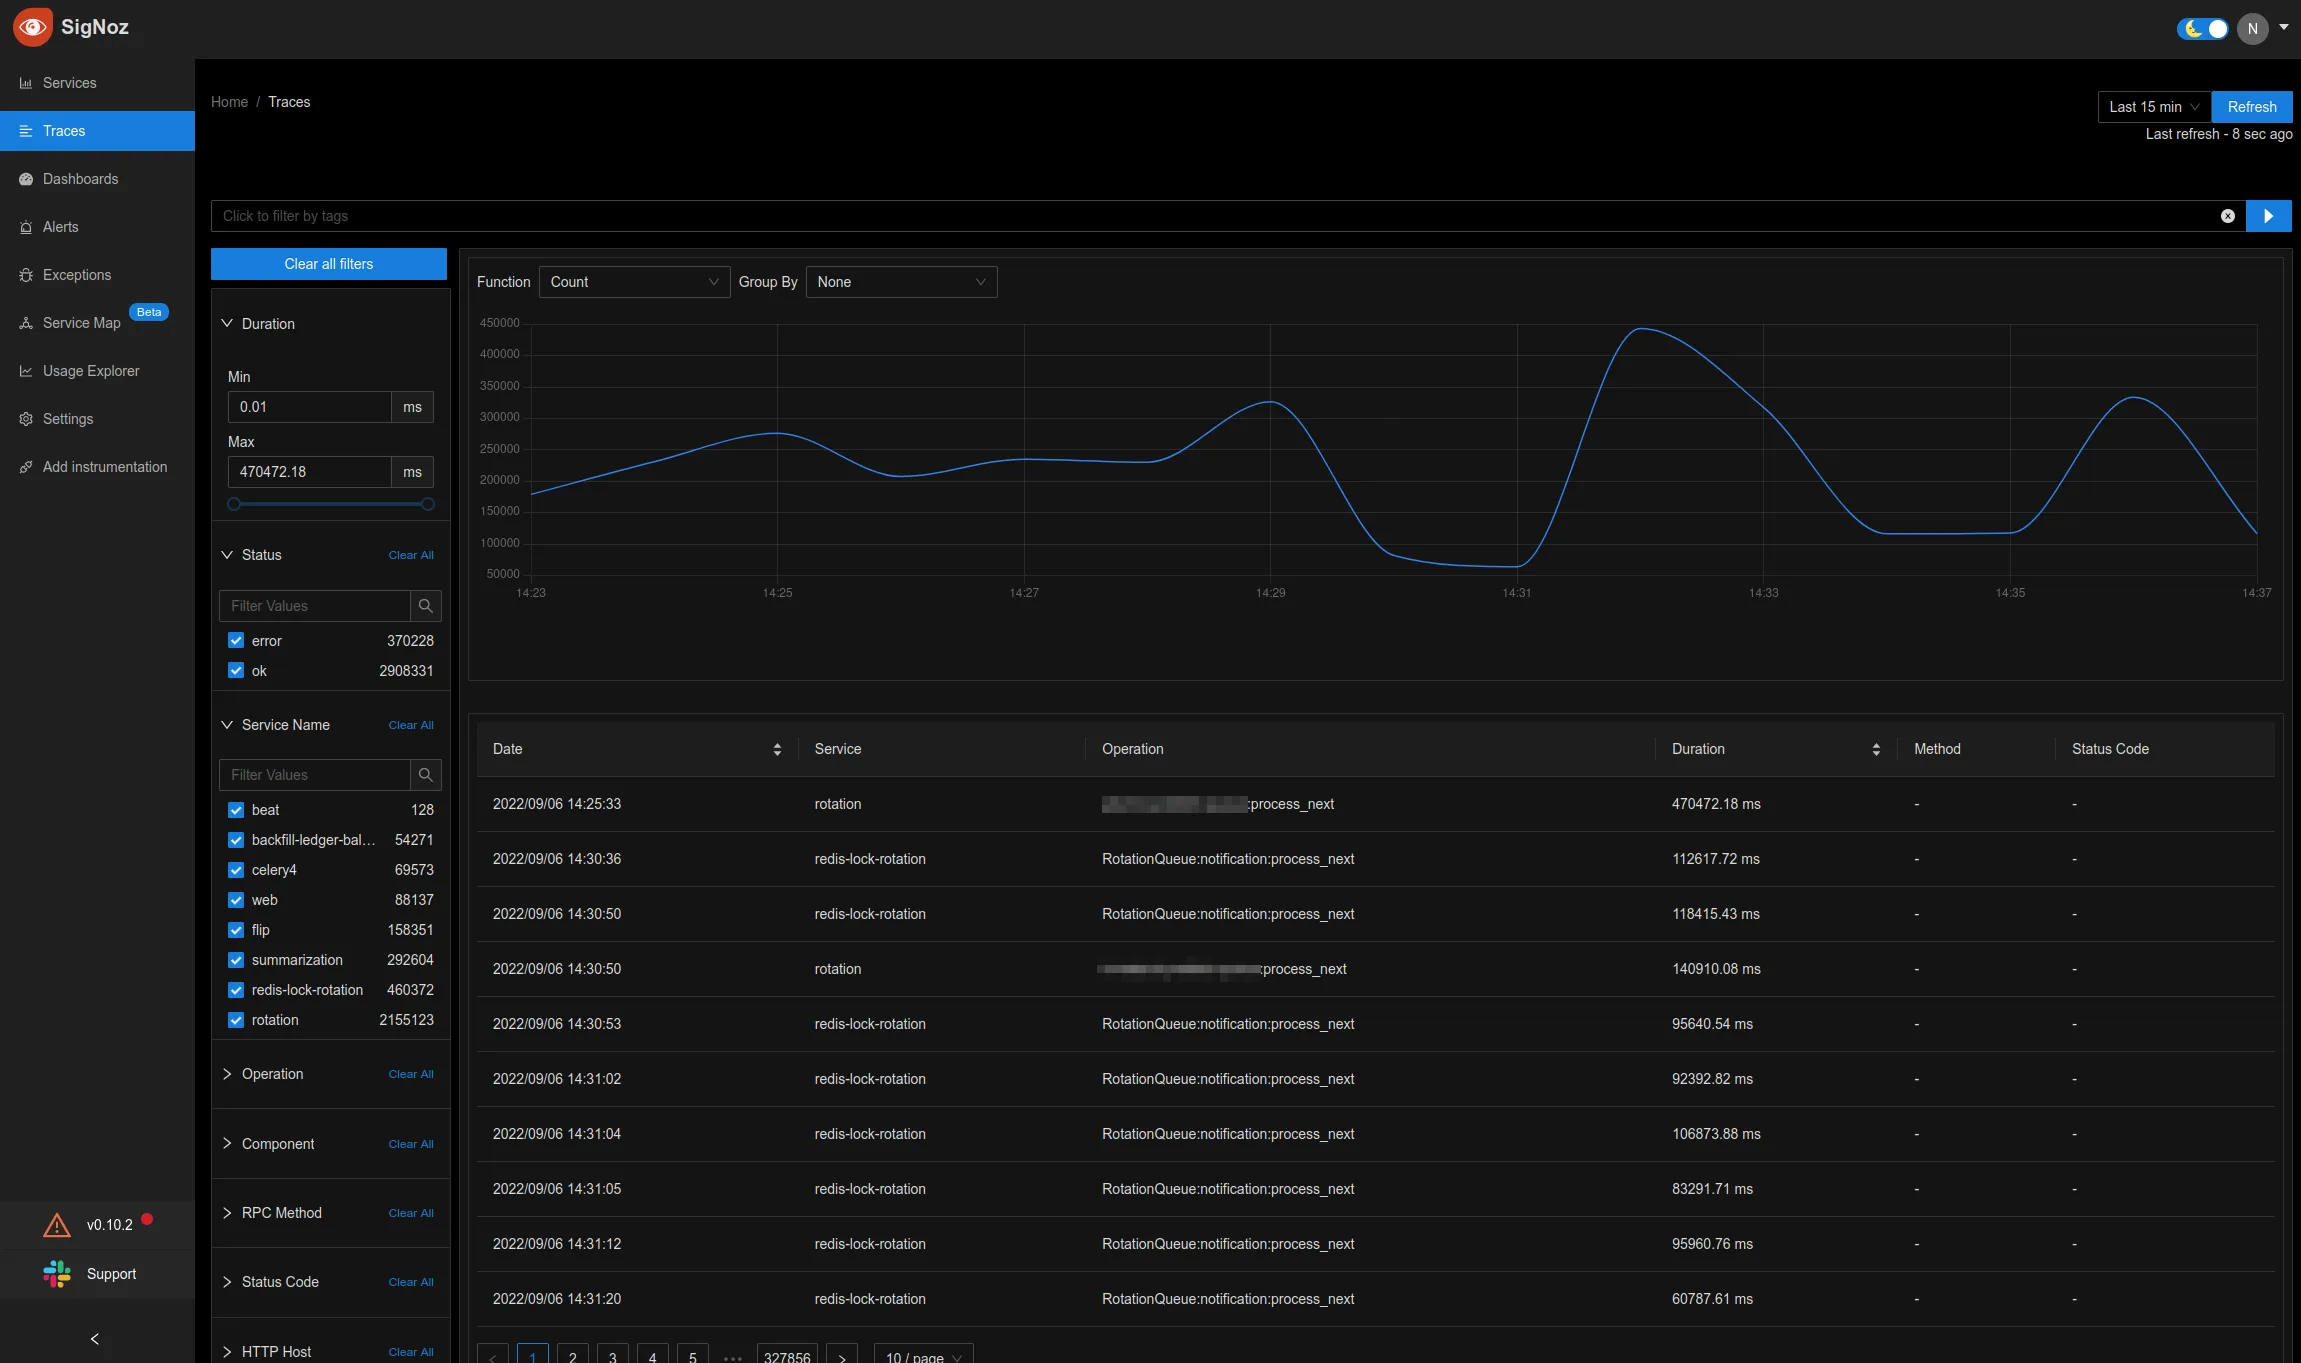
Yes, absolutely! With SigNoz, we are currently doing about 13 million to 40 million spans per hour which varies with the time of the day. The number goes up during the day quite a bit, up to ~40mn spans/hr, and it's like 13 million spans or so during the night. We have primarily instrumented our backend services.
We use SigNoz to trace requests step by step, and that kind of stuff is invaluable. Before SigNoz, we tried Jaeger to try and trace through the code. We ran Jaeger with Elasticsearch.
Elastic search kept wanting to die, like, all the time. It ran into all sorts of issues when we tried to scale it. Running a tine Elasticsearch cluster is perfect. It has no issues at all. But scaling that up takes an entire team's effort just to run it. And I, as one person, is not capable of doing that.
SigNoz choosing ClickHouse is a very good idea because I had no issues other than when I gave it very few resources at the beginning. So here's a tip to anyone else coming down the line, make sure you give it enough resources by default. But other than that, it's been like, rock solid.
I've had no issues with it. It showed me exactly what's going on, how the code is flowing, where it's going, what logic it's using to determine what response it will give, and everything else going along with that.
Can you share any specific business use cases you solved with SigNoz?
A few months ago, before I implemented SigNoz, we were having an issue. We had an endpoint that we called checklist.
And it's a checklist to ensure an ad is ready to plan a sign. If an ad has to go through, it has to get approved. It has to have the right tags on it. It has to be approved by the sign owner.
Going through all the checklists made it a very slow endpoint. And we knew it was slow, given the response times from the router, depending on what campaign it was, what organization it was that was trying to play those things.
But what happened behind the scenes was nebulous. For example, we knew it was taking 20 seconds to get rendered, but we had no idea of what exactly happened during those 20 seconds.
Logs did not solve the problem.
You can try and run a couple of queries to check what queries are being run and what's going on. But correlating that to a specific endpoint is next to impossible with logs. We had an outage that occurred because of that. The endpoint started getting so large and running so many queries that it took down the website for everyone, not just the person accessing that particular endpoint.
I spent about two weeks diagnosing the cause and then another two weeks fixing it because we didn't have any distributed tracing in place. We were trying to do this by adding logs to different parts. But we were not getting a sense of how a request flowed through different parts.
I had to add a log statement and then run a query. Then add another log statement, and run a query to see where the request would go. This is how I was trying to reproduce it.
Many a time staging environment doesn’t reflect issues that come up in production.
The staging environment doesn't have the same data as the production environment, and it's not nearly as full-featured. So when we were trying to run queries in staging, the request was completed in seconds. But when we ran it in production, we were suddenly getting these timings out, taking down the whole website and the entire back end.
So we had to go through it bit by bit, trying to figure out the cause. Can we reproduce this in testing? Can we replicate this in a staging environment? Can we do anything else like that? And it was just a couple of tedious weeks of sitting there and digging through.
It was awful. And so I did finally fix it. So we got that push, and now the backend has no issues with the checklist stuff.
But now we know how to avoid such things. For example, an endpoint came up just the other day, and with SigNoz in place, it took me just an hour to figure out why, how, and exactly what was going wrong.
N+1 query issue.
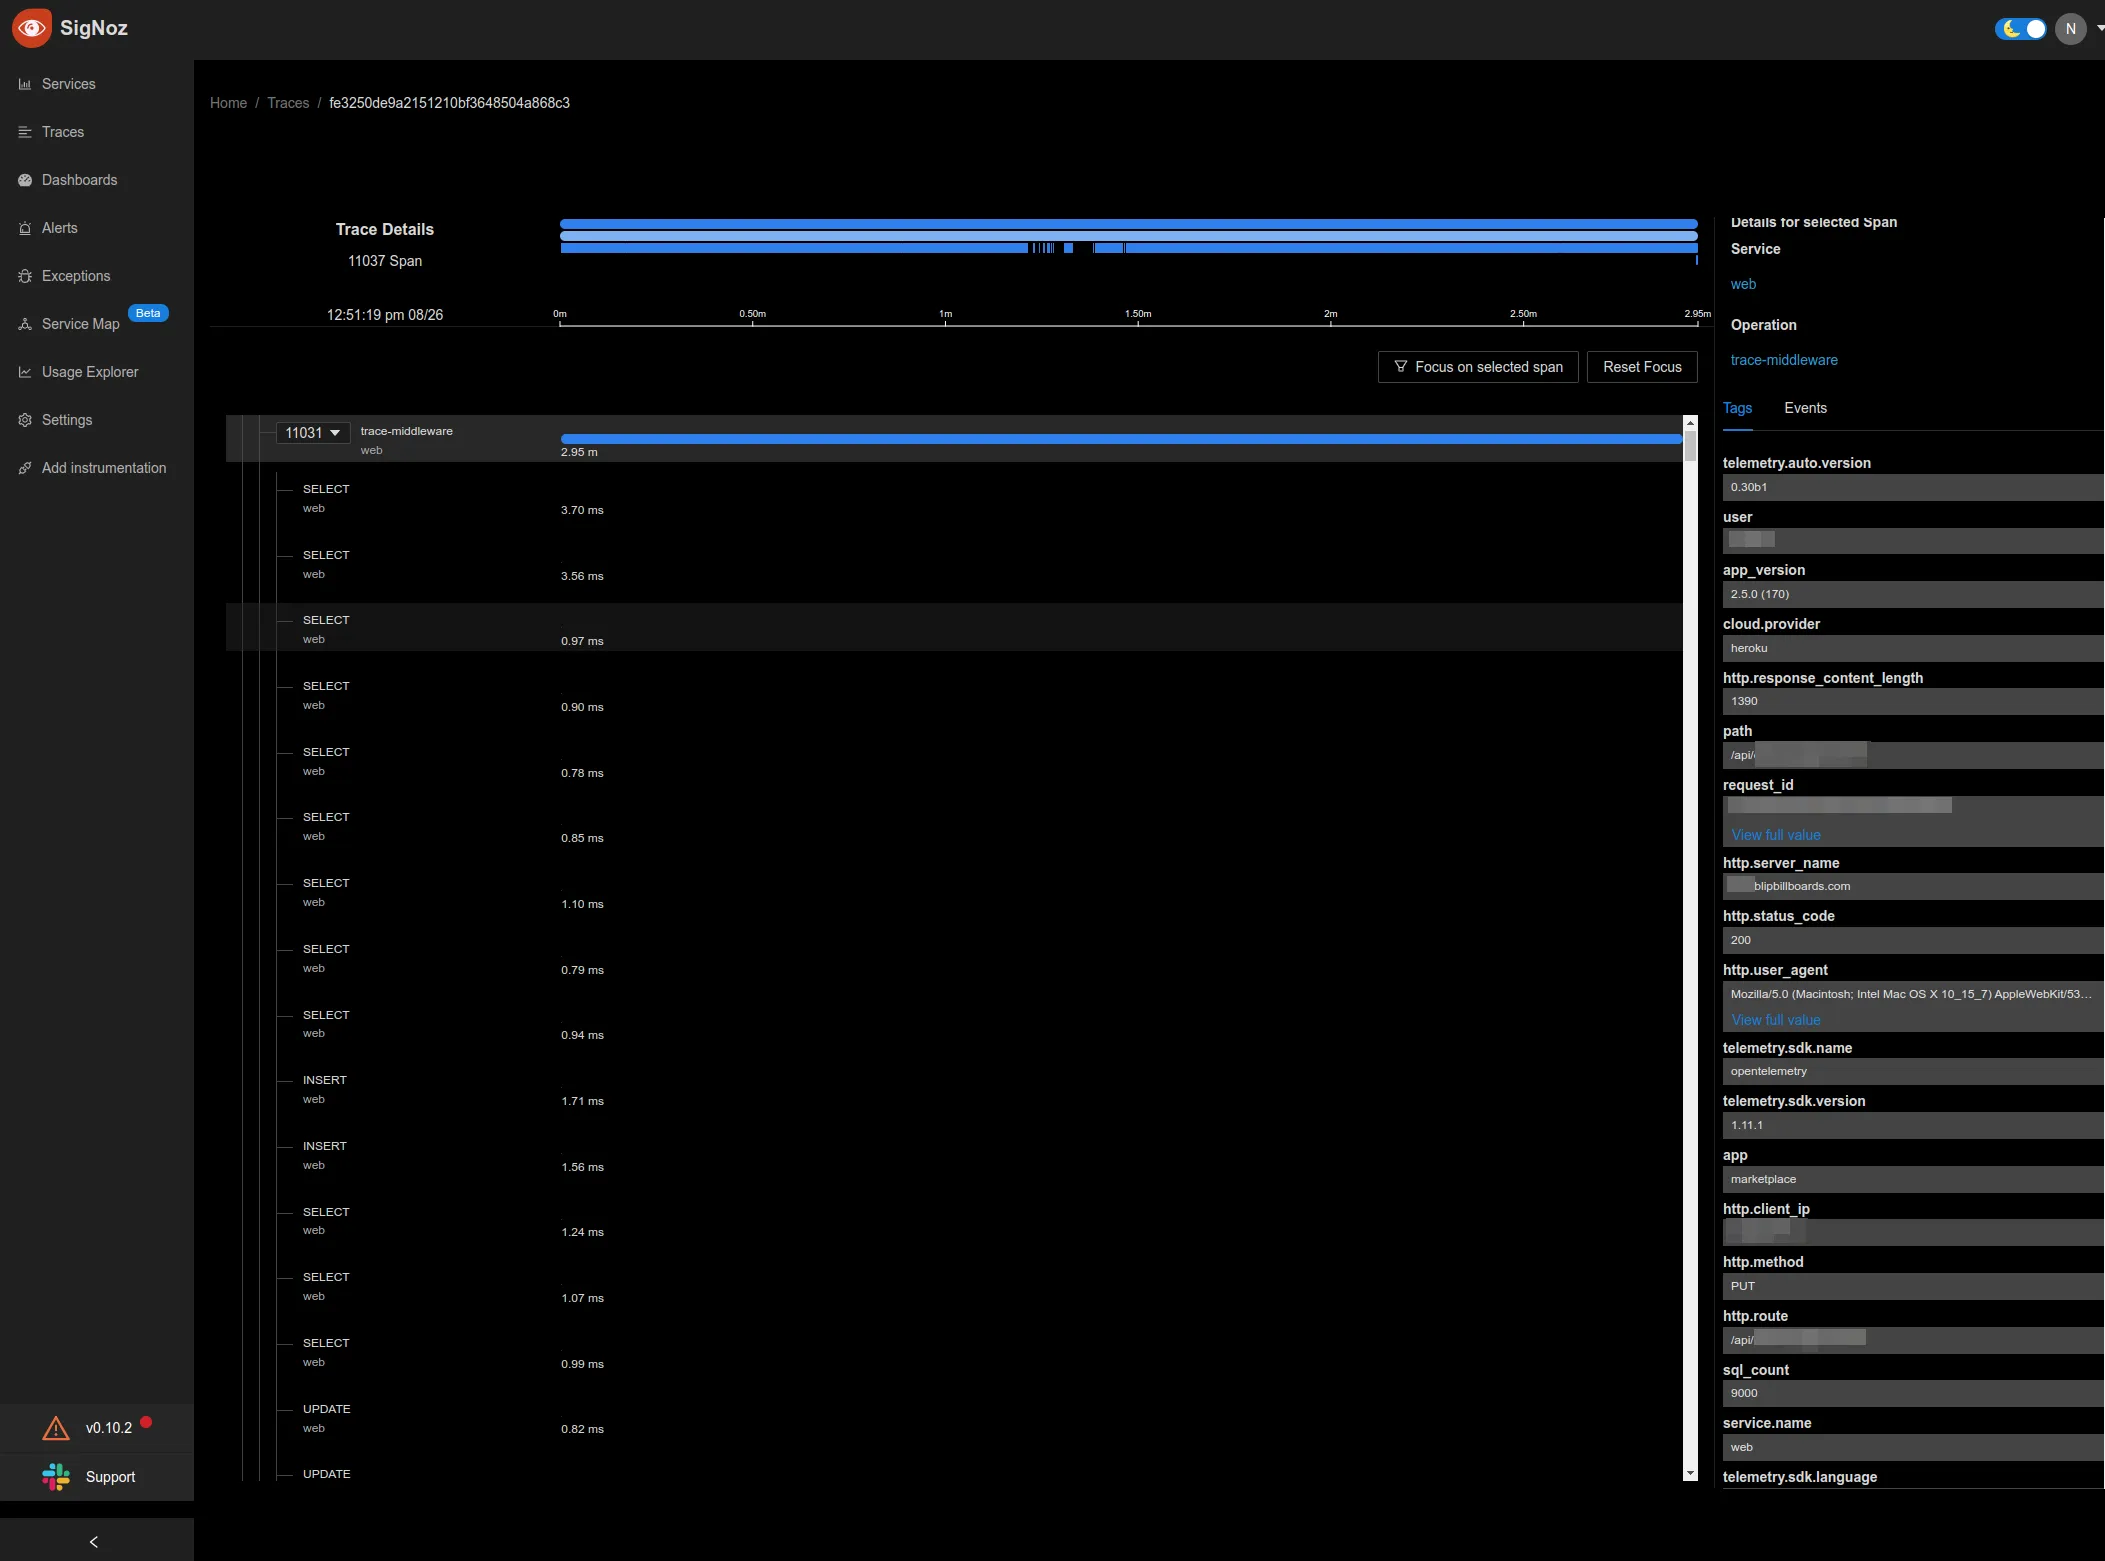
SigNoz showed me that if someone hits this particular endpoint with a particular campaign with a specific amount of data, it leads to 100 SQL queries in a single request. So if you do a select query on all of the rows you're looking for in the database in one go, it creates one SQL query. It takes like 5 seconds to complete, which is not great, but it's not terrible.
Data is right there in memory, and you're able to iterate through it and do whatever you need to do. Before that, it was going out and wouldn't cache this data. It would be selecting a single row at a time. And because of that, it took over three minutes to complete a single request.
And by seeing the trace details in SigNoz, I showed the developers what exactly was going on. I showed them the data that was being passed in. And now, instead of three minutes, it takes 2 seconds to complete the exact same request.
What made you choose SigNoz over other solutions?
Sure, we tried Jaeger before, but I think the OpenTelemetry packages were a little bit forked at that time or something.
Basically, it caused performance issues, so we had to roll that one back. But on top of that, trying to keep Jaeger up with an Elasticsearch backend was tough. Elasticsearch just couldn’t scale very well.
It was fine for small amounts of data, but as soon as you went and tried to scale it up to the level that SigNoz is capable of handling, the Elasticsearch cluster fell over.
And I know it could be fixed with tuning. I know it could be fixed by throwing more resources at it and adding more elastic search nodes, but it wasn't cost-effective.
We started getting to the point that it was thousands of dollars per month just to run the Jaeger service, and that's just not worth it.
A little bit of money is expected because developer time is very valuable, but at a certain point, you hit that tip-over point where developer time is worth less than trying to keep up that cluster.
And so it just wasn't very effective. It slowed down the site, it had all sorts of issues. We're still using the same OpenTelemetry packages this time, but I think something has been fixed or improved along the way.
So we didn't have any of those issues with rolling out OpenTelemetry into the code base this time. Also, SigNoz is way more performant and way more resource efficient. We don't need to throw nearly as many nodes at it or as much compute or RAM.
It just runs and runs very efficiently for what it's doing.
How much resource did SigNoz need to handle your scale?
So we did have to upsize the Kubernetes cluster we were using. We were using t3large before, and now we had to go up to t3xlarge because the amount of memory and CPU that was available on the t3large wasn't enough to run the ClickHouse database.
So the t3xlarge, as soon as we have created that, we basically dedicate one entire node to just the ClickHouse database, and it's okay with that.
And then, we also did auto-scaling for the OTel collectors to be able to collect the data accurately. As soon as one of the nodes hits 50% Ram or CPU, go ahead and bump it up a little bit, and then bump it back down when you don’t need it.
And on average, we go between about three OTel Collectors up to about nine. I have seen scaling up to nine for very short periods when there are little bursts or things like that.
Altogether, if I remember right, it was about 32GB of RAM on average for everything, including the ClickHouse and OTel collector. So, broadly 32GB RAM is sufficient for 40 mn spans per hour.
What features do you use the most in SigNoz?
We use distributed tracing a lot. We use all the features of distributed tracing, individual spans, attributes, and events associated with each span. With all the features combined, distributed tracing shows exactly how things are running, and that’s incredibly helpful.
The second feature that we use the most is the application metrics page which shows latency like p95, p99, and response times for different endpoints. At a glance, we can review which endpoints are taking longer and investigate them.
Any advice for teams trying to set up their observability systems?
I would suggest teams use the automatic instrumentation provided by OpenTelemetry libraries. It's good to automatically instrument things like your database calls, and your various HTTP calls, among other things. You don't need to worry about instrumenting applications yourself initially. It's great to get something up and going because it is so insightful to just see things laid out.
The second thing I would suggest is that if you have a place where there's a common endpoint that comes in your application, wrap that in a span because all of the different things are automatically instrumented and aren't necessarily tied together with a single request by default.
If you have to instrument one place, make sure you instrument the place where everything enters your system. So if there's a routing handling system, or if there's a piece of code that handles requests, you can wrap that in a single span, and then all of those database calls get tied together, and it's wonderful.
Thank you for taking out the time to read this case study. If you have any feedback or want to share your story using SigNoz, please feel free to reach out to hello@signoz.io with Case Study as subject.
Sharing stories of how different teams are using SigNoz helps the community in learning different use cases and problems SigNoz can solve and also showcases how you are solving issues in a unique way.
Feel free to join our slack community and say hi! 👋