Top 11 Cloud Monitoring Tools [Updated 2026 Guide]
Cloud monitoring tools allow you to keep your cloud resources in check and ensure that they are healthy and performant. This includes your infrastructure, applications, databases, network, disk usage, and more.
As dependence on cloud providers rises, it’s important that you have the right tool to monitor performance, find issues, triage, and remove bottlenecks. There are many different cloud monitoring tools suitable for different use cases. Choosing the correct one can provide your business with a competitive advantage.
Why Not Use In-Built Cloud Monitoring Tools?
If you’re hosting your infrastructure on a cloud service provider, chances are that they already have monitoring tools. For example, if you’re on AWS, you get Amazon CloudWatch. If you’re on GCP, you get Cloud Monitoring, and if you’re running on Microsoft Azure, you get Azure Monitor.
While In-Built Cloud Monitoring tools might be an easy solution for your initial needs, they come with challenges.
- Vendor lock-in makes it difficult to move your entire monitoring pipeline in case you choose to go with a new cloud provider in the future.
- If you’re running a hybrid cloud or a multi-cloud setup, then you would need additional monitoring tools to observe your entire stack.
- They might offer a broad range of capabilities, but their capabilities aren’t in-depth.
- They usually don’t offer a high level of customization.
- For advanced needs like APM and SIEM, the in-built monitoring tools might not be enough.
- Integration with your existing monitoring stack might become a challenge as they don’t provide great integration endpoints.
- While the pay-as-you-go model might look attractive in the beginning, the costs increase quite rapidly to meet the monitoring requirements. There isn’t any option for custom pricing.
Top 11 Cloud Monitoring Tools
1. SigNoz
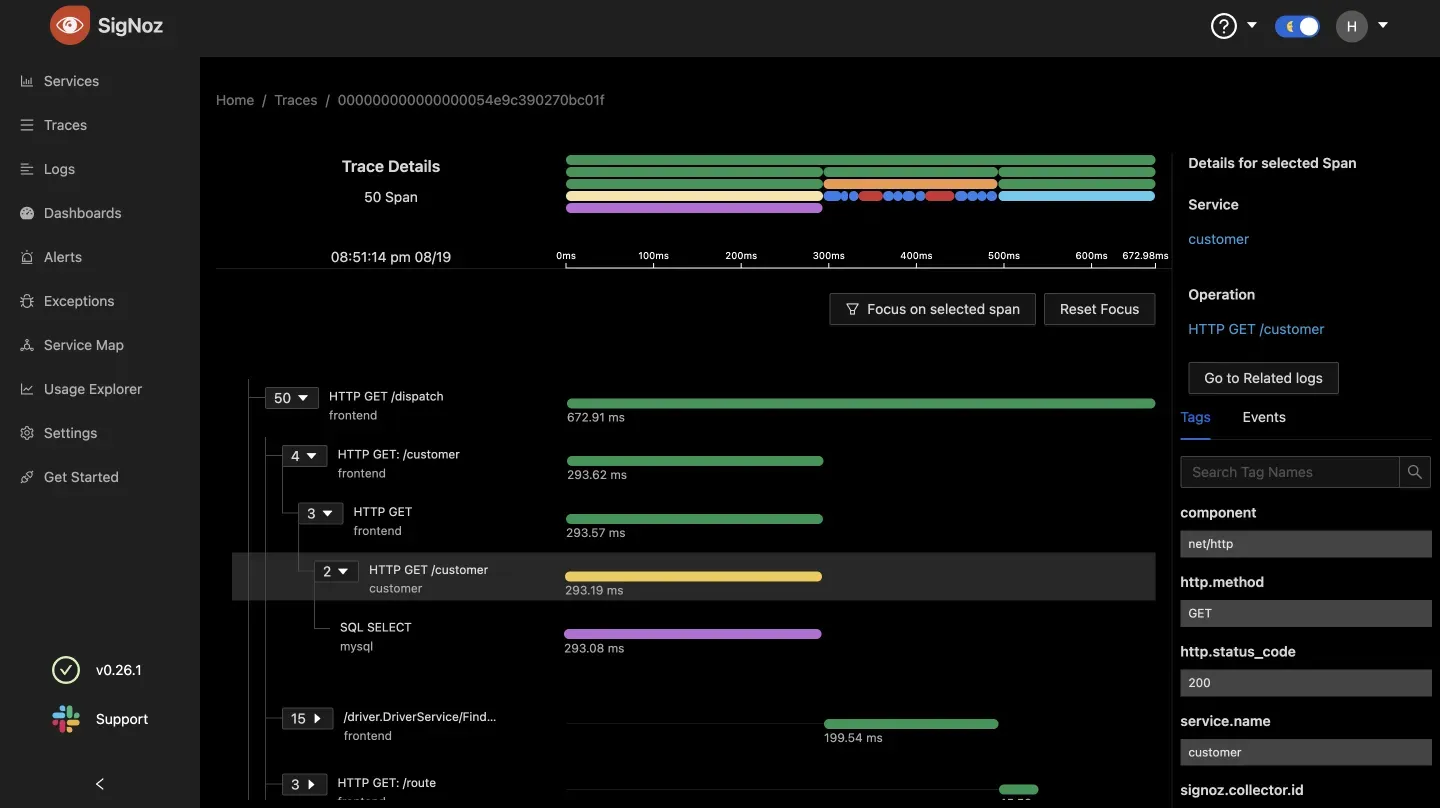
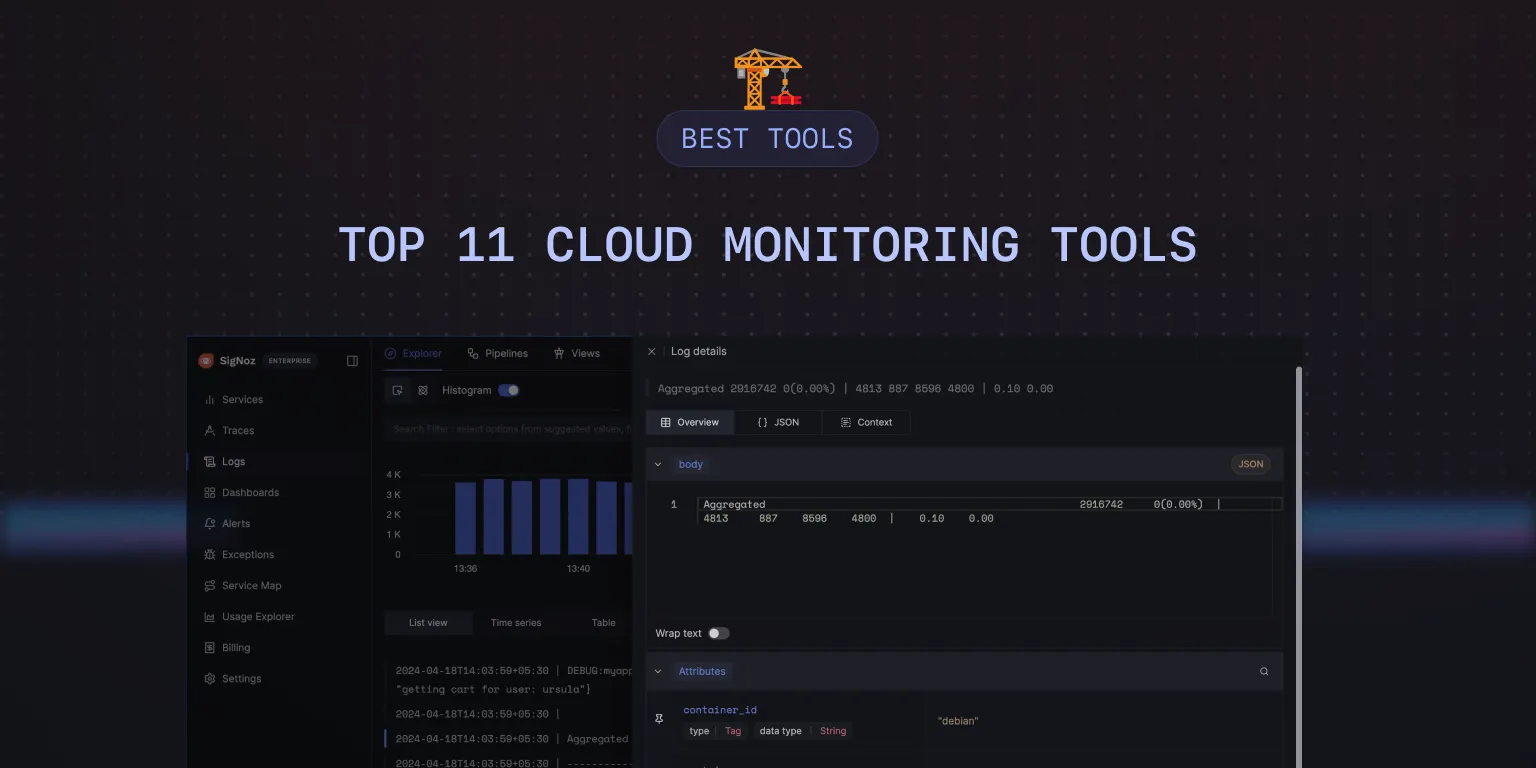
SigNoz is a one-stop observability solution that provides you with application monitoring, metrics, log management, exception monitoring, distributed tracing, custom dashboards, and setting up alerts. You get a service topology and complete dashboards right out of the box along with the most common metrics like p90, p99, request rates, and error rates.
SigNoz is OpenTelemetry-native, so there is no vendor lock-in. Based on your use case, you can instrument your application with OpenTelemetry and switch to any OpenTelemetry-compatible backend.
Using the SigNoz OTel Collector, you can easily build your monitoring pipelines and integrate them with existing ones. With ClickHouse as the underlying columnar data store, ingestion, and query aggregations are very fast.
SigNoz is available both as an open-source software and a cloud offering. SigNoz cloud is the easiest way to get started with it. And you can always use the open-source version based on your use cases.
Pros:
- Three signals in a single pane - you can use SigNoz as your one-stop observability solution
- OpenTelemetry-native - OpenTelemetry is the future of instrumenting cloud-native applications
- Columnar datastore, which is very efficient for storing observability data
- Integrations with popular services of cloud providers
- An advanced query builder to search and filter through your observability data quickly
- Customized dashboards to monitor specific components of your tech stack
Cons:
- Doesn’t provide out-of-box charts for network monitoring
- Doesn’t have Cloud SIEM
2. Dynatrace
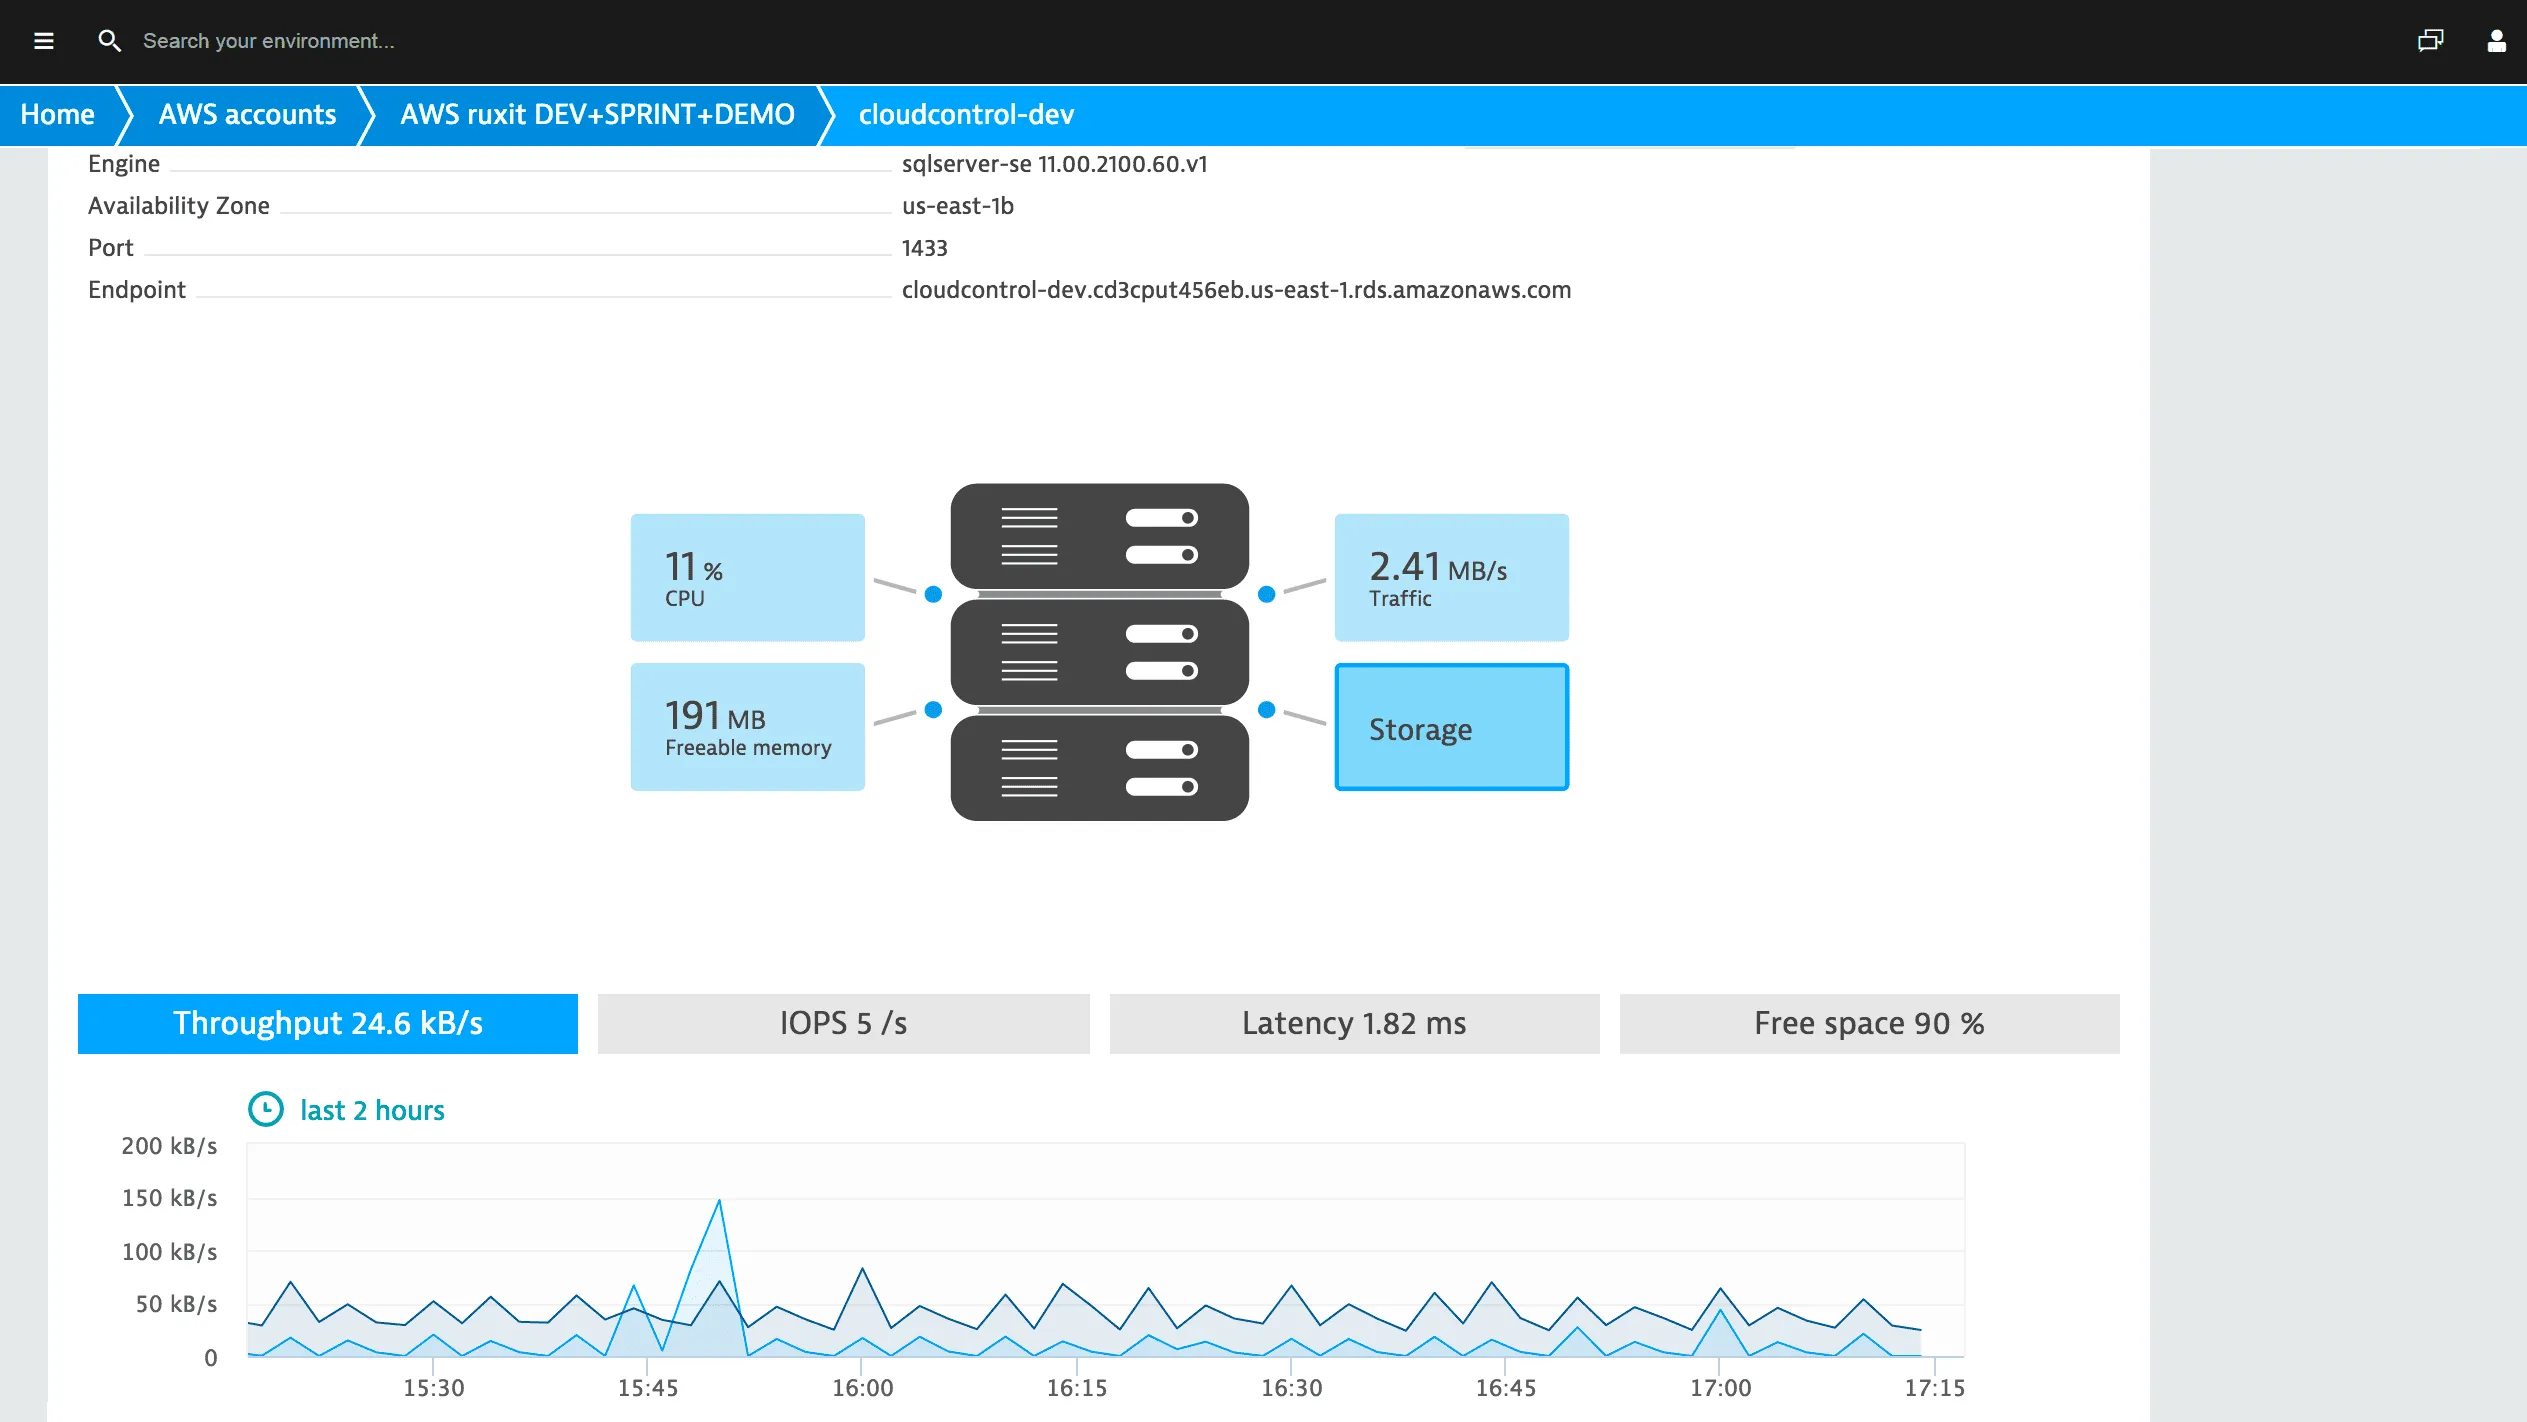
An end-to-end cloud monitoring platform, Dynatrace Dynatrace offers easy and automatic deployment for all cloud environments. In fact, it offers full gap-free observability across all your nodes, transactions, users, OS-level, and crucial network metrics.
With a user-friendly interface, it meets most APM monitoring needs while also providing advanced root cause capabilities for more in-depth analysis.
Available in on-premise models and SaaS, Dynatrace provides comprehensive dashboarding, a wide range of seamless integrations, and support for advanced log analysis.
Pros:
- Enables constant auto-discovery of hosts, logs, events, containers, VMs, and more.
- Has AI-supported algorithms to set up predictive alerts for proactive resolution.
- Offers a sophisticated integration library to monitor cloud apps and logs.
- Excellent UI that aids in fast problem-solving with easy agent installation, even for beginners.
Cons:
- Pricing can be confusing and varies depending on features, host, and the amount of RAM you’re using.
- No free trial is available for Dynatrace.
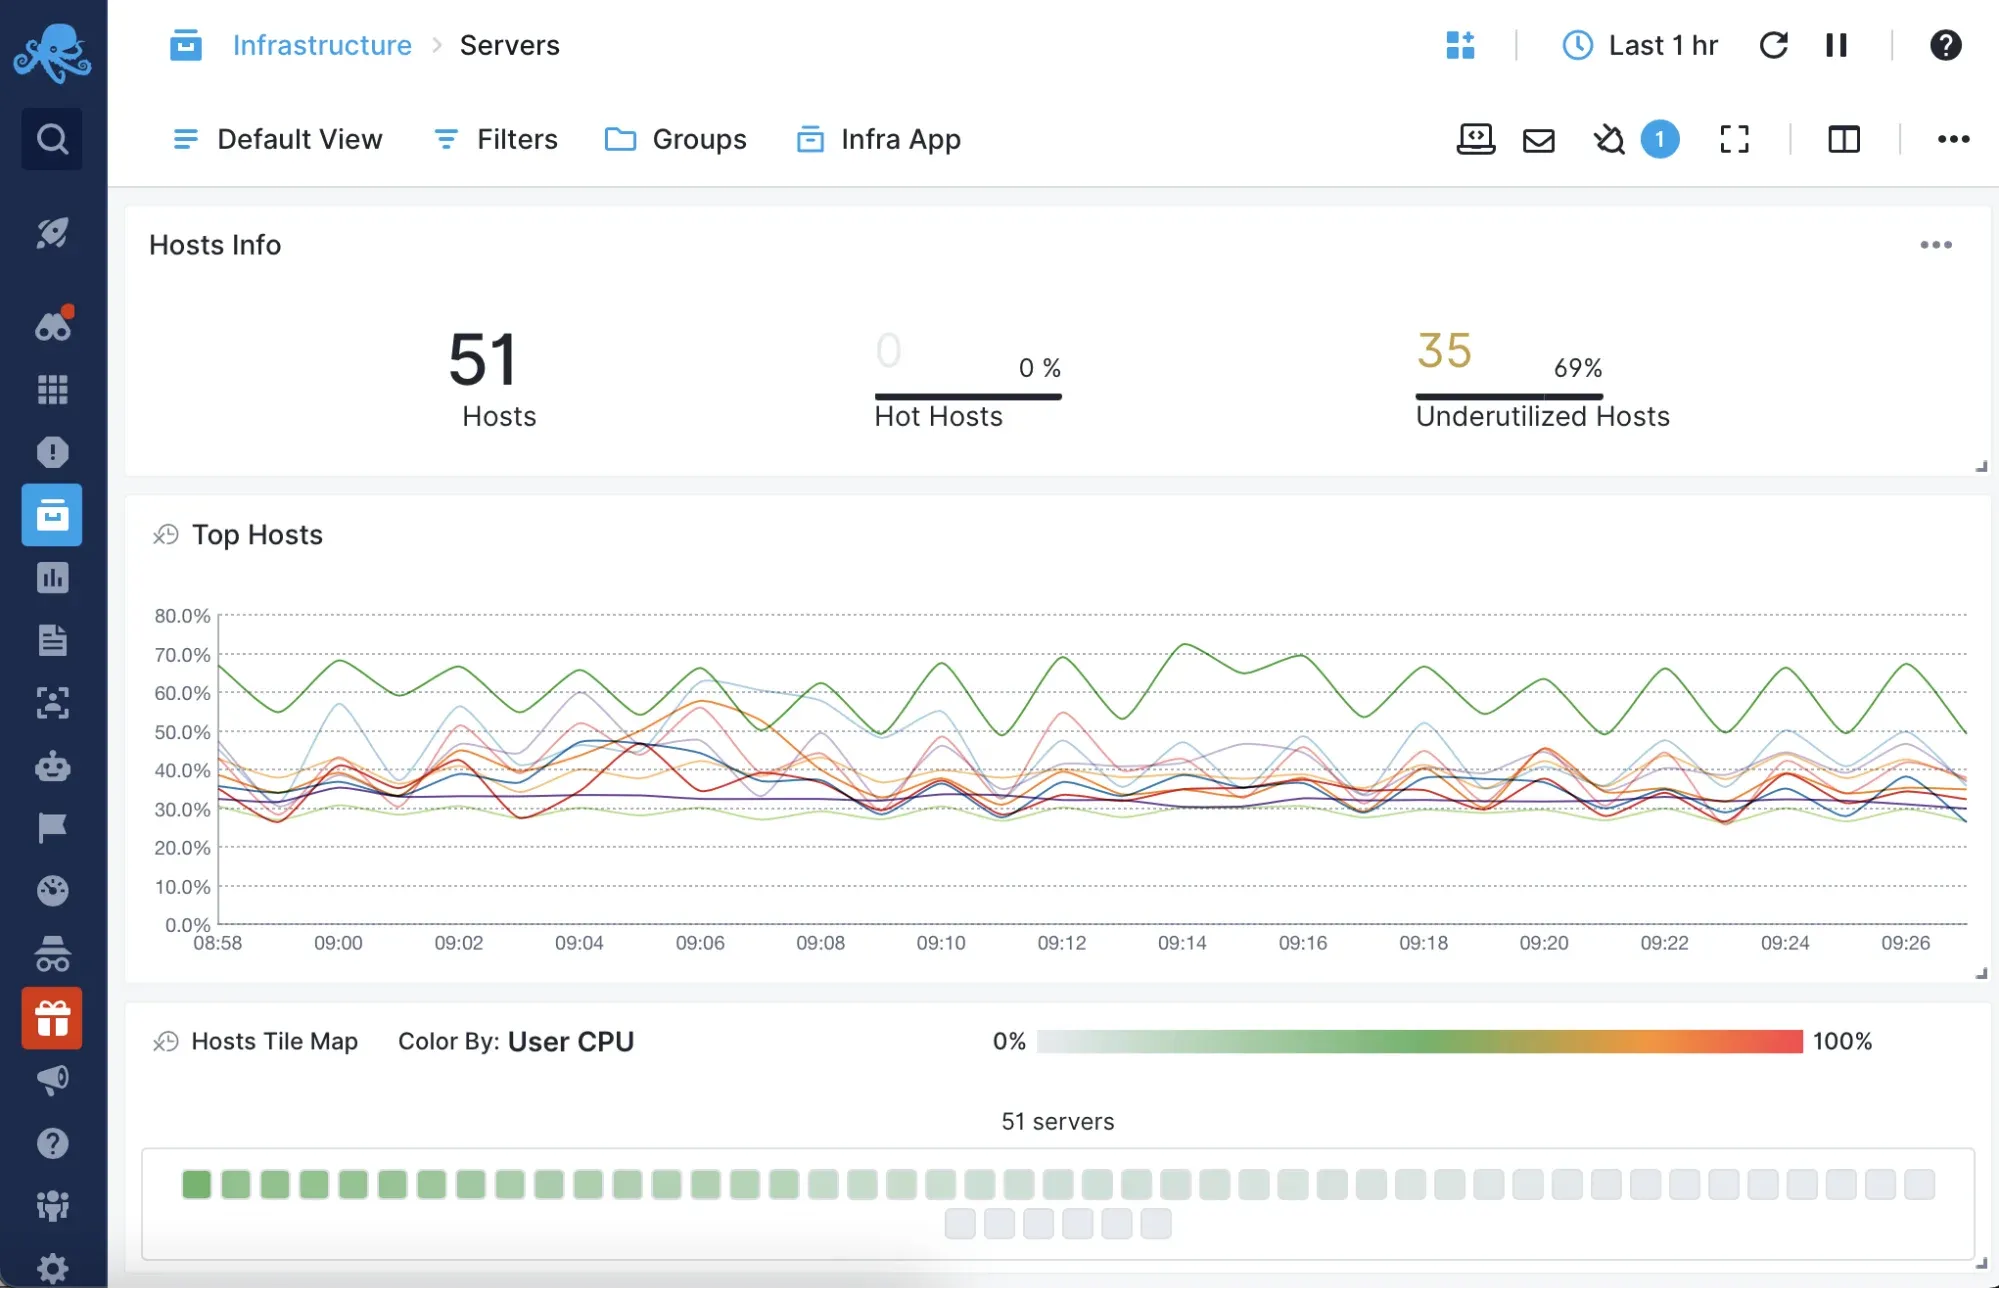
3. Datadog
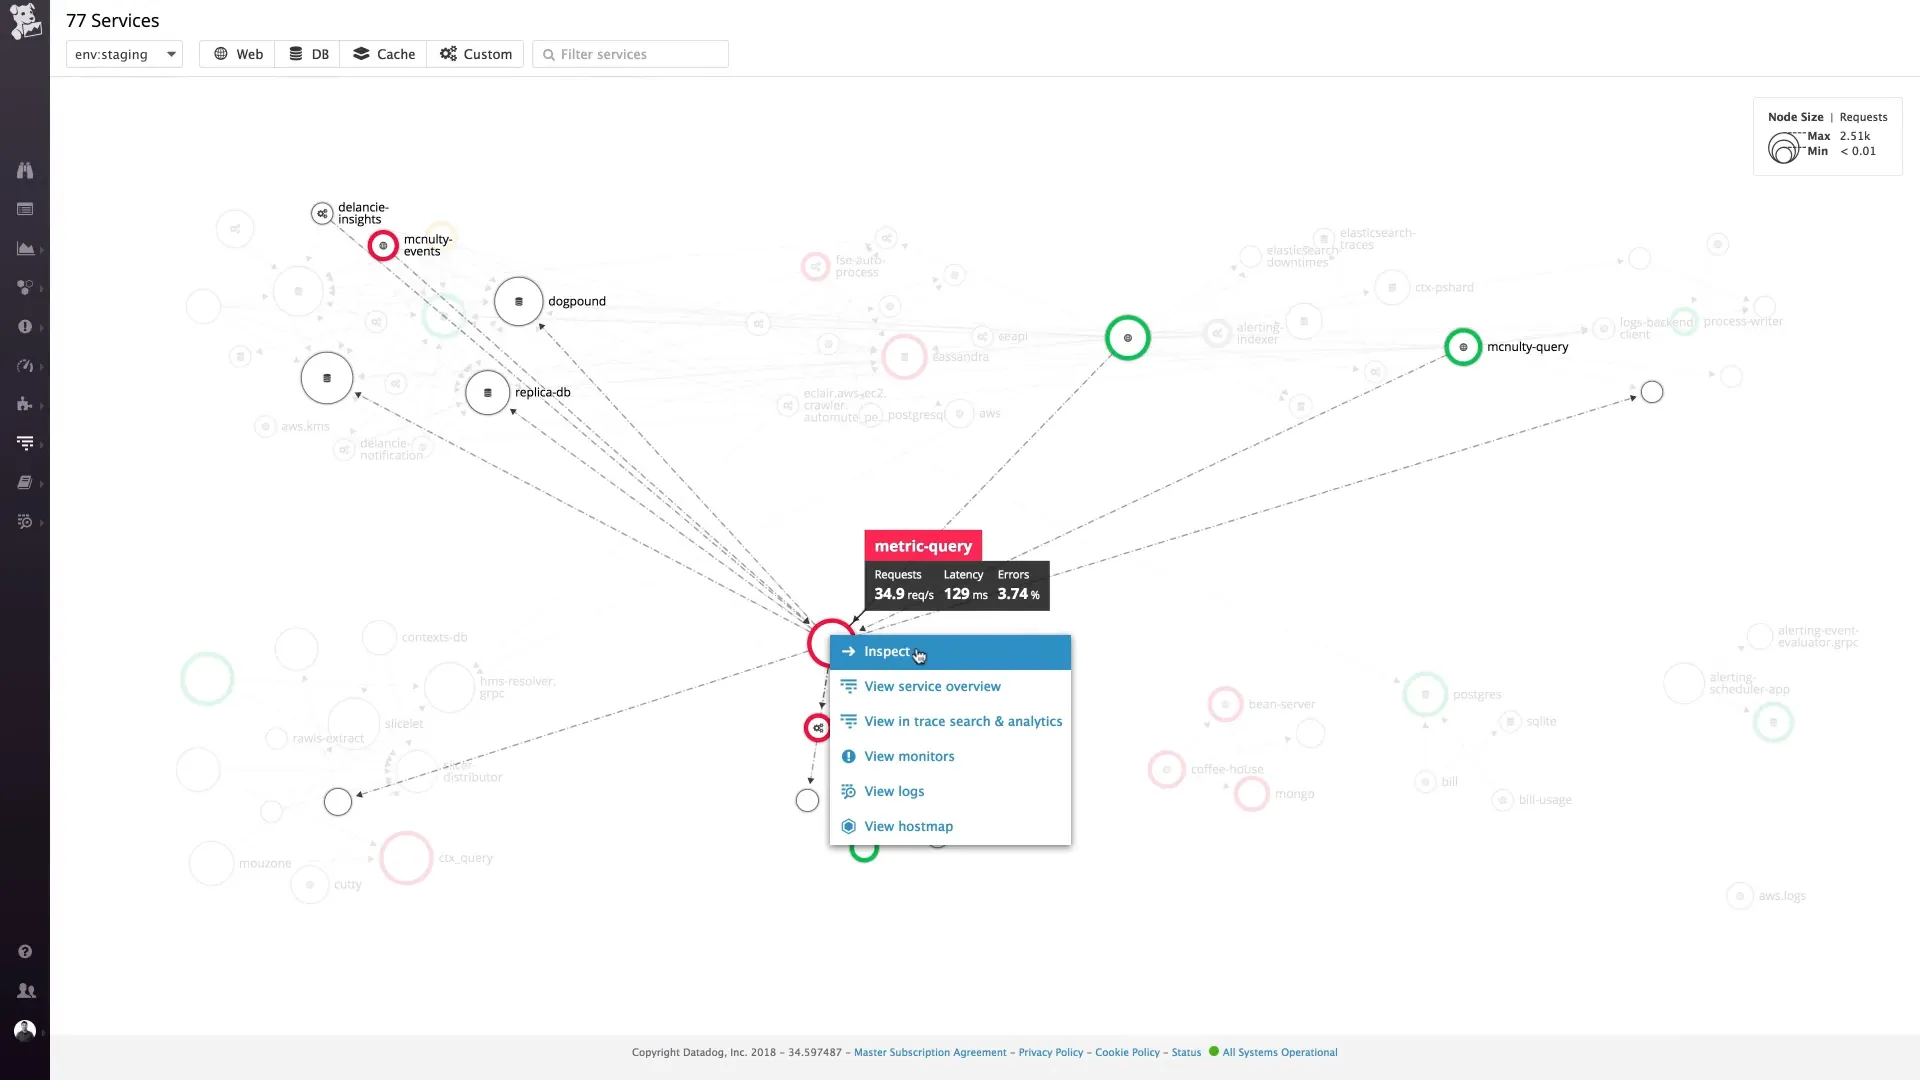
Datadog is a SaaS-based centralized cloud monitoring solution that allows access to 700+ data sources and vendor-backed integrations. Great for breaking down information silos and dealing with complex data points, Datadog reduces downtime in cloud, on-premise, or hybrid environments.
Datadog has exceptional features: built-in anomaly detection for issues, advanced filtering, live trace search, error tracking for real-time resolution, and a continuous profiler for performance optimization.
You can unify real-time metrics across logs, events, and traces from your applications, cloud-scale infrastructure, and other third-party services. In addition, their interactive out-of-the-box dashboards are seamless and support bulk actions.
Pros:
- Datadog’s Watchdog can detect performance issues using advanced ML algorithms.
- Has detailed documentation with responsive customer support to help troubleshoot faster.
- Comprehensive hybrid cloud monitoring enables better collaboration among teams.
- Rest API functionalities, fast UI, and seamless integrations make it an ideal choice for APM.
Cons:
- Configuration can be confusing for beginners.
- Plans are expensive for dealing with high-volume data.
- Filtered tags are slow, and most plugins provide no more than basic functionalities.
4. NewRelic
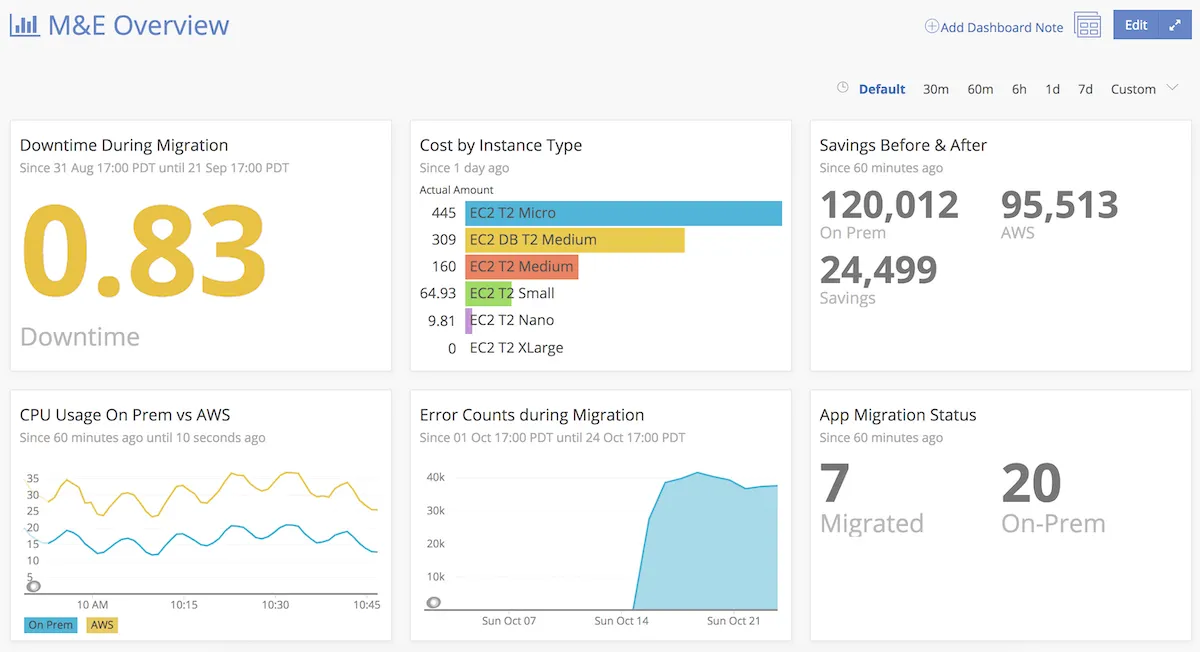
New Relic can be a good choice for a cloud-monitoring tool. It offers an array of tools for application monitoring and observability that can help you monitor your cloud services.
Using the data cloud, you enjoy multiple capabilities like unified metrics, logs, and traces, to high cardinality, multi-cloud functionalities, and continuous relationship mapping.
You can also visualize and analyze all the data stored in the cloud, check for error rates, page load times, and slow transactions from a unified source, set up your own alerts, check database performance with SQL queries, and do more with observability. It fulfills most needs of APM, cloud infrastructure monitoring, log management with incident management, and open ingest APIs.
Pros:
- You can write custom queries to analyze collected data using NRQL, NewRelic query language.
- Advanced error handling with a more efficient correlation between alerts and defined logic allows for reduced downtime.
- Strong integration network with 700+ options, and you can build your own with flex integration builder.
- Has business-level metrics support and rich visualization features to graph metrics and logs.
Cons:
- Agent management functionality is unavailable, which makes installation and configuration harder.
- Inconsistent UI experience across 30+ capabilities, with legacy interface slips here and there.
- User-based pricing can break your bill
5. Appdynamics
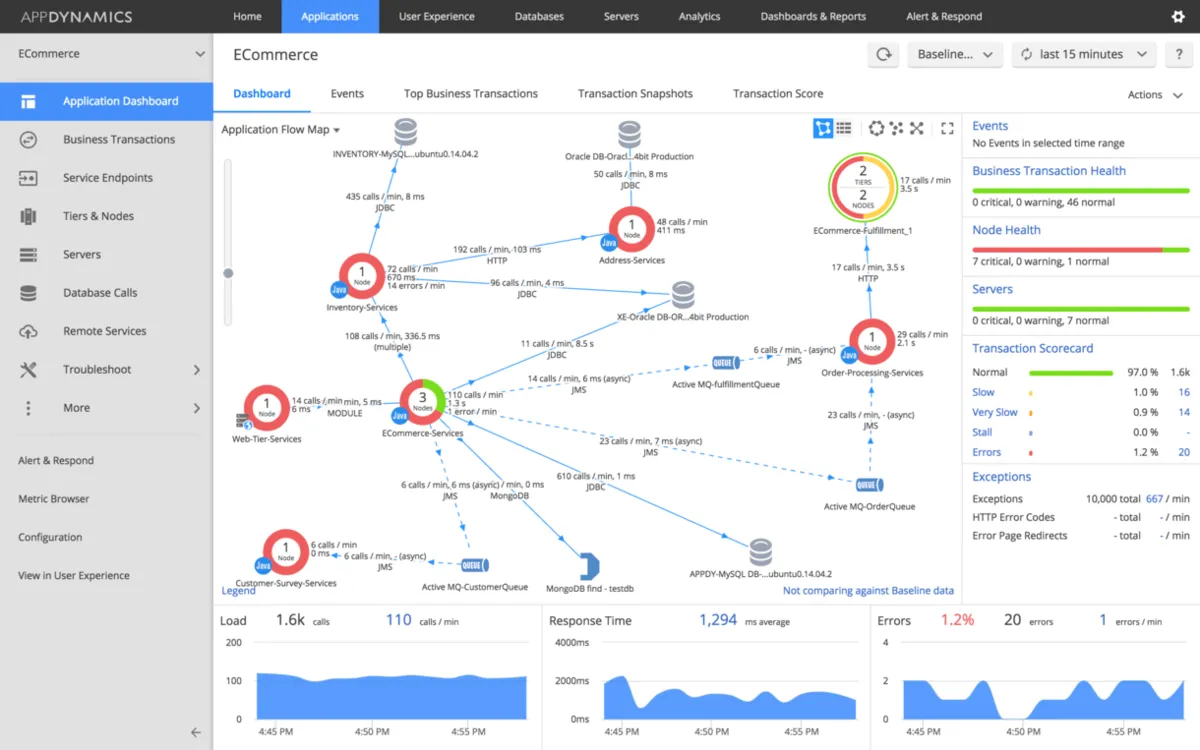
Source: Appdynamics
Appdynamics can make collecting, assessing, and correlating data across cloud apps, providers, and containers seamless. Find and fix issues faster with an experience that’s rooted in a dynamic view of all your cloud environments.
In fact, you can optimize end-user experiences by analyzing cross-domain MELT telemetry. You can also leverage business transaction insights to cut through the noise and identify business-critical transactions when applications start behaving abnormally.
Appdynamics has useful features like AI-assisted correlations, intelligent alerting, root cause analysis, and complete health monitoring for faster resolution.
Pros:
- Has strong community support and extensive documentation for each implementation.
- Automatically adjusts performance baselines, ensuring that abnormal behavior is quickly detected.
- Great for evaluating app scalability and transaction timings, mistake rates, and transaction outcomes for specific transactions.
- Has real-time insights, dashboarding, insight provision, contextual trace visualization, distributed tracing to drive business outcomes.
Cons:
- Initial setup is complex, and collaboration among large teams can be better.
- Application flow map isn’t the most helpful.
- Search and filtering features could be more developed.
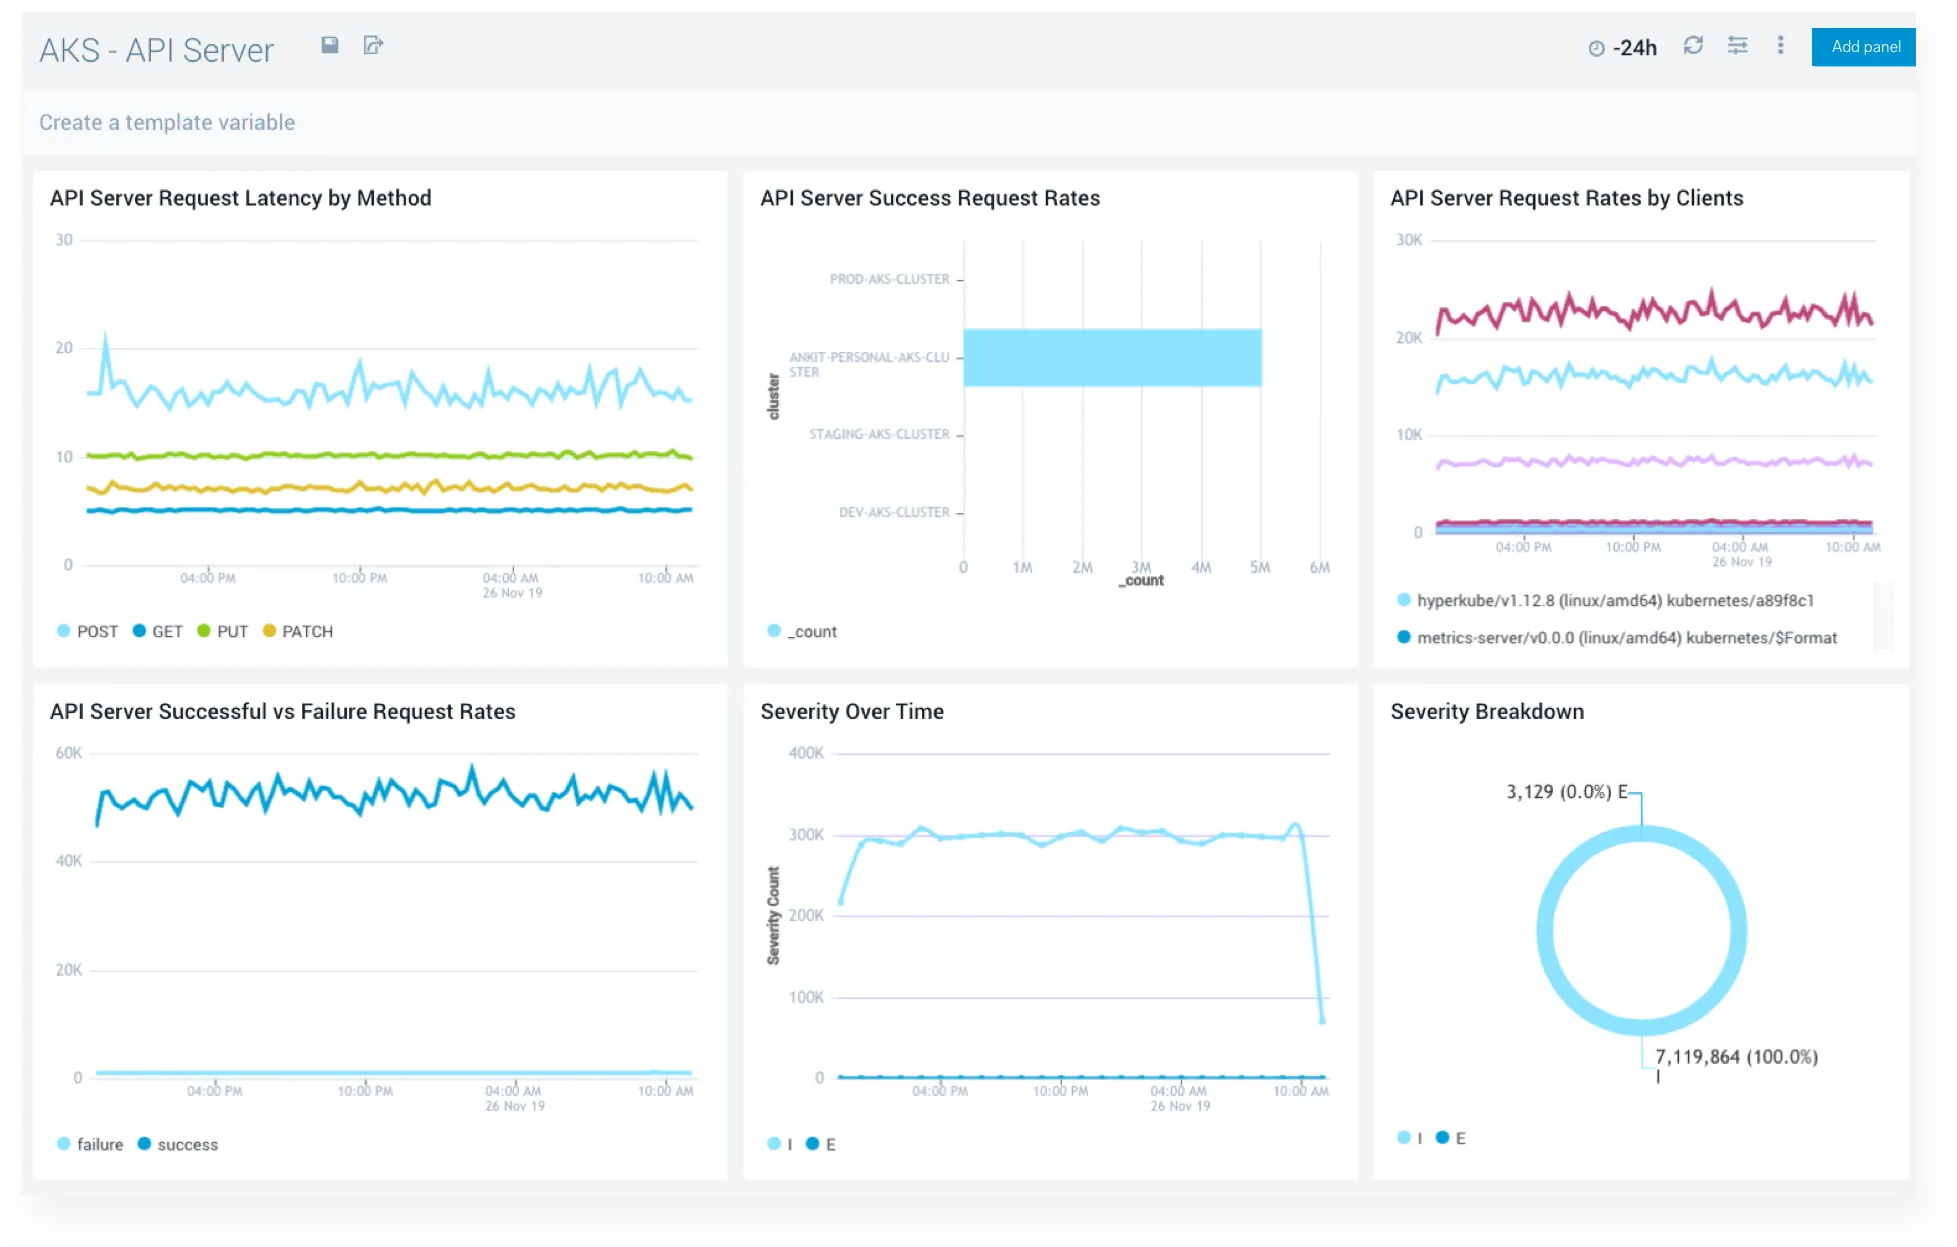
6. Grafana Cloud
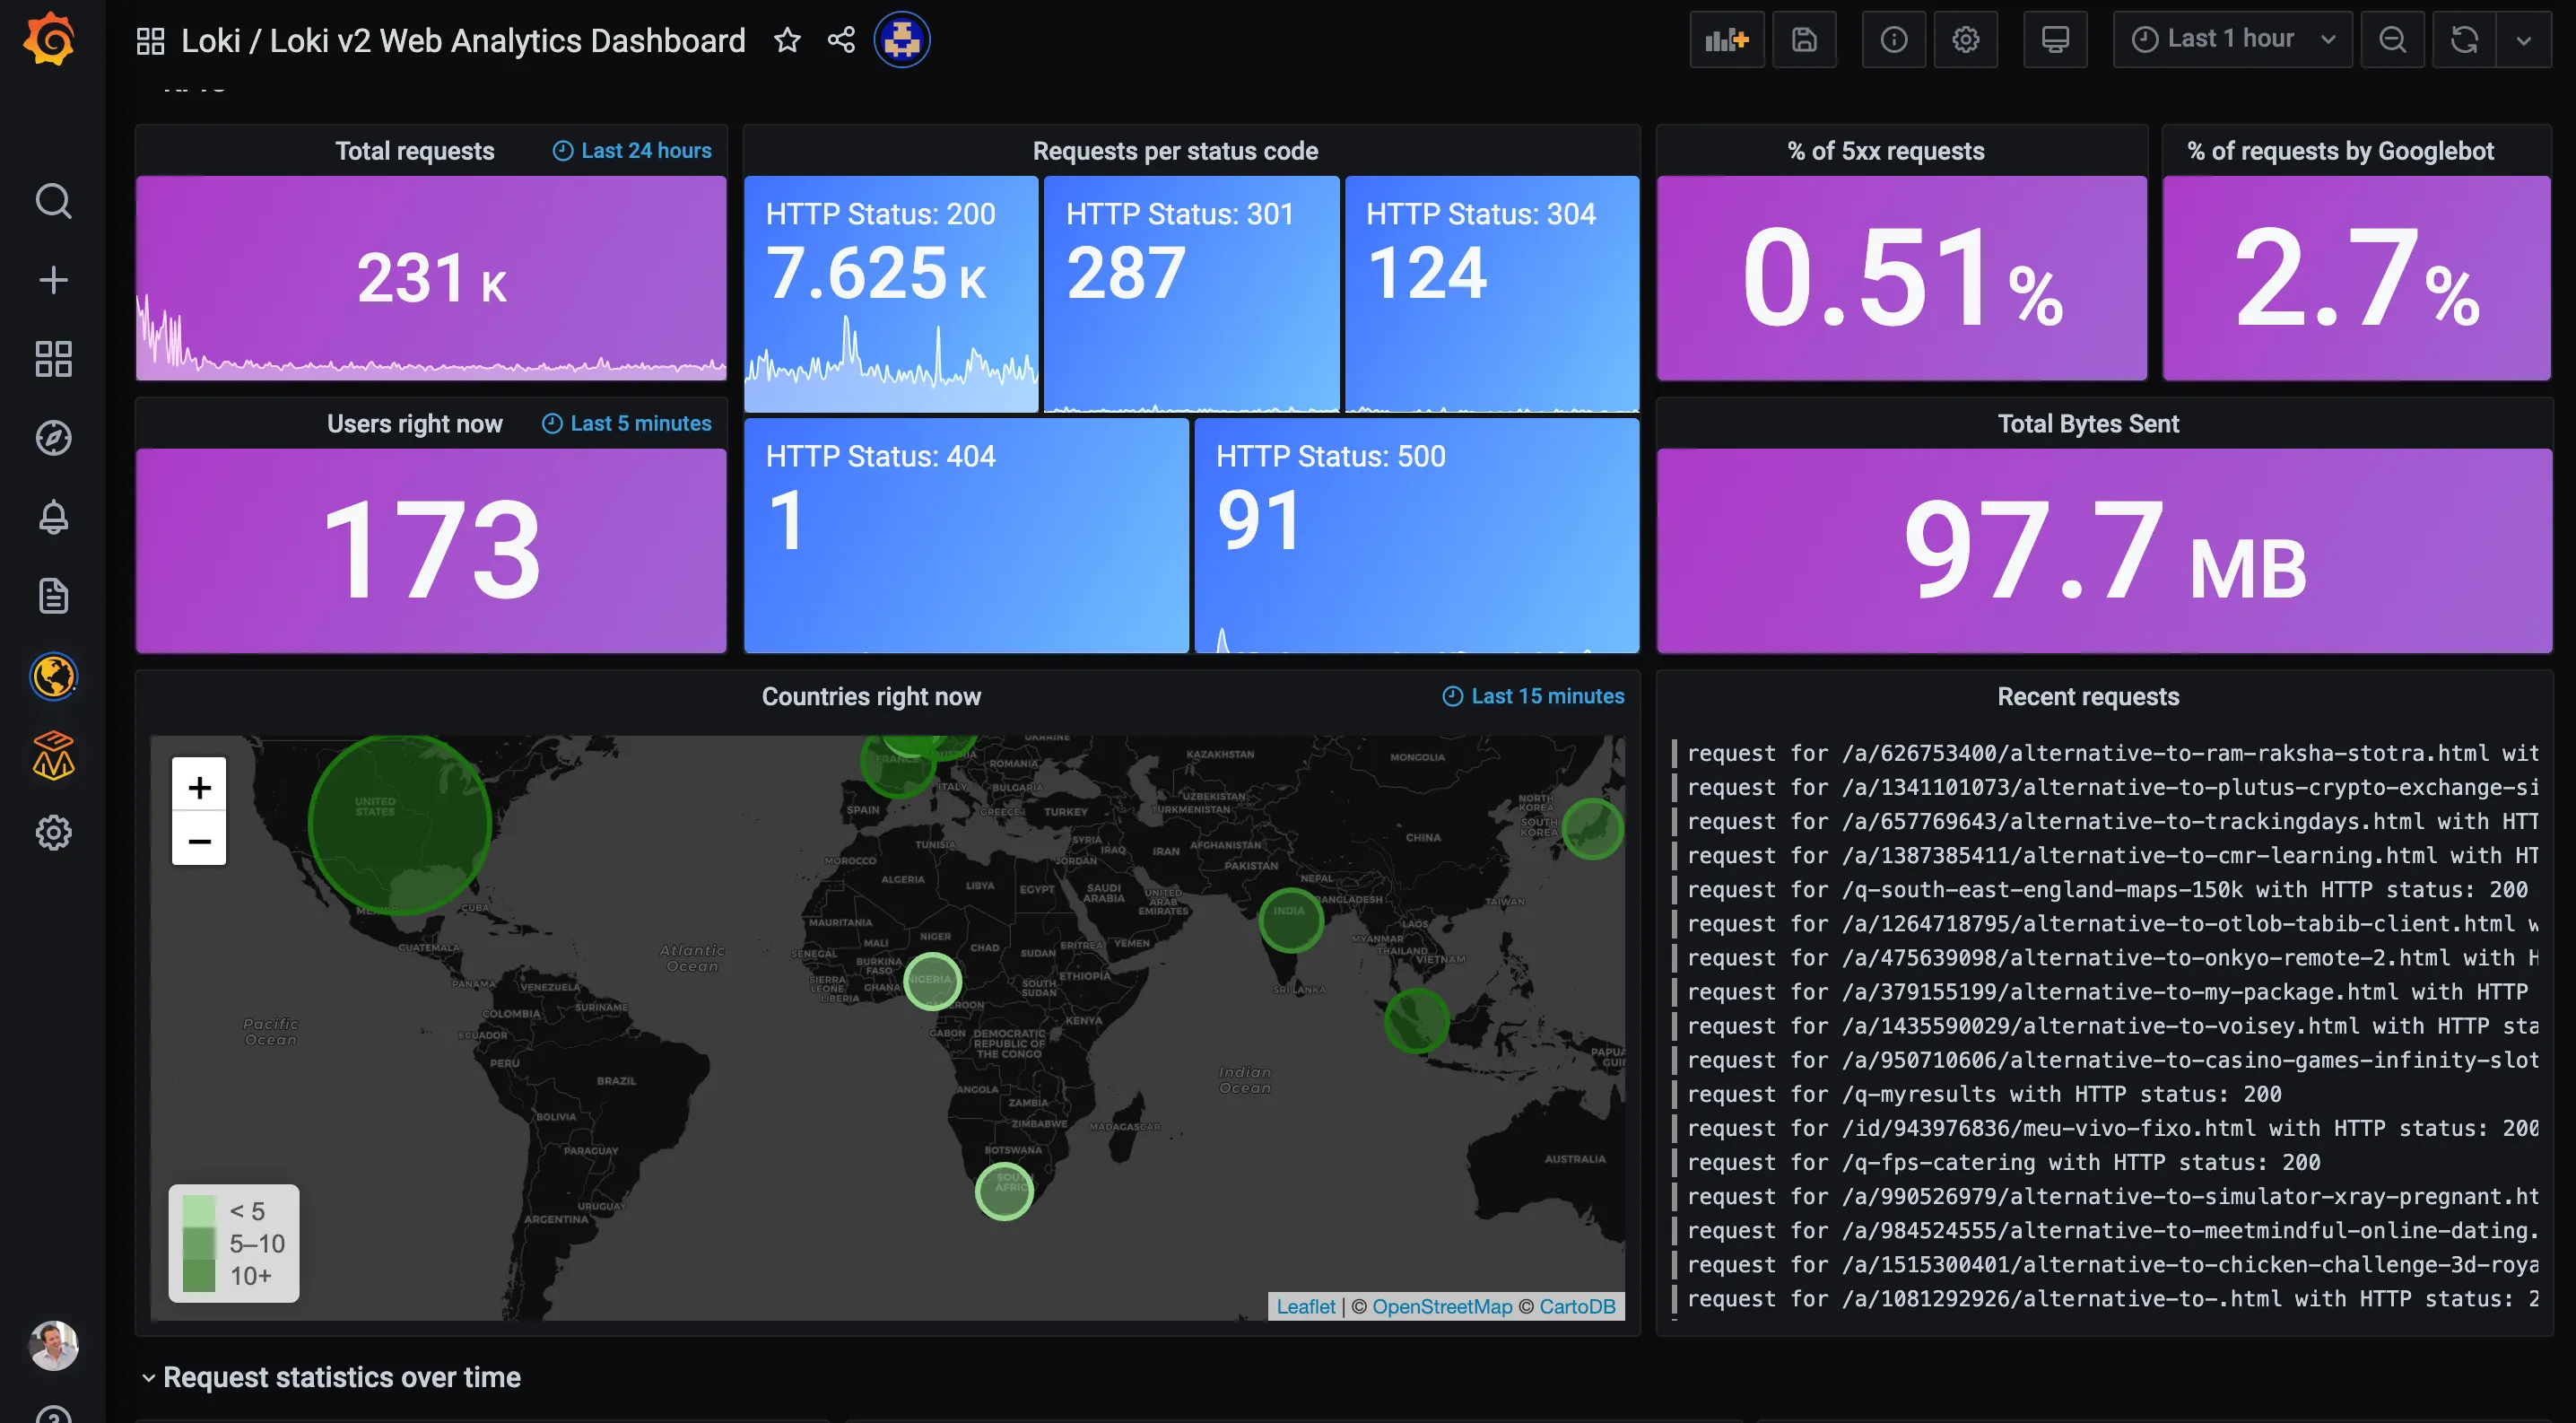
Grafana started as a data visualization tool whose primary strength lies in its integration with various data sources. It is primarily used for monitoring metrics and data visualization. For application observability, Grafana provides Loki, Mimir, and Tempo. All these tools are available as open-source software.
The disadvantage of using the LGTM stack is managing multiple backends, which can be cumbersome.
Grafana also offers Grafana Cloud to get you started easily.
Pros:
- Leverages Grafana Loki’s minimal indexing architecture for storing more logs using less storage.
- Allows extensive performance testing using Grafana k6 to prevent system failures.
- Provides advanced metrics support with seamless integrations and community support.
Cons:
- Multiple backends which can be operationally tough to manage if you’re using the open-source version
- Less suited as a cloud monitoring tool, better suited for data visualization
7. Honeycomb
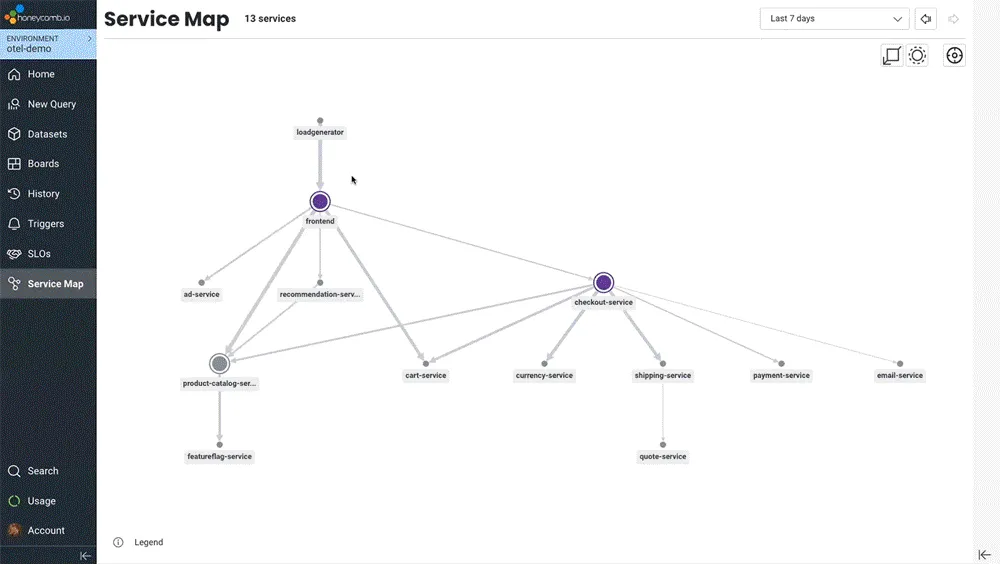
Honeycomb is a cloud monitoring tool that offers unique insights into system performance and behavior, catering to the needs of modern cloud-native applications. With its innovative approach to observability, Honeycomb provides a comprehensive platform for understanding and troubleshooting complex systems.
Its strength lies in its ability to provide high-resolution telemetry data, allowing you to drill down into specific events and anomalies with unparalleled detail. By capturing and analyzing rich data sets, Honeycomb enables you to identify patterns, correlations, and root causes of issues with ease.
Pros:
- Provides granular data analysis, allowing you to explore system behavior at a micro level, diagnose performance bottlenecks and identify areas for optimization.
- Dynamic sampling capabilities ensures capturing of the most relevant data points, saving on storage.
- Facilitates collaborative debugging through shared views and annotations.
Cons:
- Advanced features may have a steep learning curve for new users.
- Might not be best for budget-conscious organizations because of volume and feature-based pricing.
8. Elastic APM
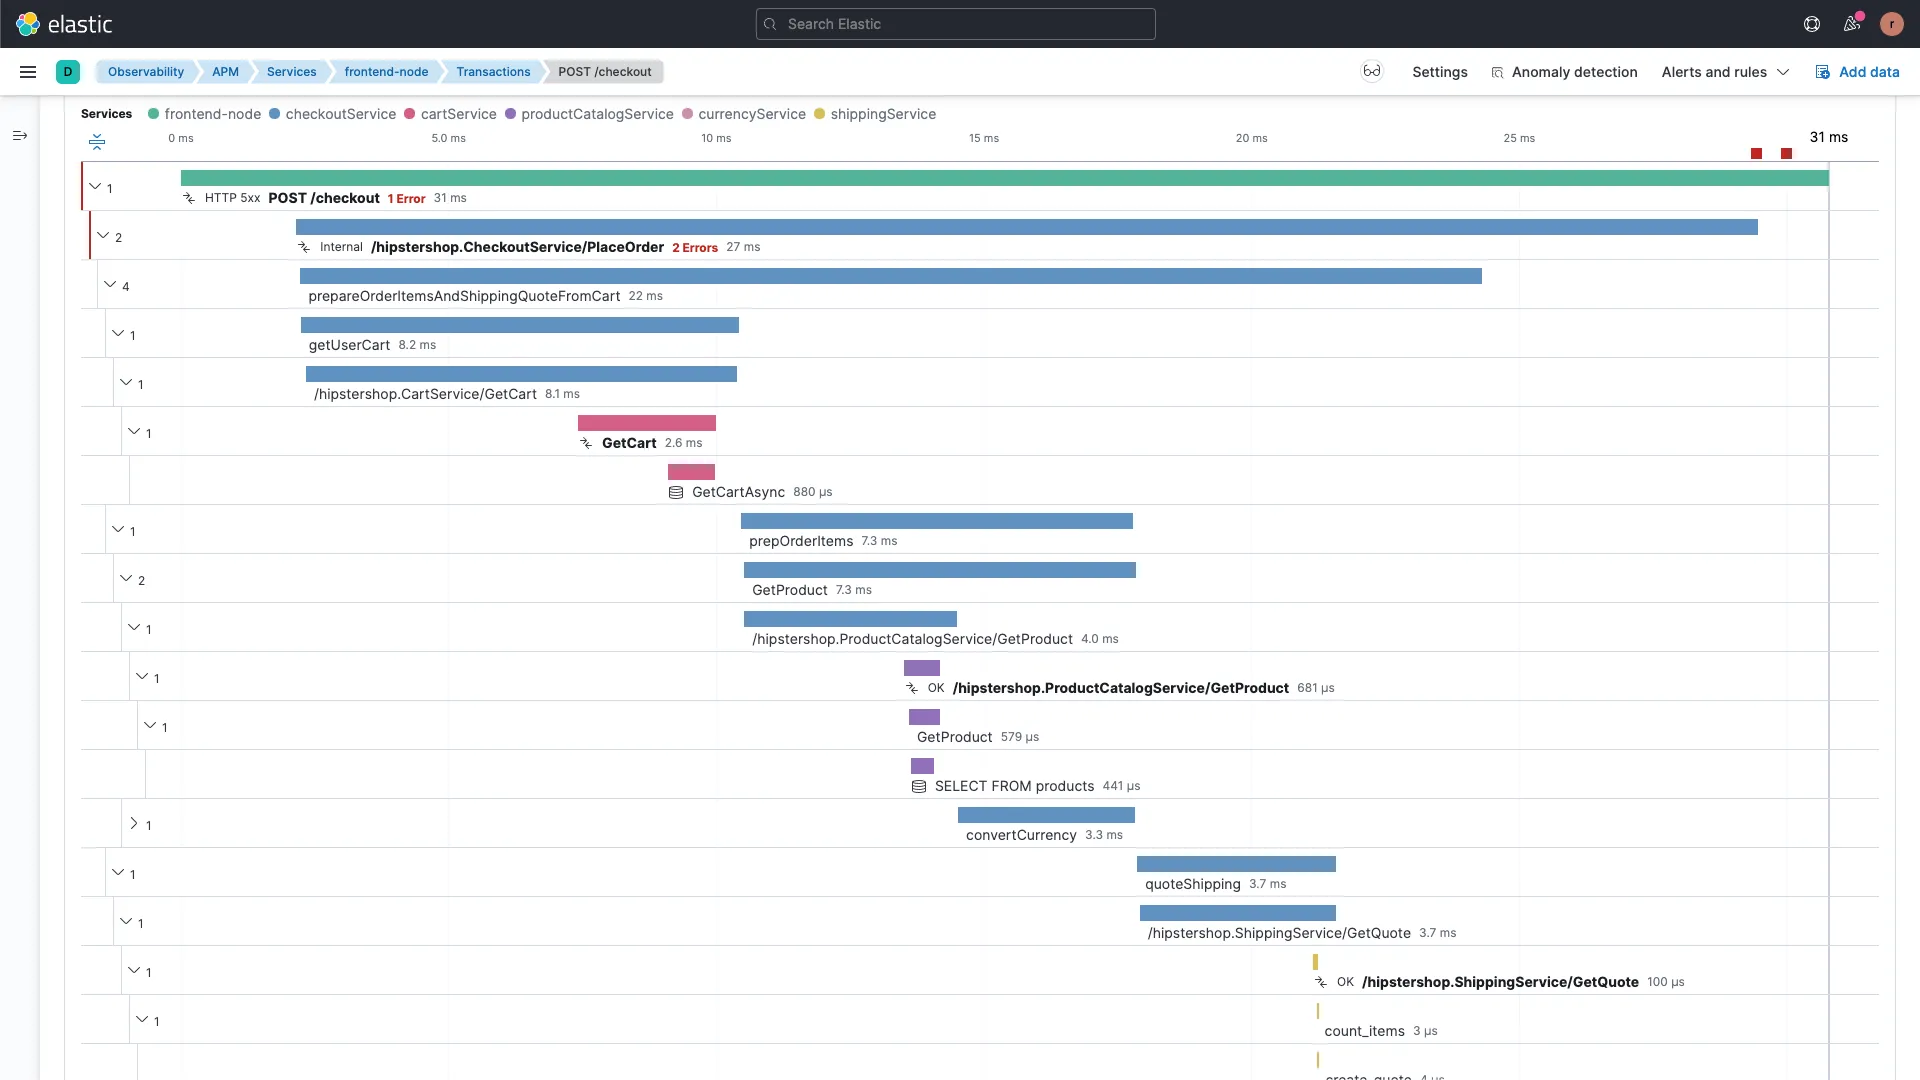
Elastic APM is part of the Elastic Observability solution, which also includes infrastructure and log monitoring, enhancing overall application and system observability. It can be a good choice as a cloud monitoring tool.
The easiest way to use Elastic APM is by subscribing to the hosted Elasticsearch service on Elastic Cloud. You can also opt to self-manage the Elastic stack, where you need to decide how to run and configure the APM server.
Pros:
- Has a highly flexible Query API that integrates real-time analytics with search seamlessly.
- Integrated solutions simplify data ingestion from multiple sources with a robust multi-language support like Java, Python, and more.
- Best fit for real-time analytics, customized visualization, and large-scale search functionalities.
- Built-in recovery mechanism to reduce downtime and latency with rapid search responses.
Cons:
- Costs for computing and data sources of high volumes of data can be exorbitant.
- Steep learning curve, even for experienced developers.
9. Splunk
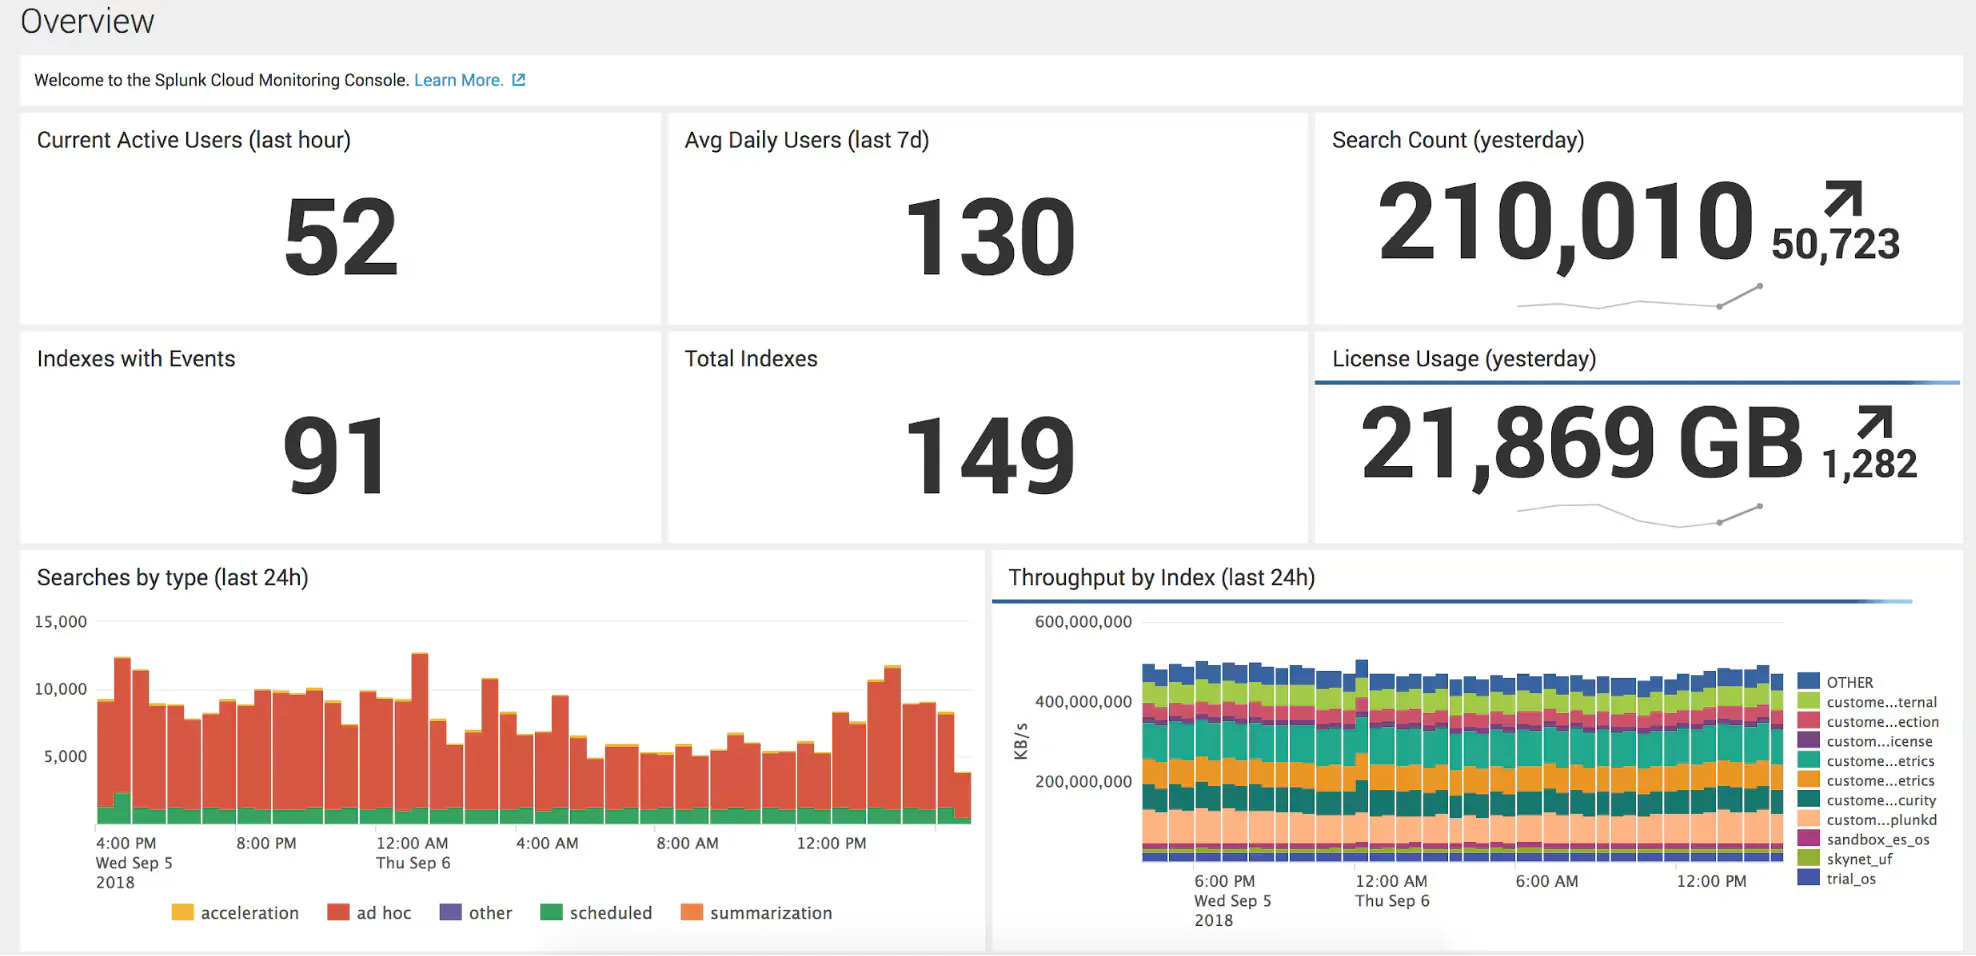
Source: Splunk
Splunk is a comprehensive cloud monitoring tool that offers multiple products, including:
- infrastructure monitoring
- Application performance monitoring
- Log Observer
- Real User monitoring
- Synthetic monitoring, and
- Incident response management
Splunk allows you to collect all traces instead of a sample set. It also provides service maps to offer DevOps teams visibility into interactions between different services, dependencies, and performance.
Splunk's observability Cloud for Enterprise editions starts at $95 per host per month if billed annually.
Pros:
- Great documentation with detailed guides and smart AI-powered assistants.
- Intuitive indexing, powerful query language, and a powerful library of preconfigured modules for instant insight.
- Pre-built, so every functionality is a click away and doesn’t require a steep learning curve.
- Strong community with enterprise security and ticketing integration makes it a better choice.
Cons:
- Pricing is on the higher side.
- New users might struggle to optimize Splunk for speed.
- Limited integration support for popular apps and services.
10. Sematext Cloud
Sematext Cloud offers a comprehensive set of cloud monitoring tools that lets you monitor private, public, and hybrid cloud environments. With the performance monitoring software, you can collect application-specific metrics and visualize them in pre-built or custom dashboards.
For your cloud-based log management needs, Sematext Cloud features a log management tool that lets you collect all system and application logs in a central place for faster analysis and troubleshooting.
You get a lightweight agent that automatically discovers not only the services running on your infrastructure but also the logs being generated. Easily deploy it anywhere — whether it's bare metal, virtual servers, or Kubernetes clusters.
In addition, you get Sematext Experience which lets you add real user monitoring to your monitoring stack.
Pros:
- Unified view of metrics, logs, and traces helps eliminate silos and enables cross-domain correlation.
- Support for high-volume data ingestion allowing for seamless scaling to meet the growing data demands.
- Offers advanced analytics capabilities, including anomaly detection, trend analysis, and predictive insights
- Both cloud-based and on-prem deployment options.
Cons:
- May require technical expertise to configure integrations and customizing workflows.
- Might be a learning curve in setting up and using all the features effectively.
11. Sumo Logic
Sumo Logic's strength lies in its ability to ingest data from various sources within your cloud environment, including public cloud providers (AWS, Azure, GCP), on-premises infrastructure, and applications. It centralizes log management, infrastructure monitoring, and application performance monitoring (APM) into a single platform, streamlining data collection, analysis, and troubleshooting workflows.
Sumo Logic leverages machine learning to analyze vast amounts of log data. These advanced analytics can automatically detect patterns and anomalies, allowing for proactive problem detection and faster root cause analysis.
It goes beyond basic cloud monitoring by offering a comprehensive suite of features designed to provide in-depth visibility and real-time insights into your cloud infrastructure.
Pros:
- Brings together log management, infrastructure monitoring, and APM into a single platform.
- Machine learning helps analyze, identify anomalies, and predict potential issues.
- Handles large volumes of data efficiently, making it suitable for growing businesses.
Cons:
- Pricing structure can be complex and potentially expensive for smaller businesses.
- Feature-rich nature may pose a steep learning curve for new users.
- Dashboards and reports may be less customizable.
Choosing the Right Cloud Monitoring Tool: 5 Things to Look Out for
On standards, the cloud-monitoring landscape is converging on OpenTelemetry as the vendor-neutral collection layer, so a practical 2026 criterion is whether a tool ingests OTLP natively, which lets you monitor AWS, Azure, and GCP through one pipeline instead of three cloud-specific agents.
Let’s take a look at the top 5 things you should look out for when choosing the best cloud monitoring tool.
- UI and Ease of Use: Most of the monitoring data is finally presented on the UI in the former of charts and graphs. Thus, it’s important that you have an easy-to-use user interface. It should be customizable to fit your needs, and you should be able to easily set up alerts.
- Complete Monitoring: When looking for a cloud monitoring tool, you should consider ones which cater to the monitoring requirements of all your components — from infrastructure and applications to networking and disk performance.
- Integrations and Scalability: You should be able to integrate the monitoring tool with your existing workflows, and be able to scale it out to adjust to your growing business needs.
- Cost Effective: Look out for hidden charges as they can considerably increase your spends. It’s a bonus if your monitoring tool provides a cost management platform.
- Support and Community: Having a strong user community is usually a good indicator for choosing a solution. Look for tools that are continuously maintained and improved and provide comprehensive support.
Getting started with SigNoz
SigNoz Cloud is the easiest way to run SigNoz. Sign up for a free account and get 30 days of unlimited access to all features.

You can also install and self-host SigNoz yourself since it is open-source. With 24,000+ GitHub stars, open-source SigNoz is loved by developers. Find the instructions to self-host SigNoz.
