Top 11 Logstash Alternatives [2026 Guide]
Logstash is an open-source log processing pipeline that ingests data from multiple sources, then transforms and sends it to various destinations. Despite its flexibility, Logstash might not always be the best fit for your specific requirements. In this article, we will look at the top alternatives to Logstash that you may want to consider for your application needs.
But before that, let us have a brief overview of Logstash.
What is Logstash?
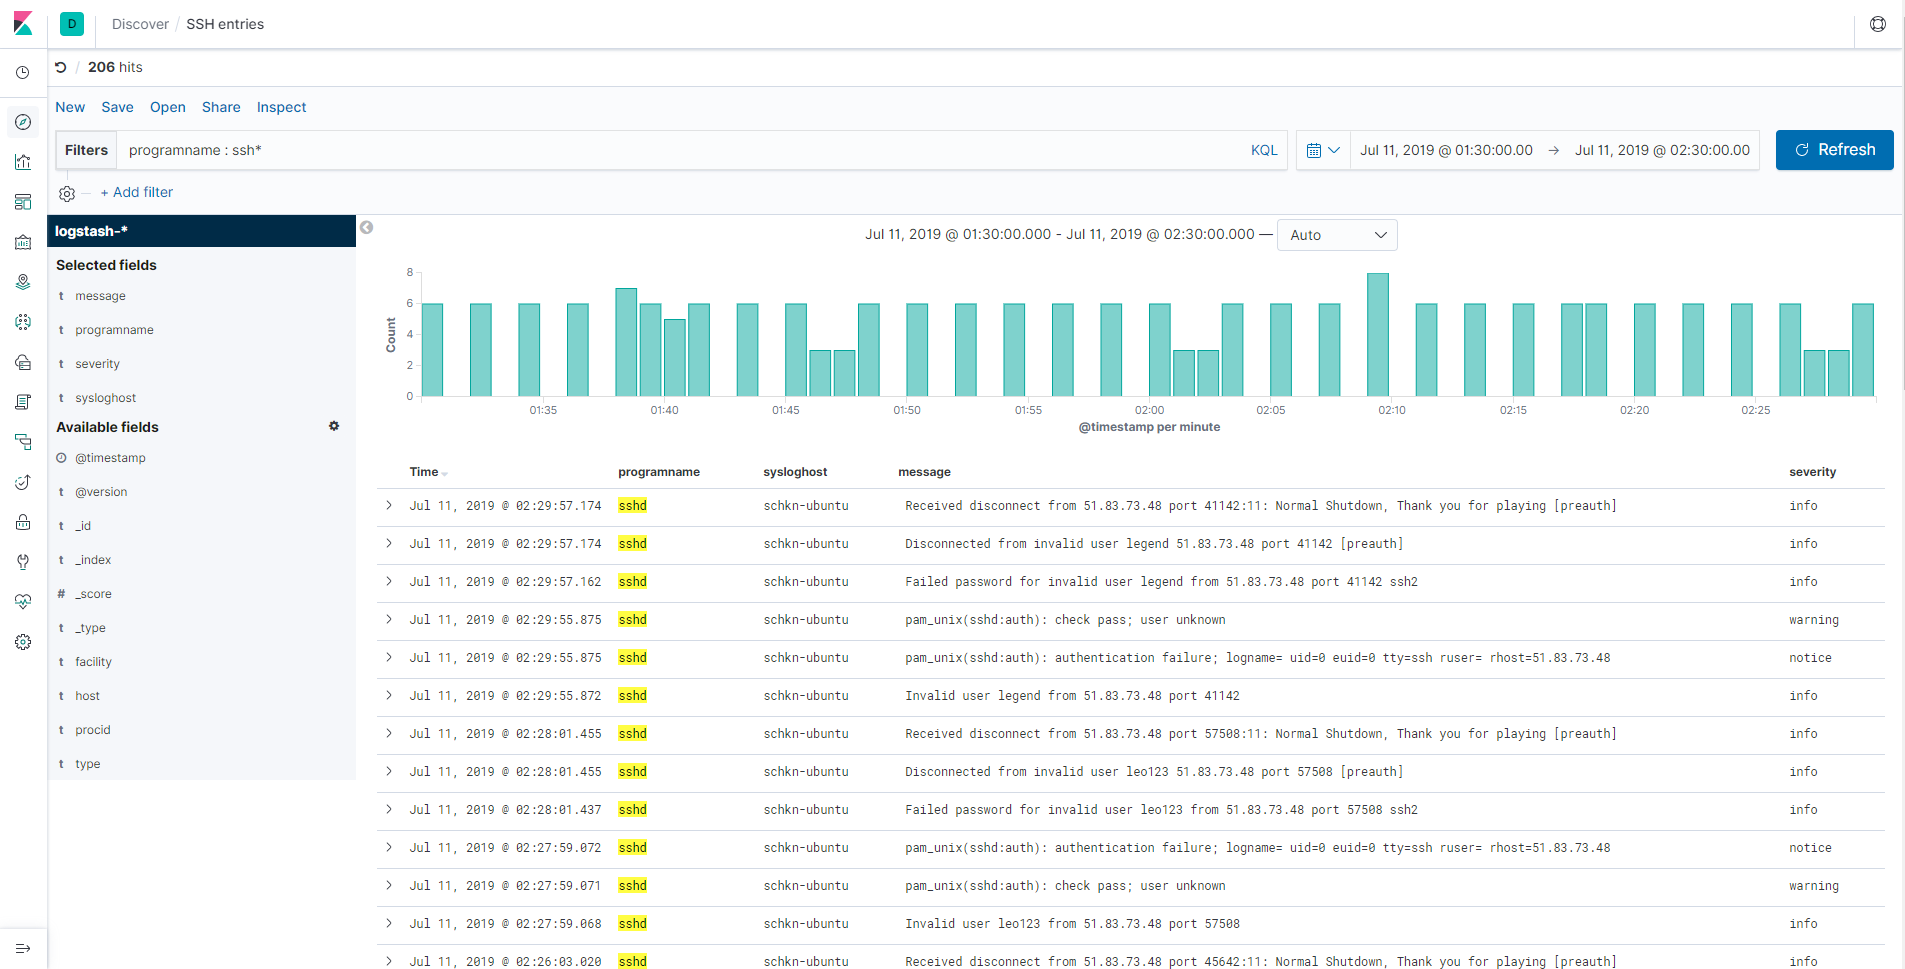
Logstash is a core part of the ELK (Elasticsearch, Logstash, and Kibana) Stack, an open-source log management tool and data analytics tool. Logstash, as the log collection engine, collects and unifies data from several sources before sending it to other destinations, usually Elasticsearch, though it can also send data to other destinations for further processing and analysis.
One major advantage of Logstash is its ability to aggregate data from various sources and the flexibility it provides with a large number of plugins. Logstash can retrieve data from virtually any data origin by using its input plugins, execute various data modification functions through filter plugins, and then transmit the processed data to multiple destinations via output plugins. Despite these benefits, Logstash has certain drawbacks, which we will look at in the section below.
Limitations of Logstash
Let’s look at the limitations of Logstash that may make you want to consider using its alternatives.
- The biggest drawback of using Logstash is its resource-intensiveness. Logstash uses much more memory compared to other log shippers and open source logging tools, and this makes it unsuitable to handle large volumes of data as it leads to performance overhead.
- Due to its resource-intensiveness, Logstash tends to be slower than alternatives. Comparative benchmark tests have shown Logstash to be slower than alternatives like Rsyslog and Beats.
- Logstash is entirely command-line and does not have a graphical user interface. While it works well with Elasticsearch and Kibana to visualize its data, it can be challenging to use and configure, particularly for complex use cases.
- Logstash might also be difficult to troubleshoot at times, resulting in maintenance challenges.
Top 11 Logstash Alternatives
SigNoz
SigNoz is an open-source observability platform for monitoring applications that allows you to aggregate, store, analyze, and visualize your application data. SigNoz uses OpenTelemetry for collecting telemetry data and supports all frameworks and programming languages supported by OpenTelemetry. Data can be sent from applications directly to the SigNoz Otel collector or external OTel collectors can be used for collecting telemetry data & sending it to the SigNoz Otel collector.
SigNoz provides an easy way to get started through the SigNoz Cloud, with which you don’t need to install or manage the infrastructure. It also provides the option of self-hosting on macOS or Linux computers.
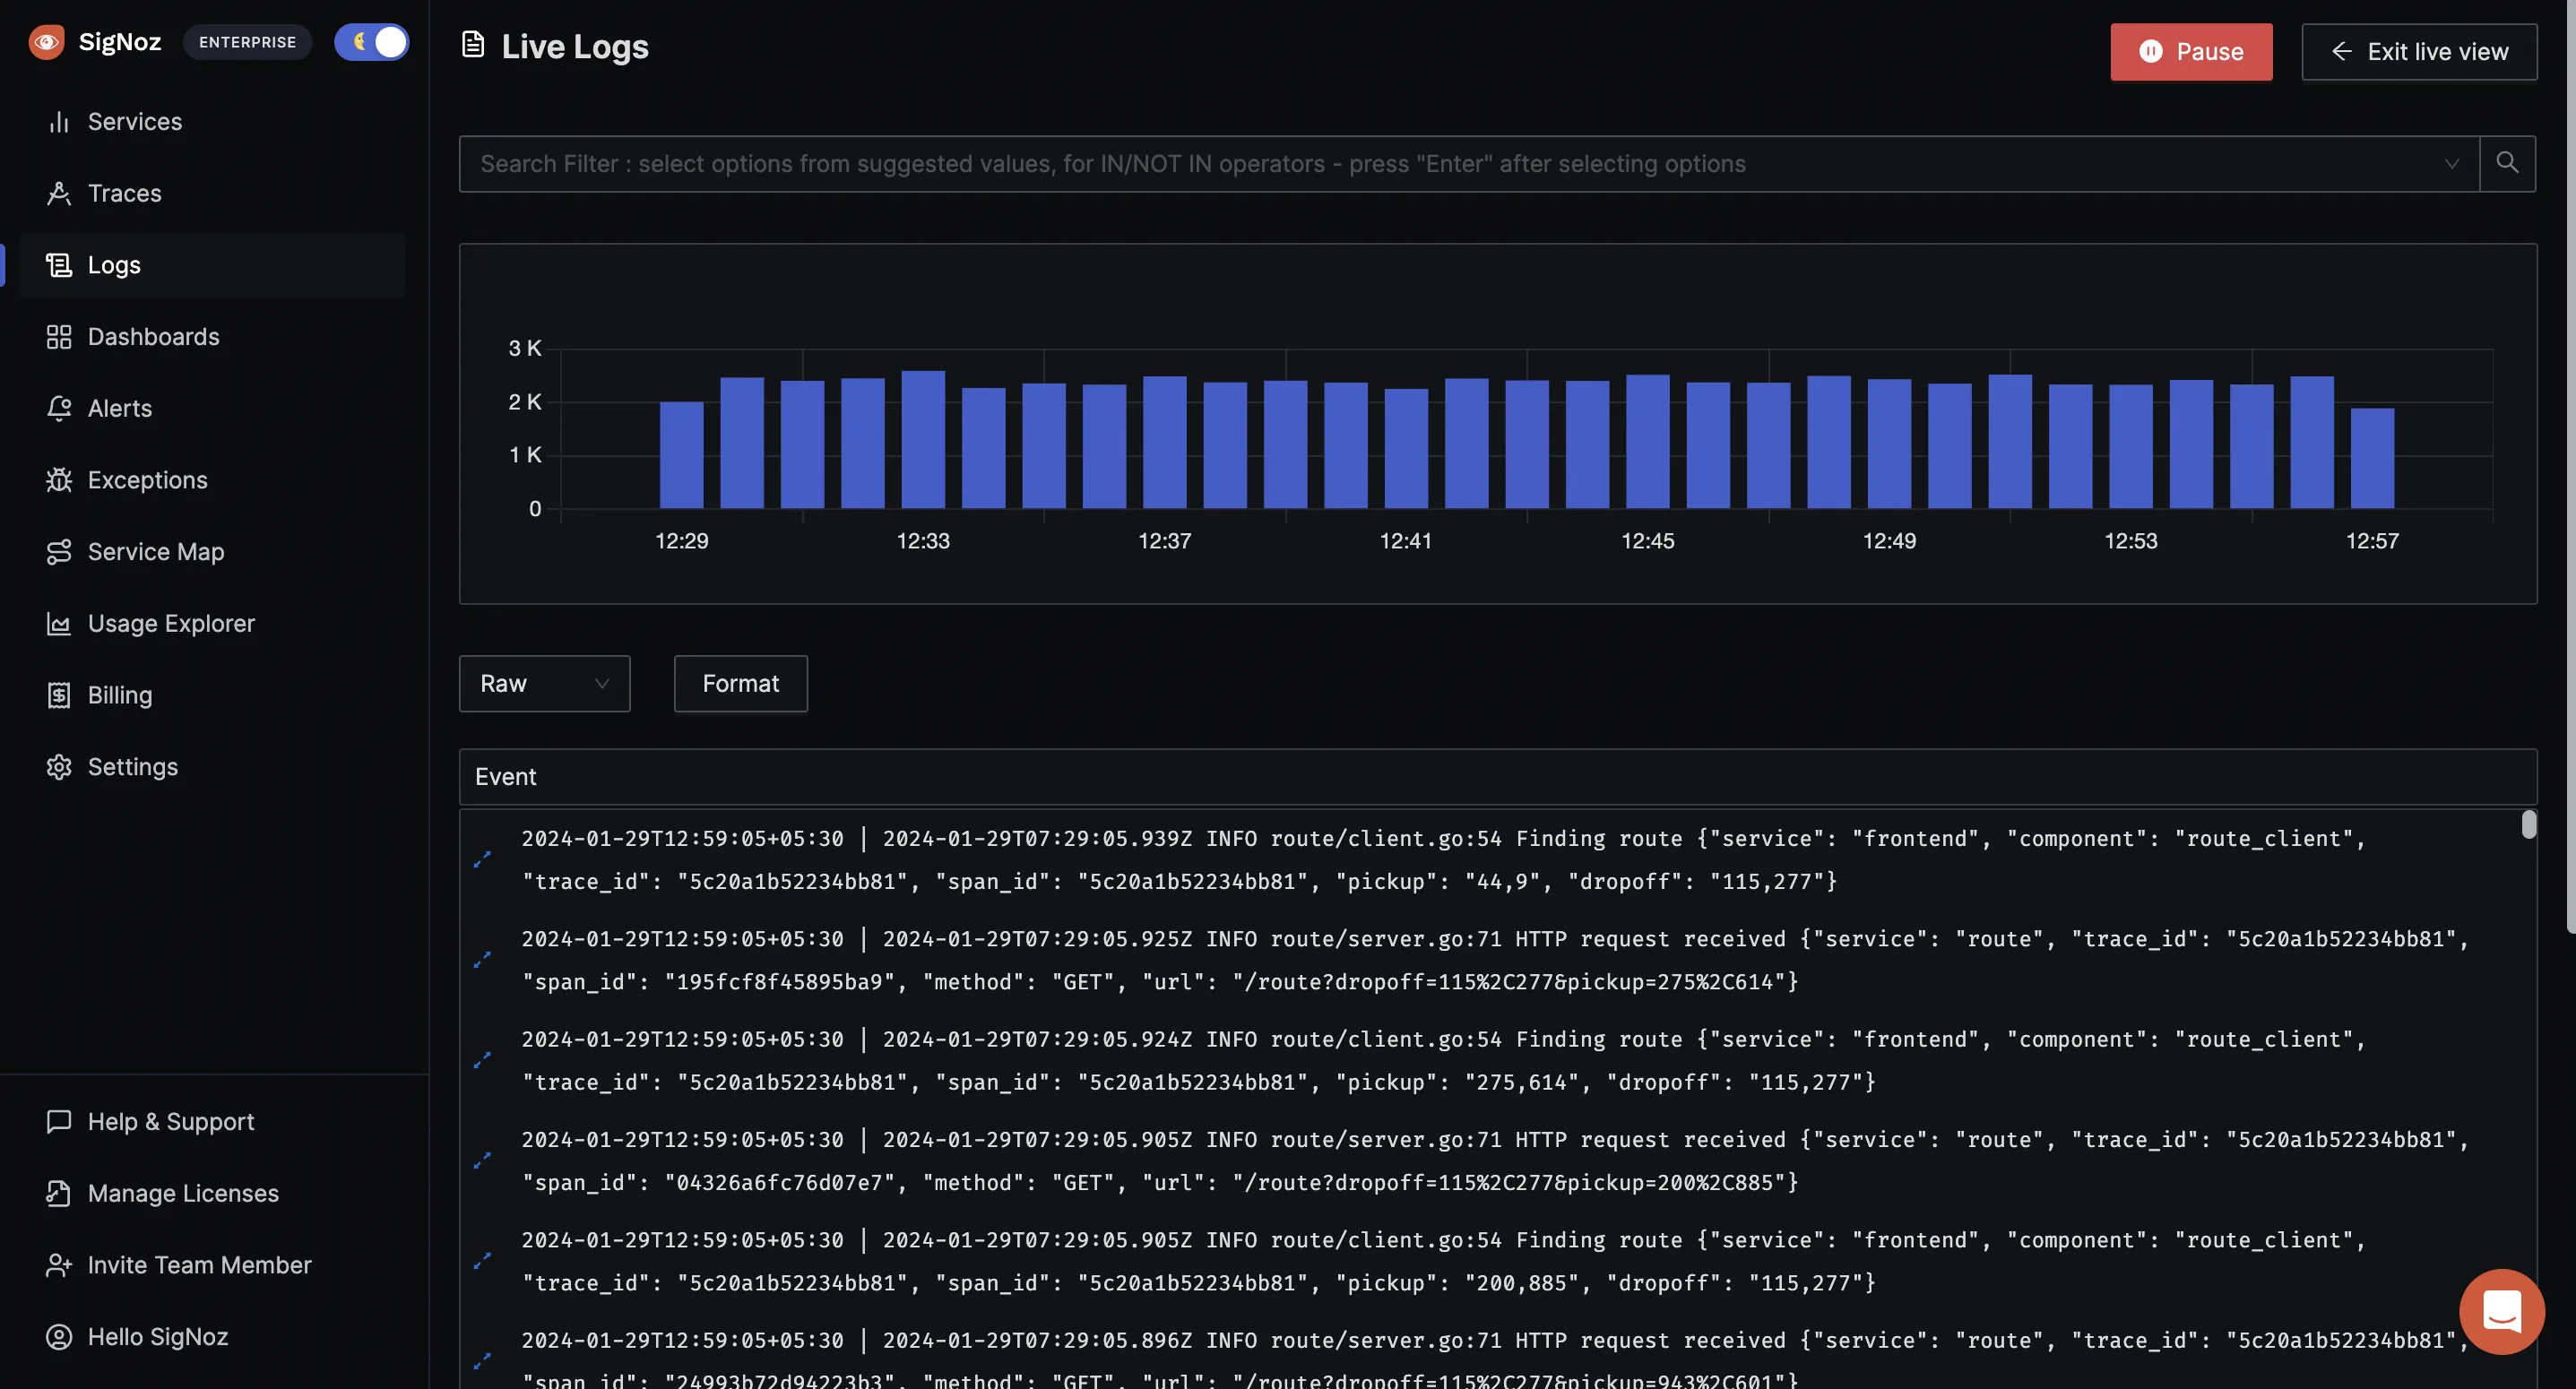
One of the features that makes SigNoz a great alternative to Logstash is that it lets you collect, analyze, and visualize Traces, Metrics, and logs all in a single application.
Other features:
- SigNoz makes it easy to set alerts with its DIY query builder; you can create dashboards and alerts with a single click from its log query builder.
- SigNoz enables advanced filtering and querying capabilities for easier log management.
- It monitors application and infrastructure data, including p99 latency, error rates for your services, external API requests, and specific endpoints, as well as CPU and memory use.
- SigNoz also allows you to set independent retention periods for metrics, traces, and logs.
- With its self-hosted option, SigNoz enables easy configuration and also allows configuration with different options such as Kubernetes logging, Docker Standalone, and Docker Swarm.
Pricing
SigNoz offers a cheap price of $49 per month for SigNoz Cloud, after a 30-day free trial, and offers flexible pricing for enterprises and large businesses.
For self-hosted options, the Community Edition can be self-hosted for free; however, the Enterprise Edition, for organizations that may want to host SigNoz in their infrastructure, has a custom price starting at $2500/month.
Graylog
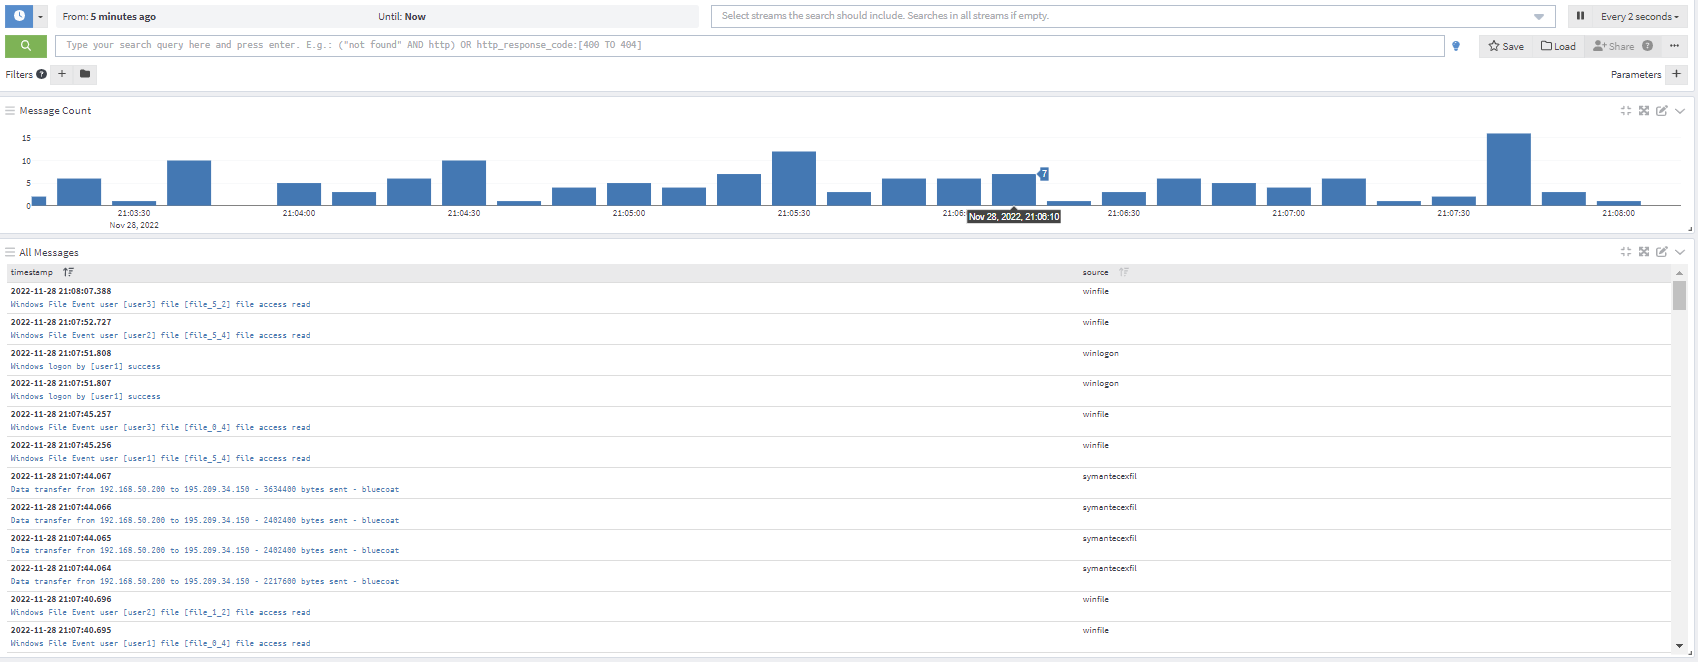
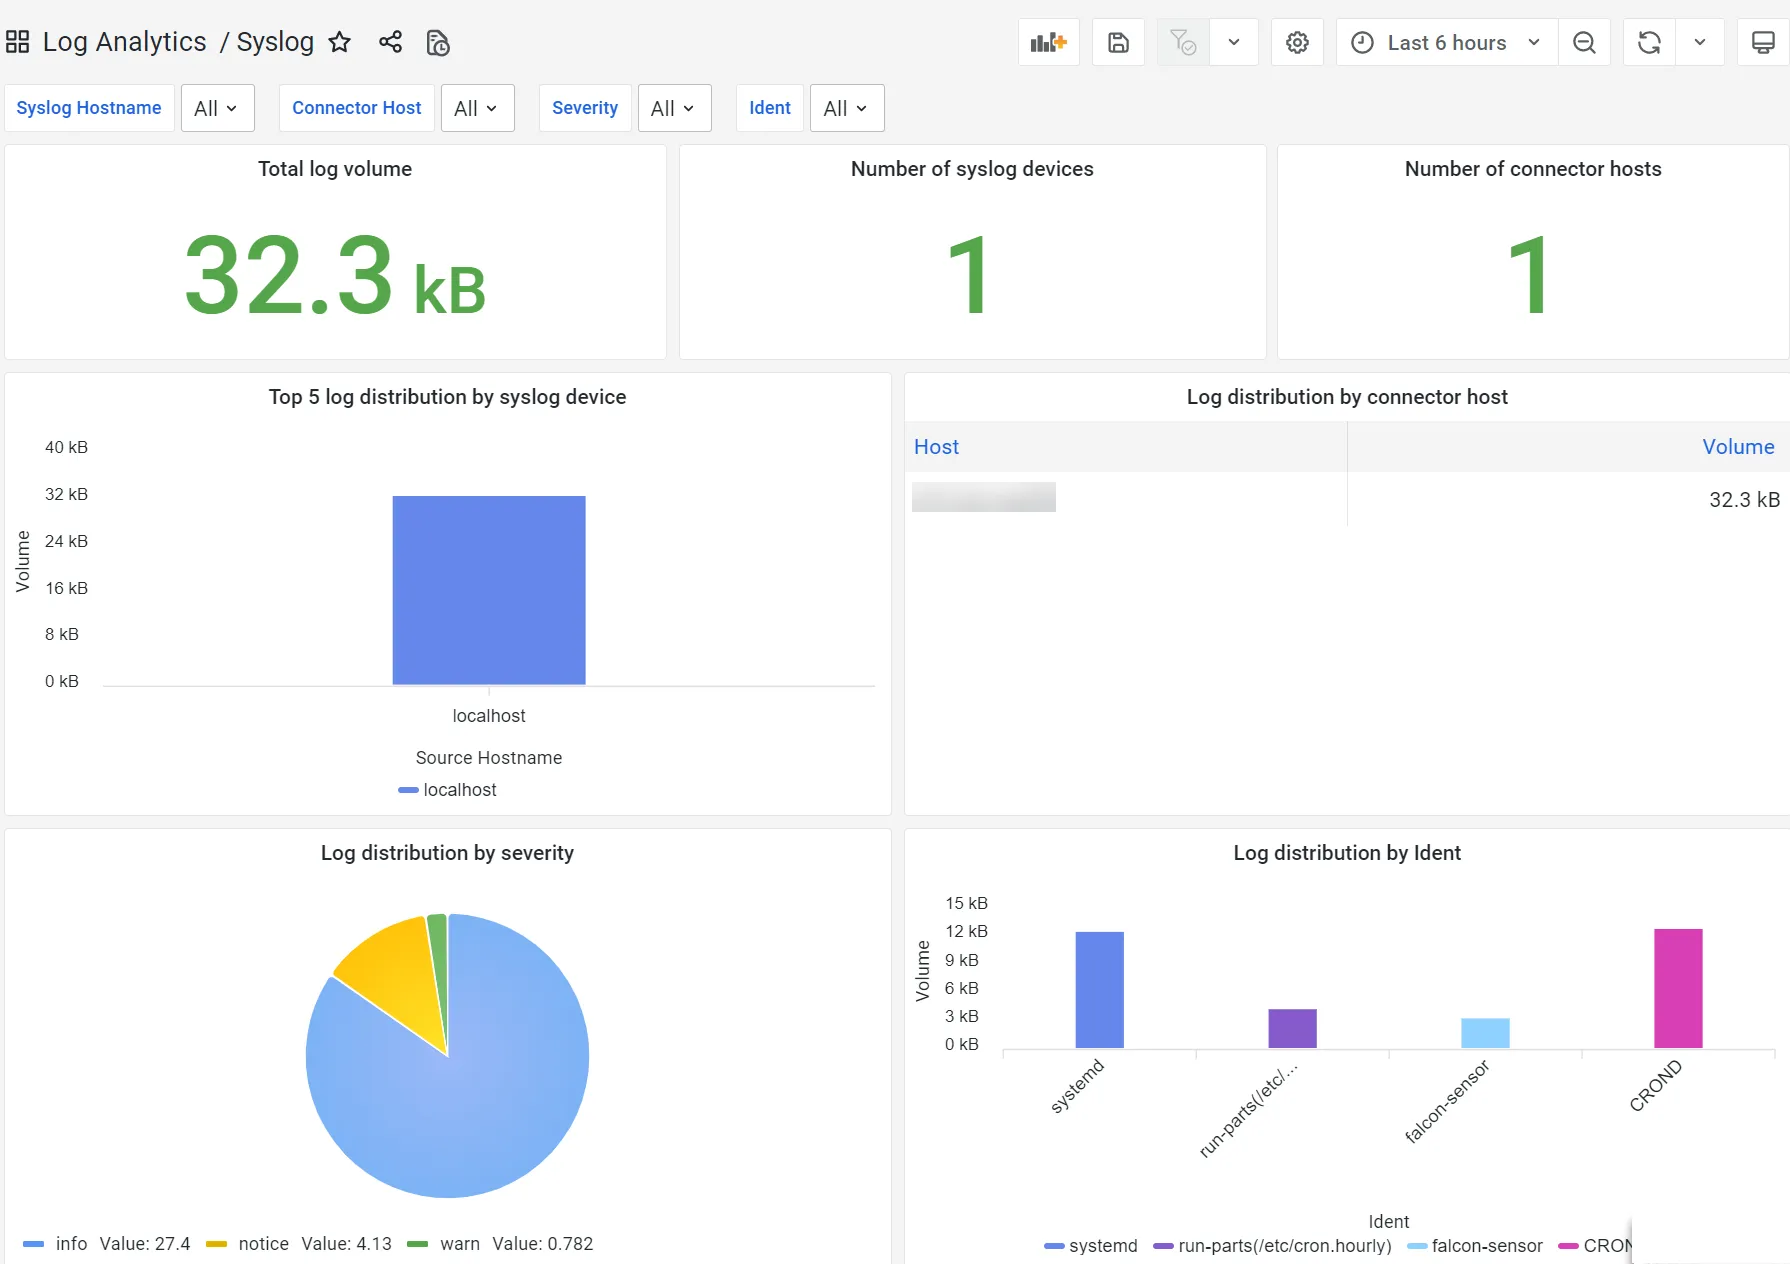
Graylog is a comprehensive open-source platform that provides a centralized log management capability. This capability enables data capture, storage, and real-time analysis and also allows teams to gain insights into the security of the application and IT infrastructure. One of its core functionalities is that the Graylog operations provide the core centralized log management functionality needed to aggregate, organize, and interpret data.
Graylog provides the easy option of utilizing it through the Graylog Cloud and allows users to self-host and manage Graylog on Linux distributions (Ubuntu, Debian, RHEL/CentOS, SUSE, or Docker).
Features of Graylog
- Graylog enables fast querying of logs.
- It also supports various widgets that let you quickly visualize data from your logs.
- Graylog allows you to create rules that can route, filter, and alert on log data based on your defined criteria.
- It supports advanced data aggregation, which allows you to combine different types of data in a single chart. This allows you to perform multiple aggregations on the same field and/or present different types of aggregations on different fields in the same chart.
- It lets you easily create, set up, or schedule reports based on the dashboard chart.
Pricing
The pricing of GrayLog Operations starts at $1250 per month, limited to 10GB per day. Its open (free) version can be downloaded and used for free; however, it is limited to 2GB per day with no technical support. If these caps feel restrictive, our Graylog alternatives roundup covers options with more generous free tiers.
Beats
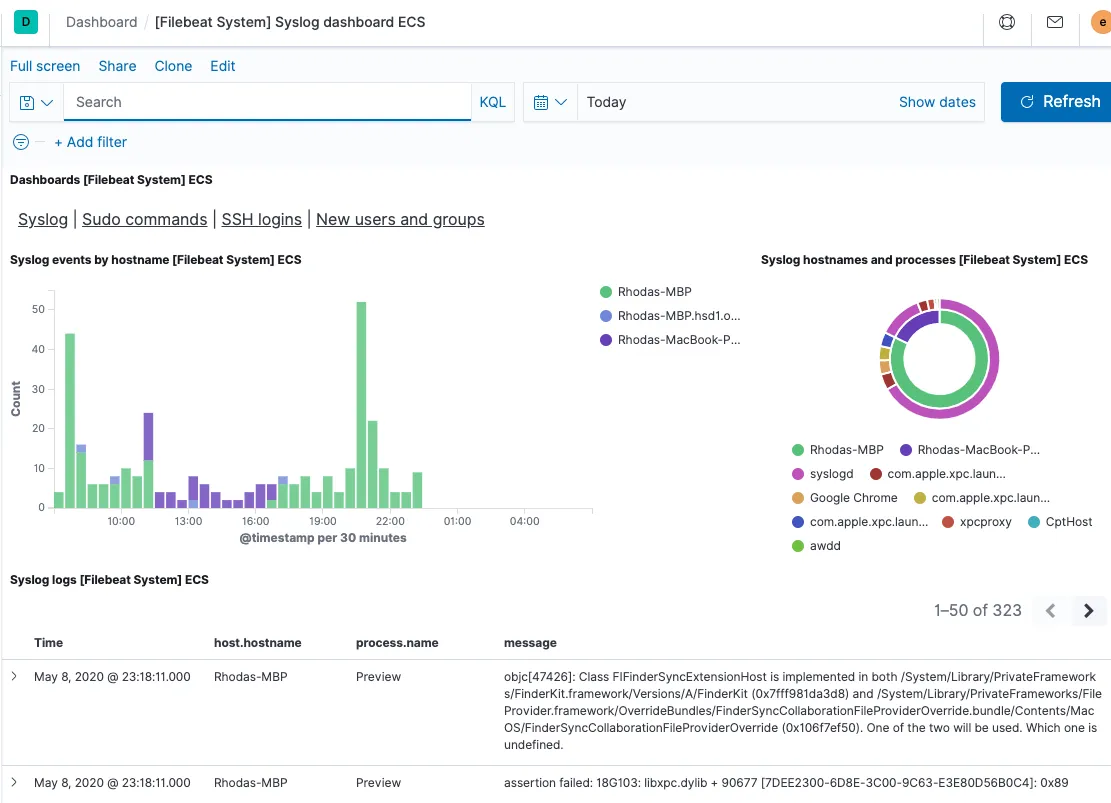
Beats is a family of open-source lightweight shippers in the Elastic Stack ecosystem that collects and sends data to Elasticsearch for further processing. They can also be integrated with Logstash. The various shippers in the Beats family serve different functions, providing separate Beats for different types of data such as logs, metrics, and uptime monitoring. These shippers include:
- Filebeat: for log events,
- Metricbeat: for metric data,
- Packetbeat: for network data,
- Winlogbeat: for Windows event logs,
- Auditbeat: for audit data, and
- Heartbeat: for uptime monitoring.
Beats are highly lightweight with few dependencies, making them easy to install on servers, containers, or deployed as functions.
Features of Beats
- Lightweight nature.
- Flexibility with the number of shippers: you can install multiple shippers from the family to send observability data, enabling various use cases such as log analysis, system monitoring, network analysis, and security analysis.
- Apart from the six shippers in the Beats family, Beats also boasts a large community of open-source custom beats and allows you to build your custom beat using libbeat, a library for forwarding data.
- Beats also enable the parsing and visualization of data in Filebeat and Metricbeat.
Pricing
Beats can be downloaded and self-hosted for free. It can also be consumed as a cloud-managed service through the Elastic Cloud, which charges $95 per month for standard usage, $109 per month for gold, $125 per month for platinum, and $175 per month for enterprises, all with varying features and amounts of support.
Splunk
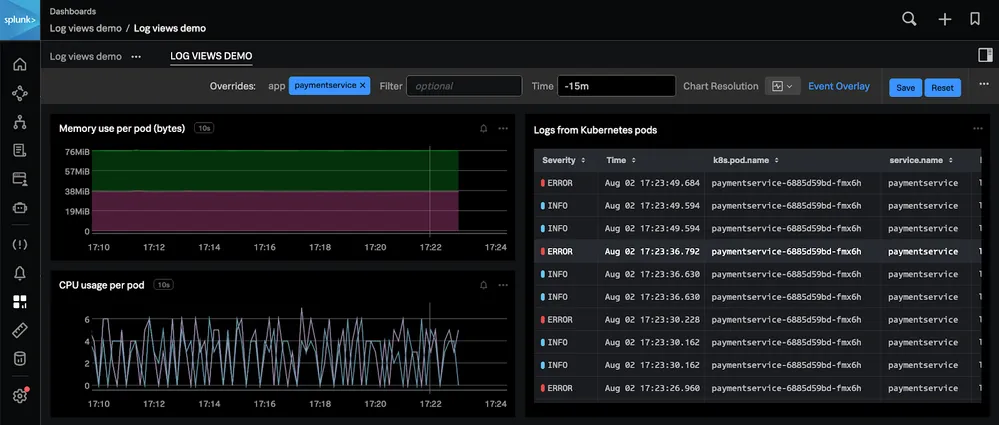
Splunk is a comprehensive platform that provides security and observability features. Splunk Enterprise, one of Splunk's solutions, is software that enables the collection, indexing, search, analysis, and visualization of data from various sources, including websites, applications, sensors, databases, network devices, and more. With Splunk Enterprise, you can search and analyze large amounts of data in real time, and it provides pre-built visualizations to help you quickly create informative dashboards.
Users typically access Splunk Enterprise via a web browser using Splunk Web. Alternatively, you can administer your Splunk Enterprise deployment using the command-line interface.
Features
- Its user-friendly graphical interface allows users to easily create custom dashboards for organizing and sharing data, as well as integrate it into other applications.
- Splunk also enables monitoring, alerting, and reporting.
- Splunk provides a search processing language that supports both simple searches and advanced data exploration.
- With Splunk's Machine Learning Toolkit (MLTK), teams can develop custom machine-learning models.
Pricing
Splunk provides a flexible way of paying based on how much data you bring in or computing your workload demand through the options of workload pricing and ingest pricing. That said, costs can escalate quickly at scale, for a detailed cost comparison, see our Splunk alternatives guide.
Atatus
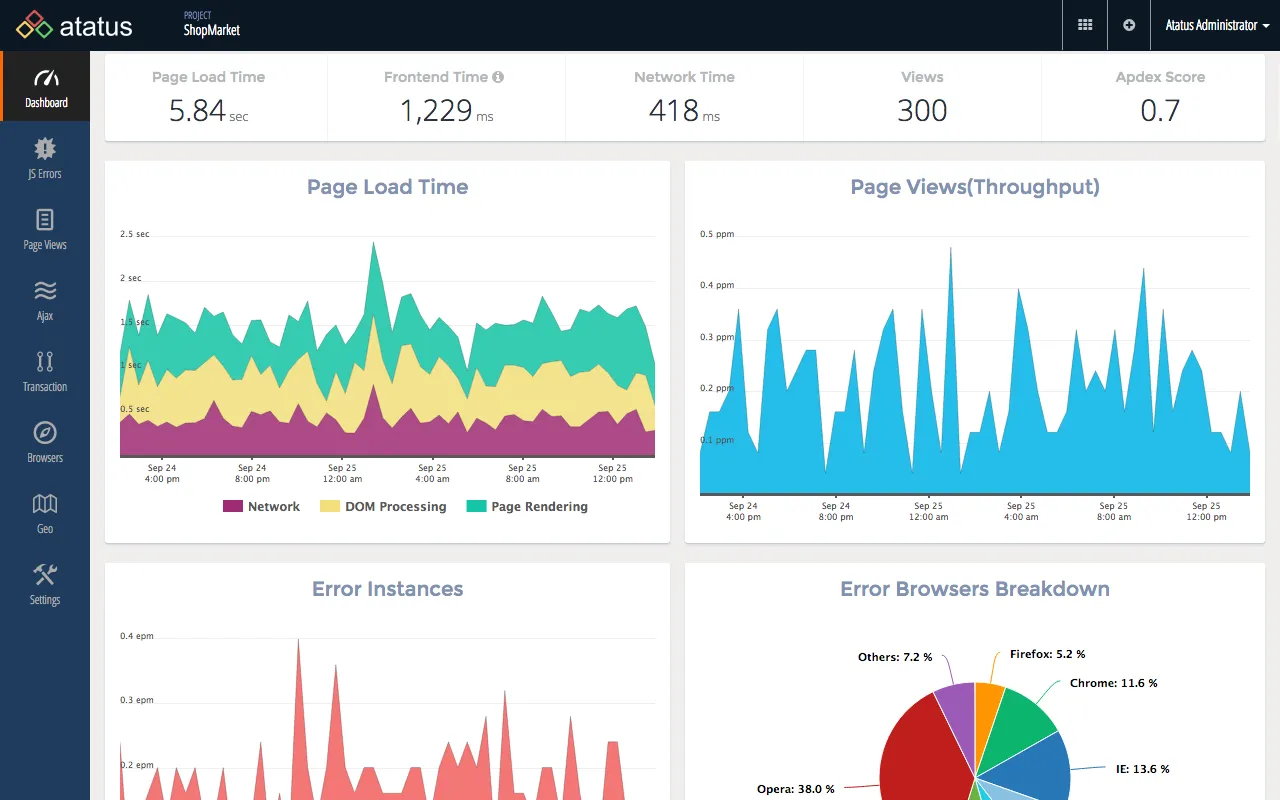
Atatus is a comprehensive observability platform that provides full-stack application monitoring. Atatus simplifies log monitoring monitors as it can aggregate logs from various sources, process all your logs, generate metrics, and visualize log data all from one central place, enabling easy analysis and troubleshooting. Data is monitored and collected by Atatus through agents, which can be installed on either the host or the application. Atatus supports many agents and works on major frameworks, programming languages, Linux distributions, and MacOS.
Features
- Atatus is capable of collecting data logs, traces, and metrics from a wide range of sources, including log files, servers, applications, networks, and security devices.
- It provides visualization and enables easy filtering and query of data.
- It can integrate with various external databases, such as MySQL and SQL Server.
- Atatus enables controlled retention of the log messages. It allows you to move older logs to cheaper storage tiers.
Pricing
For each type of monitoring it supports, Attatus has different pricing: application monitoring: $0.07 per host hour/month, real-user monitoring: $1.9610K Views/month, infrastructure monitoring: $0.021/host Hour/month, log monitoring: $2 per GB/month; synthetic (uptime) monitoring: $1.5per 10K Check Runs/month; analytics: $1 per 10K Events/month
Rsyslog
Rsyslog is an open-source, lightweight log processing system based on the syslog protocol that offers high performance and provides a wide array of advanced log management features. It can accept inputs of various types from a wide variety of sources, transform them, and output the results to diverse destinations.
Rsyslog is a popular shipper with Linux distributions as it mostly comes preinstalled with its dependencies.
Features
- Direct support for various databases, including MySQL, Postgres Firebird, Interbase, MS SQL, SQLite, Oracle, and more, via libdbi, enhances flexibility and compatibility.
- Rsyslog provides features like TCP-based syslog, compressed message support, and on-demand disk spooling, ensuring reliable message delivery and efficient handling of large volumes of data.
- It also provides advanced features like SNMP trap messaging, CSV output generation, and support for complex boolean expressions in message filters.
- Rsyslog offers extensive customization options, including advanced filtering based on message content, support for regular expressions, and dynamic file naming.
Pricing
Rsyslog is open-source and can be downloaded freely.
Syslog-ng
Syslog-ng is an open-source log management solution that allows you to collect, parse, classify, rewrite, and correlate logs from across your infrastructure and store or route them to other destinations. While it is built on syslog, it has features that go beyond the fundamental syslog functionality and can be customized with plugins to fit any use case.
Features
- Syslog-ng simplifies log storage by supporting a variety of databases such as SQL (MySQL, PostgreSQL, Oracle), MongoDB, and Redis, giving you more options for storing log messages.
- It enables the correlation of logs from multiple sources into a unified format.
- It also works with both structured and unstructured data.
- Syslog-ng supports protocols such as Advanced Message Queuing Protocol (AMQP) and Simple Text Oriented Messaging Protocol (STOMP), which enable dependable message delivery and queuing for simplified log processing.
Pricing
Syslog-ng is open-source and can be downloaded freely. Its premium edition has varying pricing
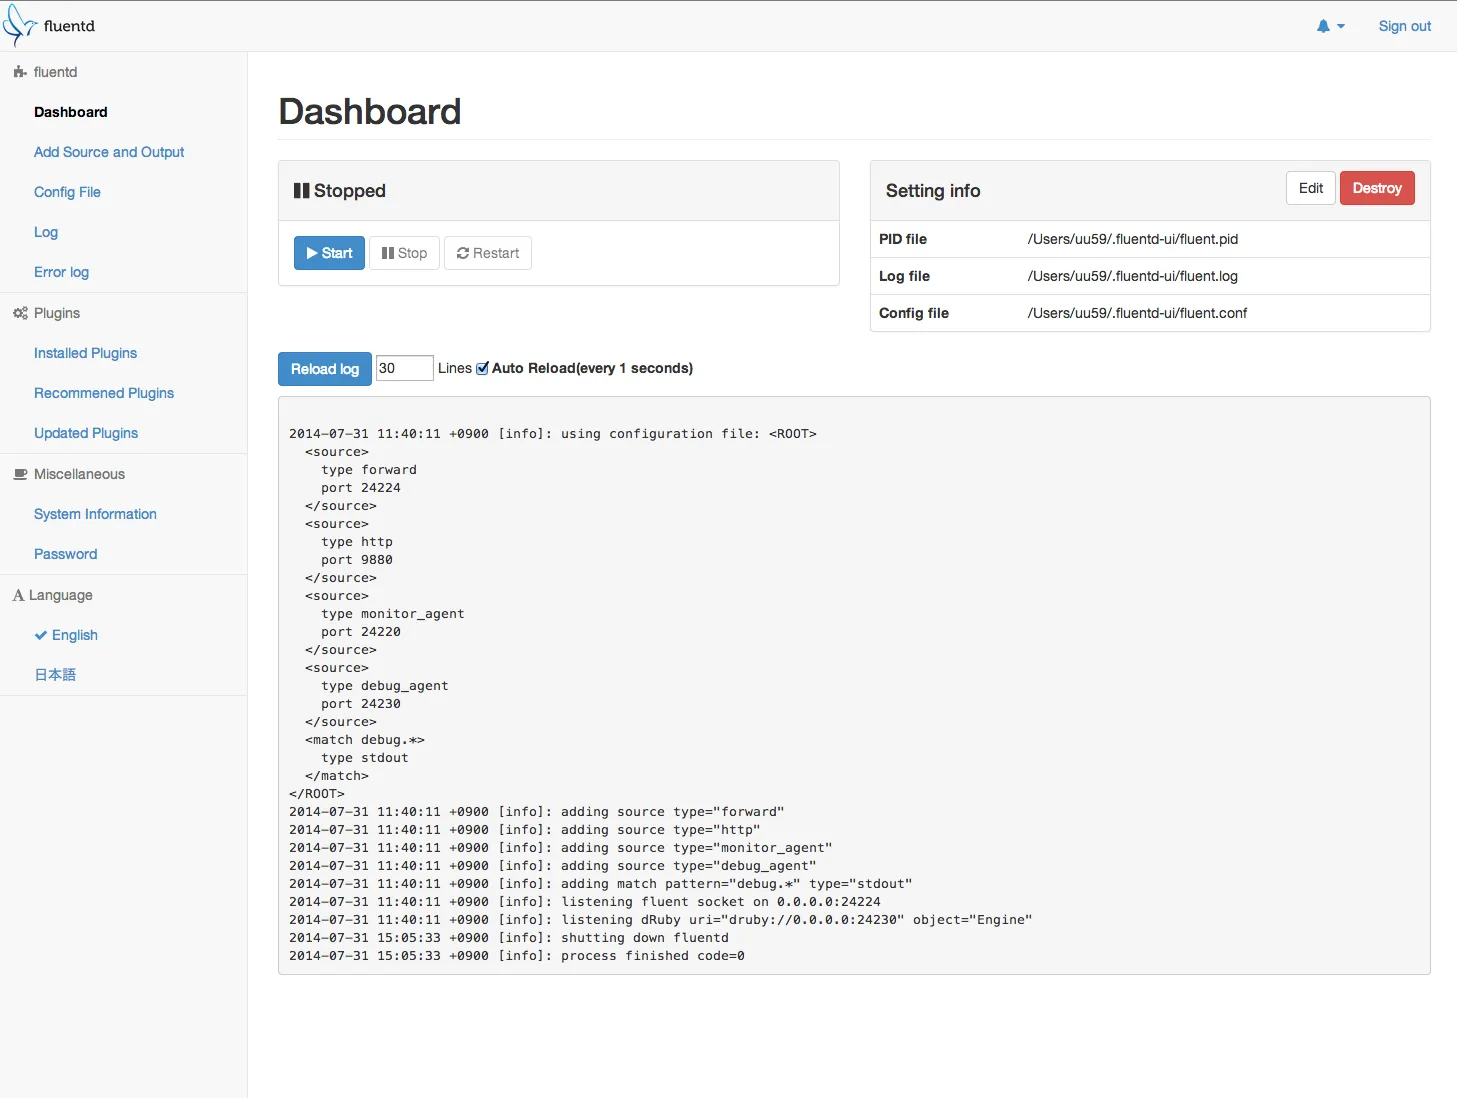
Fluentd
Fluentd is an open-source data collector capable of collecting, parsing, transforming, analyzing, and storing various types of data. It prioritizes structuring data as JSON, which enables it to successfully combine all parts of log data processing, including collecting, filtering, buffering, and distribution across multiple sources and destinations. For a detailed head-to-head with the tool this article replaces, see Fluentd vs Logstash. Fluentd also provides a vast range of plugins for gathering data from various sources and storing it in multiple destinations.
Features
- Fluentd structures data as JSON to unify processing log data across multiple sources and destinations, and this makes data processing easier.
- Fluentd features a flexible plugin system of over 500 community-contributed plugins.
- It requires minimal system resources. A single instance can handle 13,000 events per second per core while using 30–40 MB of RAM. It also provides the option of Fluent Bit, a lightweight forwarder for Fluentd, for even stricter memory needs (less than 450kb).
- It also offers robust failover capabilities and can be configured for high availability.
Pricing
Fluentd is fully free and fully open-source.
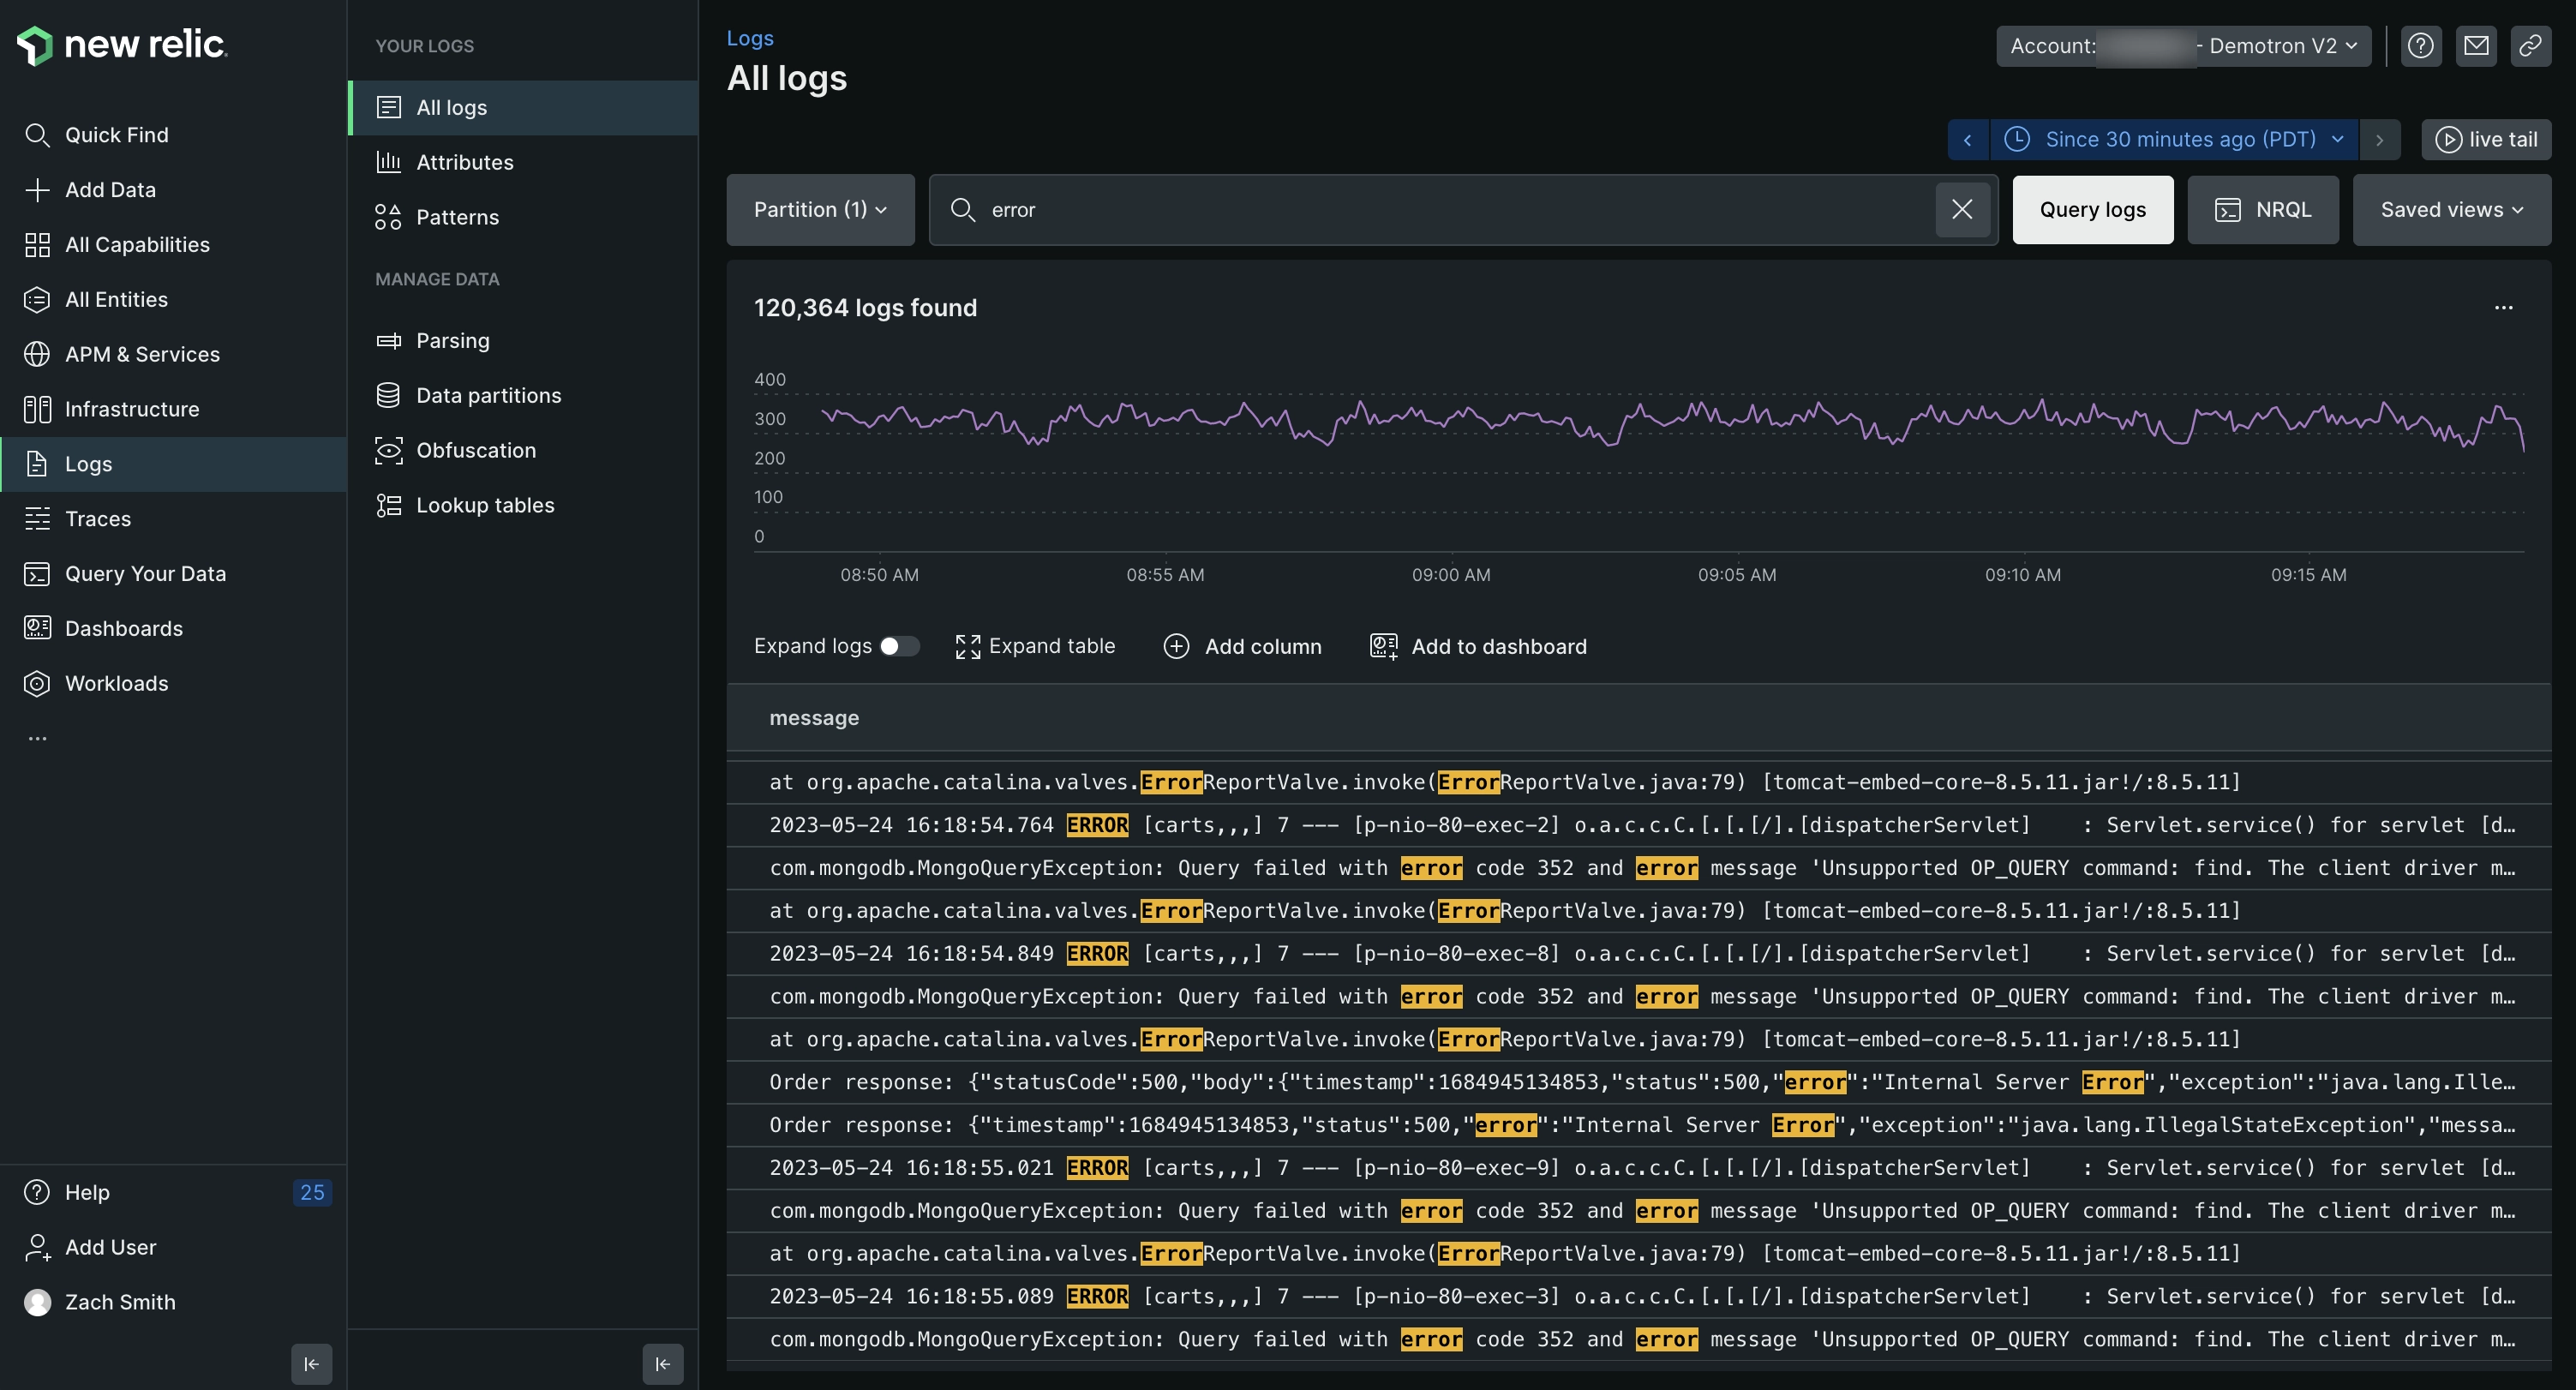
New Relic
New Relic is a cloud-based monitoring and observability software solution that offers a fast, scalable log management platform to collect and connect your logs with the rest of your infrastructure data in a single place. This log management solution provides deeper visibility into both application and infrastructure performance data, including events, errors, traces, and more.
New Relic gathers data using agents and provides four major types of agents: APM agents: For server-side applications, Browser agents: For browser applications, Infrastructure agents: For hosts and on-host integrations, Mobile agents: For mobile applications.
Features
- New Relic includes pre-defined alerts, but you can also create your own. It allows you to receive alerts through tools like PagerDuty, ServiceNow, Jira, Slack, and more
- It provides visualization and customization of data through dashboards and charts, enabling efficient data monitoring and analysis.
- It stores historical logs and telemetry data for instant access without reloading or re-indexing.
- It monitors service health and performance, including containers and cloud infrastructure. Also tracks CPU, memory, network traffic, disk use, etc..
Pricing
New Relic offers a free plan which is limited to 100GB of data ingest per month. The paid plans, which have more features and higher limits, are priced at $49/user for core users. Then $99/per user, $349/user, and $549/per for standard, pro, and enterprise options for full-platform users
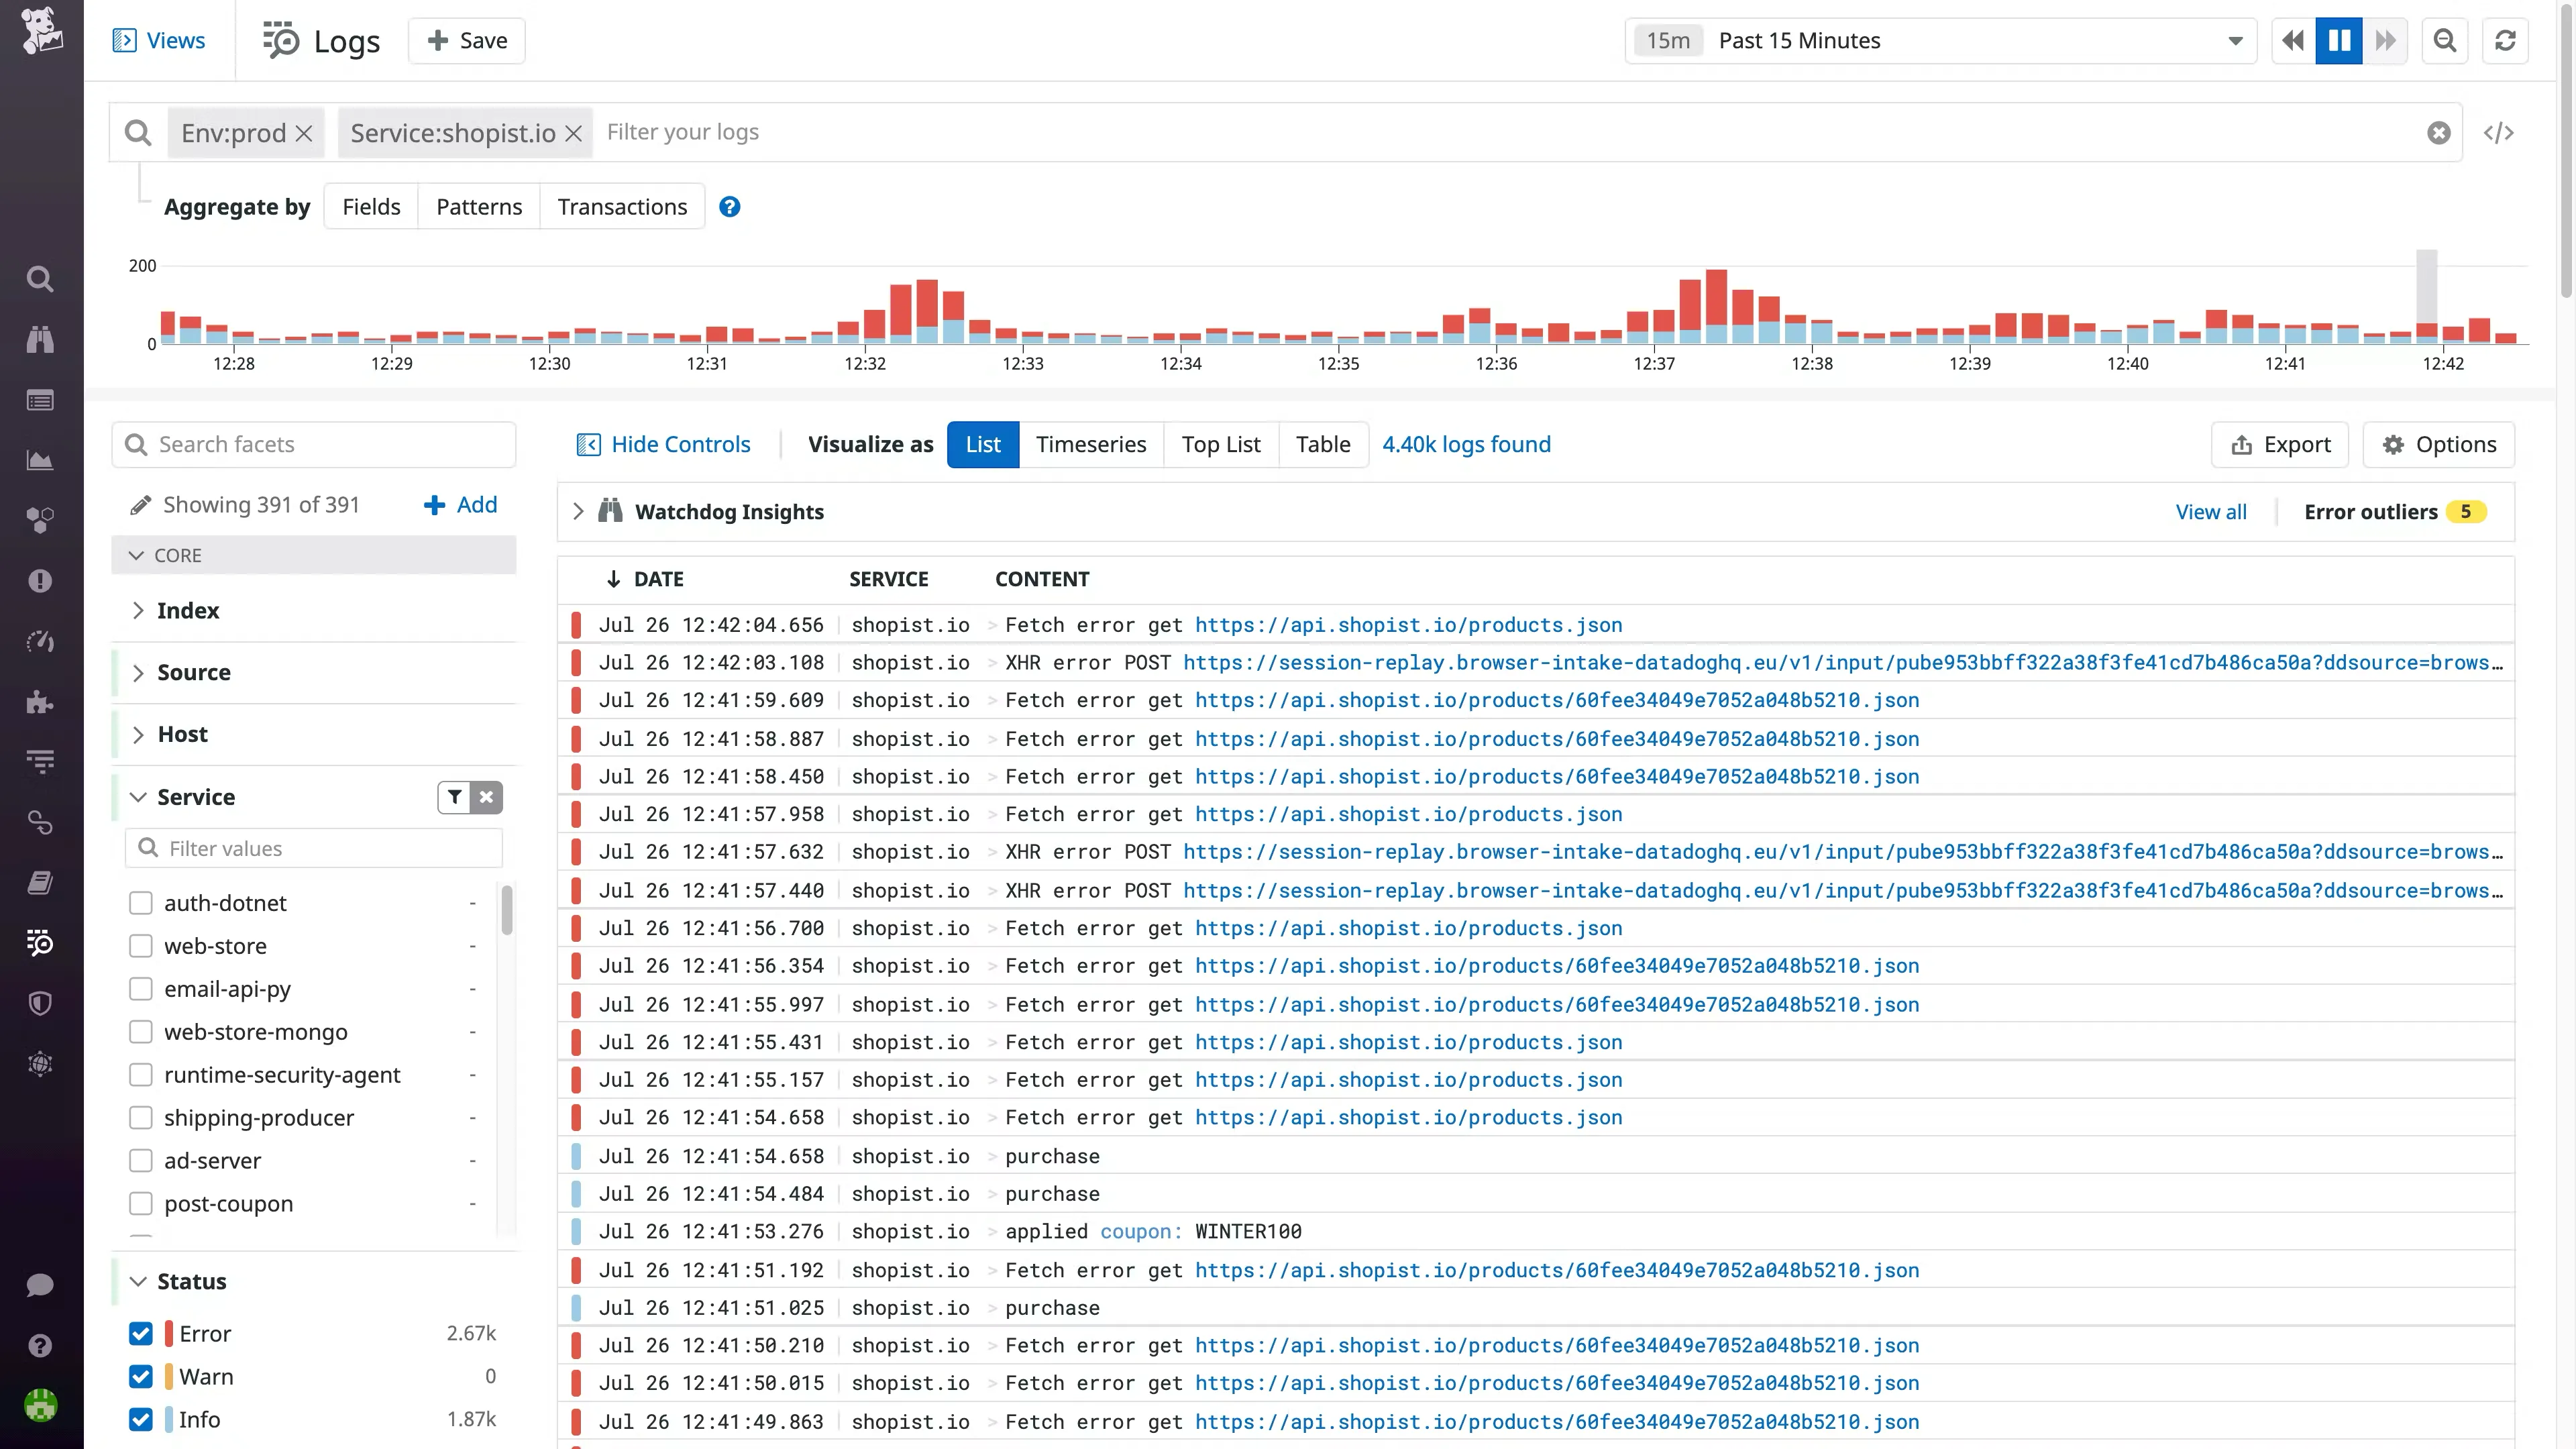
Datadog
Datadog is a cloud-based monitoring and analytics software solution that provides real-time insights into IT infrastructures. It monitors infrastructures, applications, logs, and other data sources in a unified manner, collects data from these sources, and then uses it to create customizable dashboards, alerts, and reports that provide a comprehensive view of the entire infrastructure. It collects events and metrics from hosts with the Datadog agent, which can be local hosts (Windows, MacOS), containerized environments (Docker, Kubernetes), or on-premises data centers. While this tight agent integration simplifies setup, it can also deepen vendor dependency, something many teams weigh when evaluating Datadog alternatives.
Features
- Datadog enables rapid troubleshooting and analytics with no querying language.
- With Datadog, you can aggregate, process, and route all your logs from one application.
- It also stores all logs at any retention and querying capacity.
- It supports seamless integration with external tools and technologies.
Pricing
Datadog offers a free plan with limited features, a pro plan starting at $15 per host per month, and an enterprise plan starting at $23 per host per month.
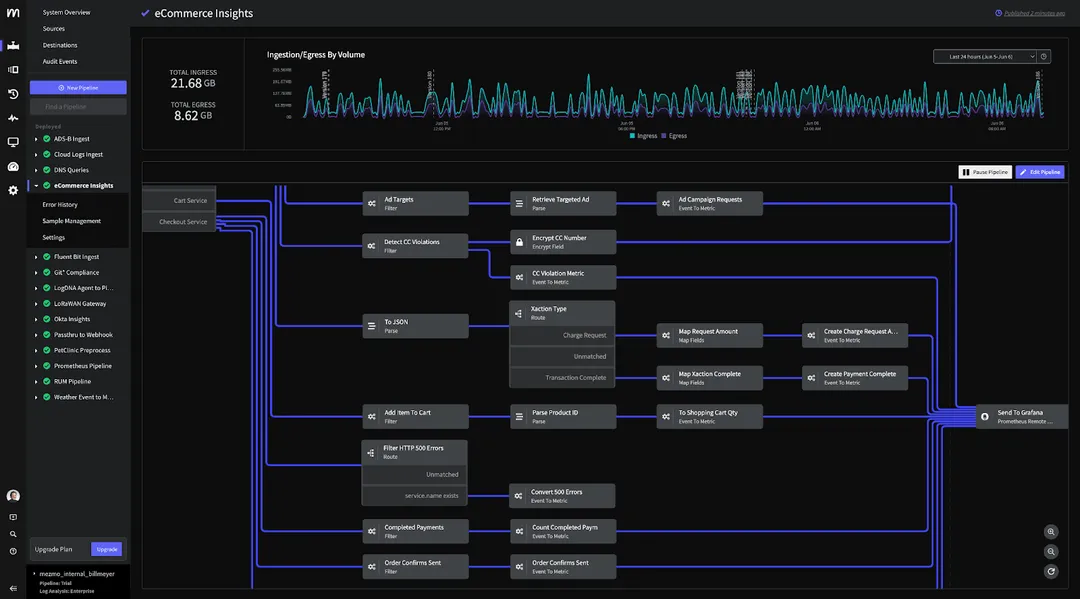
Mezmo
Memzo is a cloud-based log management and analysis platform that provides a telemetry pipeline for ingesting data from multiple sources, parsing it, and seamlessly routing it to various destinations. It also enables the analysis, easy search, filtering, and visualization of log data. Memzo can incorporate data from existing log analysis environments or entirely new data streams, making it easy to aggregate log data with its support for a broad range of ingestion options such as the logging agent, the CLI, the client-side logger, integrations with other logging platforms, code libraries, and REST API.
Features
- Memzo automatically parses logs as it ingests them. It also provides the option of parsing logs using custom templates and allows you to analyze logs using its advanced search features.
- It also provides powerful exclusion rules that let you prioritize the right log data for routing.
- Memzo can archive log data for longer periods and allows for variable retention to prioritize specific types of logs.
- Alerts can be easily configured.
- It provides spike-prevention features that allow you to create dynamic thresholds and receive notifications when data volume limitations are exceeded.
Pricing
Memzo offers a free plan with limited features and a more advanced paid custom plan for the Telemetry Pipeline.
For Log Analysis, there are two pricing options in addition to a free, limited plan: the Professional plan, which starts at $0.80 for each ingested gigabyte and includes three days of retention (the price per GB will increase as retention increases), and the Enterprise plan, which is a custom plan.
Factors to Consider When Choosing Between Logstash Alternatives
When considering alternatives to Logstash, several factors should guide your decision-making process. First and foremost, consider your specific needs and requirements. Ensure that the features offered by a particular alternative or tool can cater to your application's needs. Resource utilization and performance are also important factors to consider, especially when handling large data volumes.
Moreover, factor in scalability, ensuring the solution can grow with your needs, and consider the availability of robust technical and community support. Also, consider the ease of use and configuration. Lastly, ensure that the cost and pricing align with your budget.
Now that we have reached the end of the article, you should be able to decide on an option among the top alternatives we have explored. If you're looking for a complete tool that can meet all of your requirements and needs, SigNoz is an excellent choice.
Getting started with SigNoz
SigNoz Cloud is the easiest way to run SigNoz. Sign up for a free account and get 30 days of unlimited access to all features.

You can also install and self-host SigNoz yourself since it is open-source. With 24,000+ GitHub stars, open-source SigNoz is loved by developers. Find the instructions to self-host SigNoz.
