Overview
In this documentation, you will learn how to monitor Azure App Service's system metrics like CPU Percentage, Memory Percentage, Data In, and Data Out with SigNoz. By monitoring these metrics, you can keep track of your application's resource utilization and performance.
For application-level traces and metrics, you can use the DNS name of the OpenTelemetry Collector you set up earlier. Simply configure your application to send traces and metrics to the Central Collector, and they will be forwarded to SigNoz automatically.
Prerequisites
Before you can monitor your Azure App Service with SigNoz, you need to ensure the following prerequisites are met:
- Azure subscription and an Azure App Service instance running.
- Central Collector Setup
Dashboard Example
Once you have completed the prerequisites, you can start monitoring your Azure App Service's system metrics with SigNoz. Here's how you can do it:
- Log in to your SigNoz account.
- Navigate to the Dashboards, and add an dashboard
- Add a Timeseries Panel
- In Metrics, select
azure_memorypercentage_totaland Avg By select taglocation - In Filter say
name = <app-svc-plan-name> - Hit “Save Changes” You now have Memory Usage of your App Service in a Dashboard for reporting and alerting
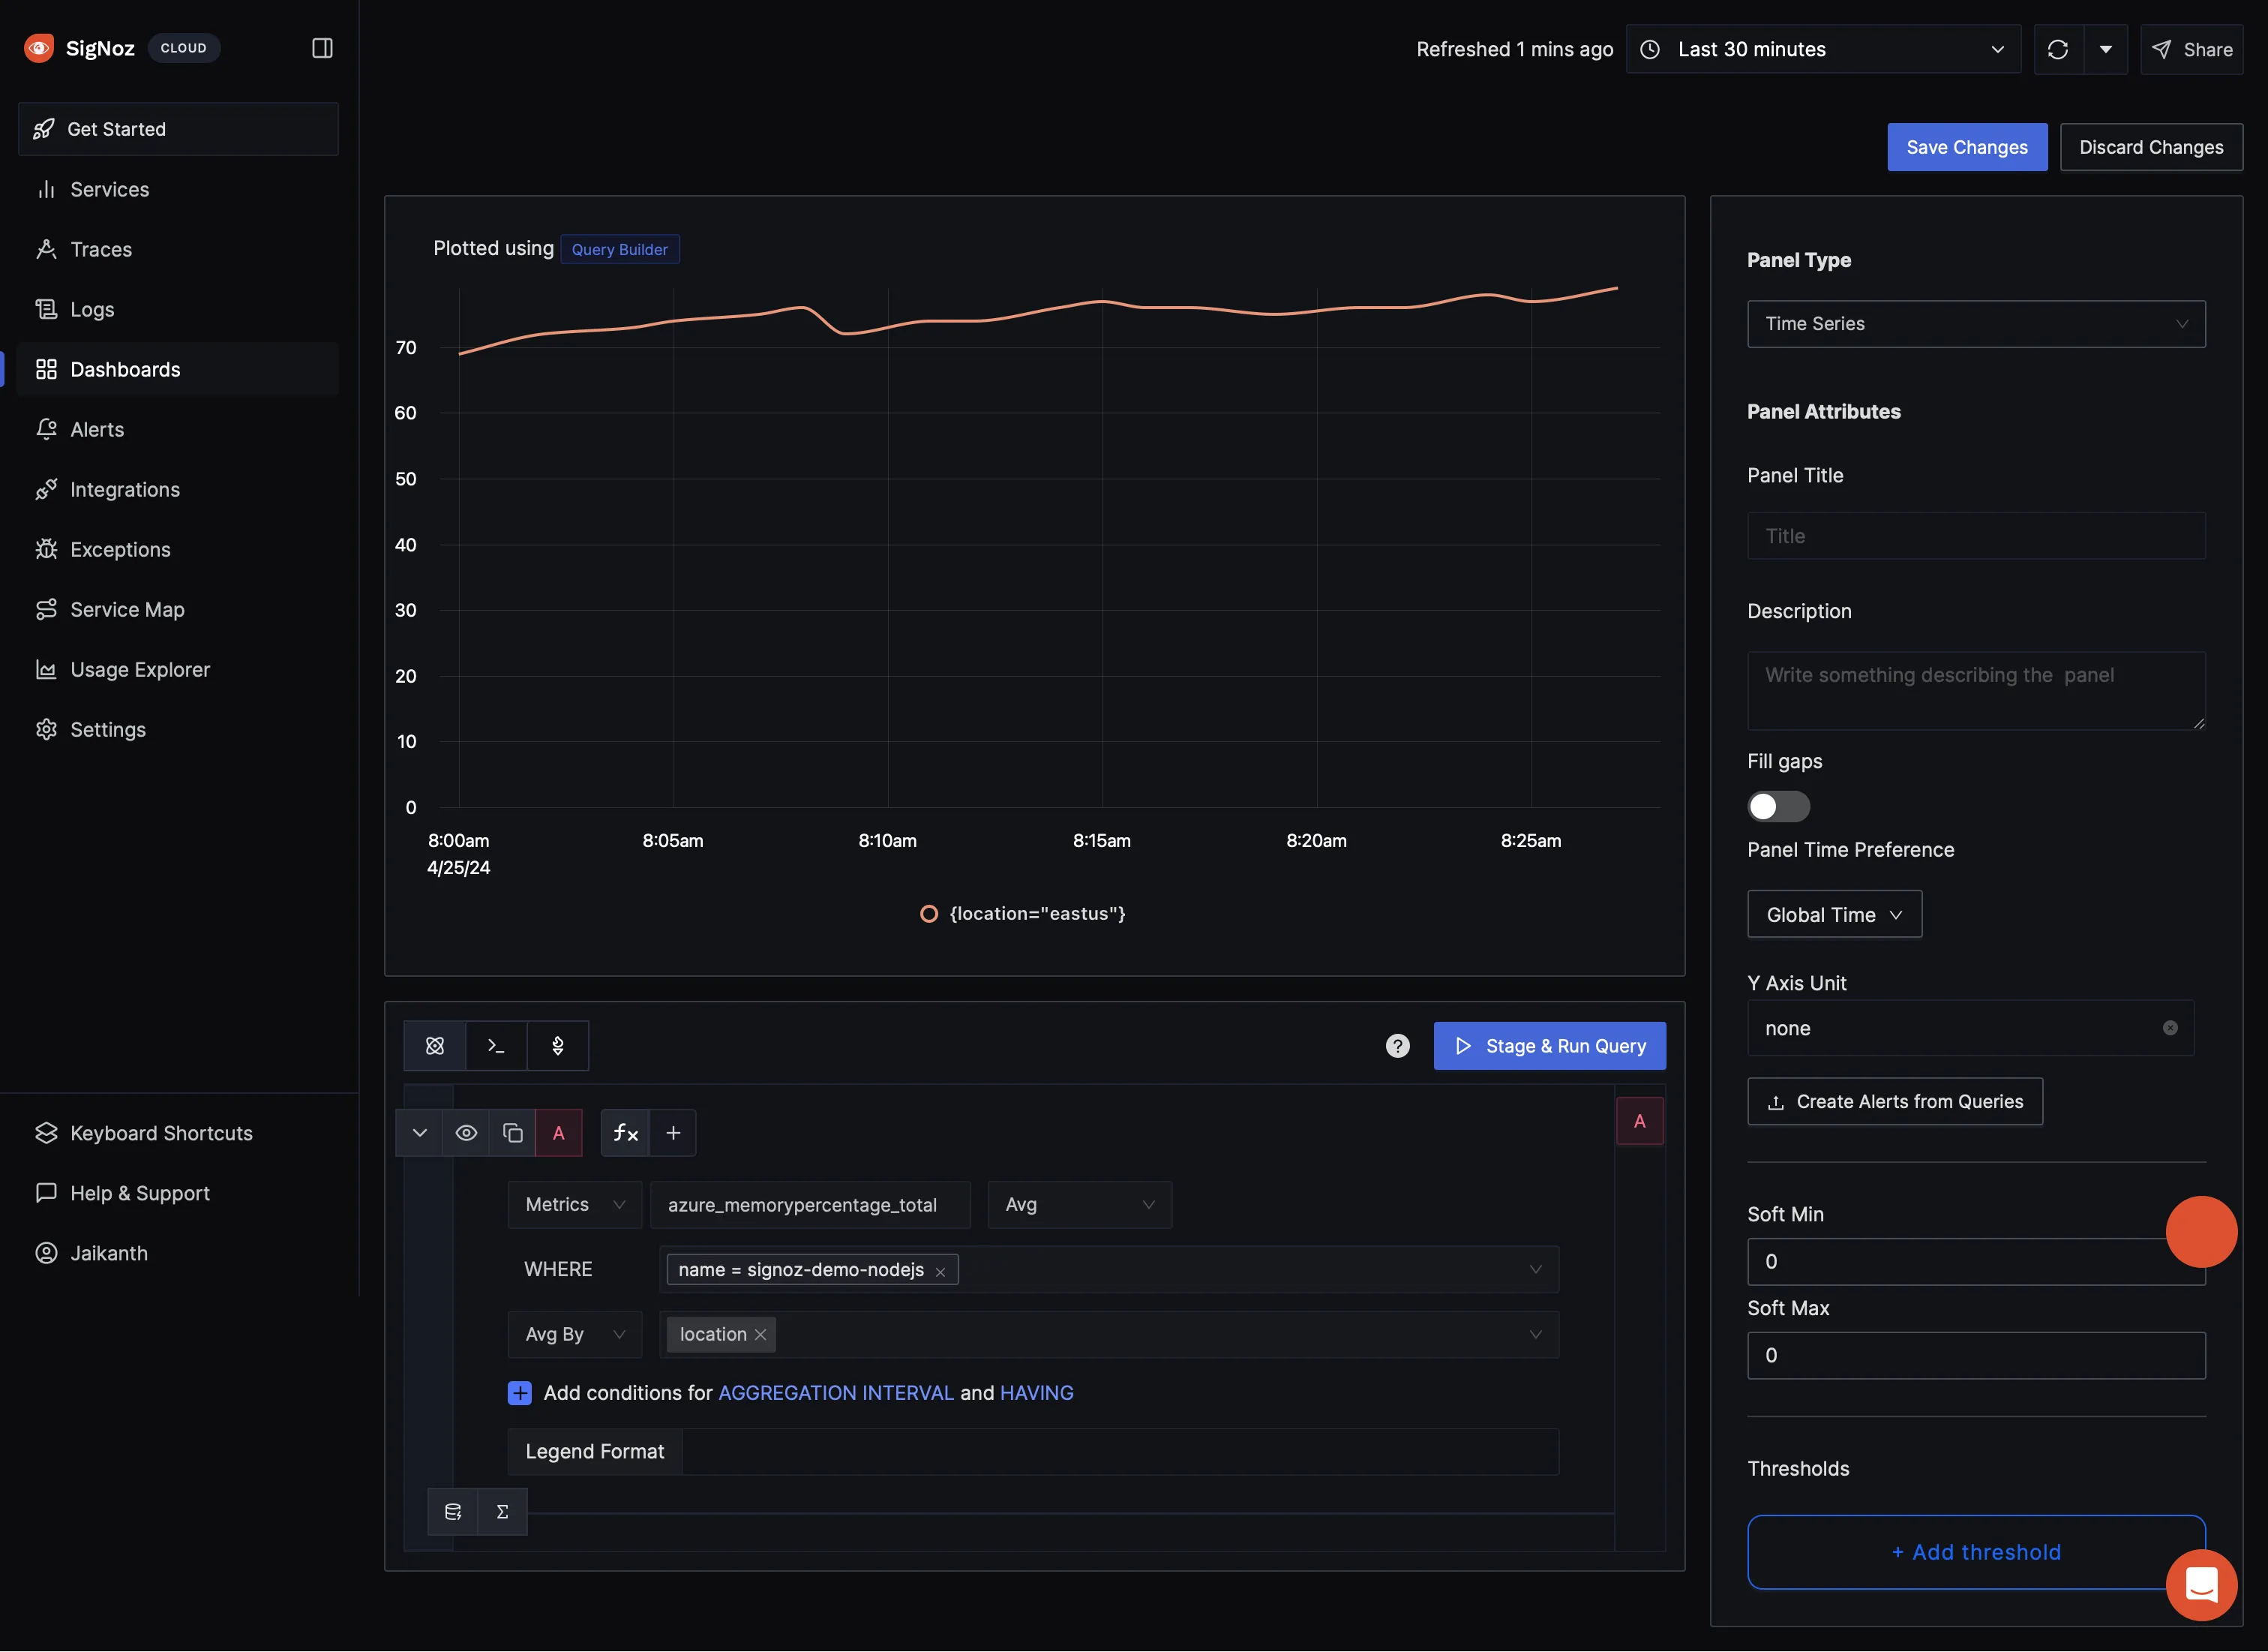
Time Series Panel for App Service Memory Usage
That's it! You have successfully set up monitoring for your Azure App Service's system metrics with SigNoz.
Troubleshooting
If you encounter any issues while setting up monitoring for your Azure App Service's system metrics with SigNoz, here are a few troubleshooting steps you can try:
- Check if the OpenTelemetry Collector is running and properly configured with the Azure Monitor exporter.
- Verify that your Azure App Service instance is running and accessible.
- Ensure that you have the necessary permissions to access the metrics in your Azure subscription.
By following this guide, you should be able to easily monitor your Azure App Service's system metrics with SigNoz and gain valuable insights into your application's performance and resource utilization.
