This dashboard provides detailed monitoring of Kubernetes node-level metrics, offering comprehensive visibility into CPU usage, memory utilization, filesystem usage, and network I/O performance across all nodes in your cluster.
To use this dashboard, you need to set up the data source and send telemetry to SigNoz. Follow the K8s Infra Metrics guide to get started.
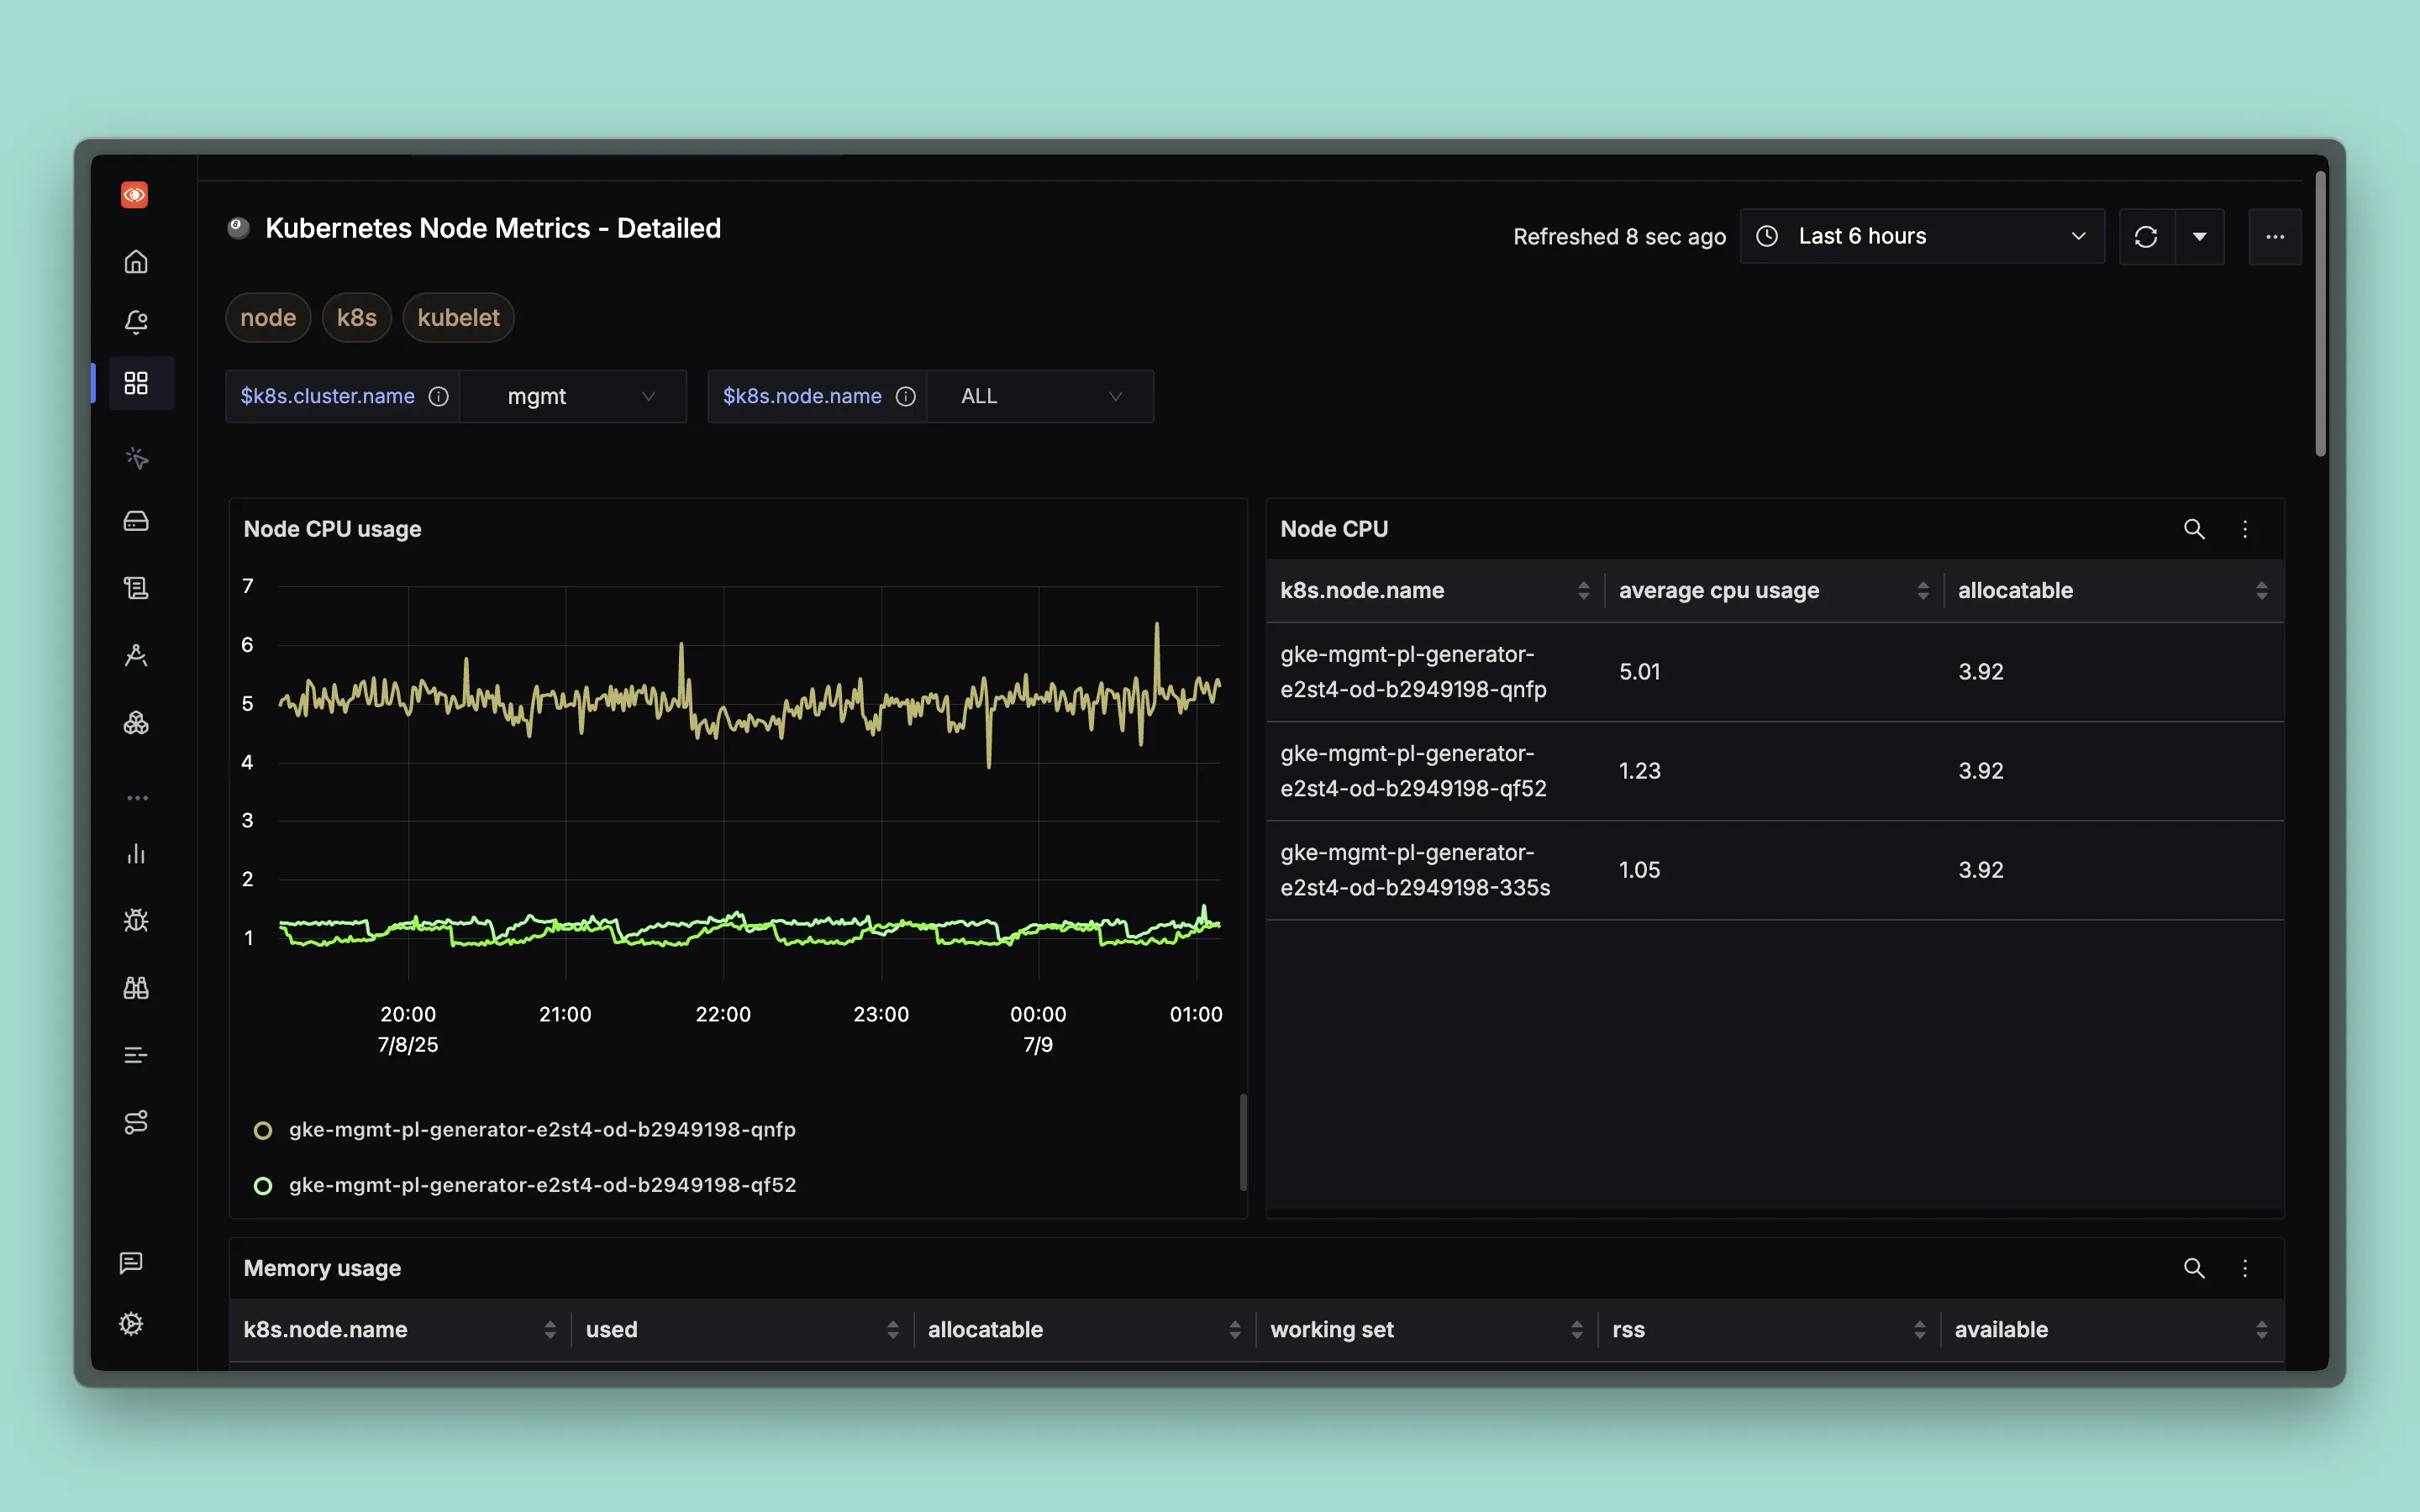
Dashboard Preview
Dashboards → + New dashboard → Import JSON
What This Dashboard Monitors
This dashboard tracks essential Kubernetes node metrics to help you:
- Monitor Resource Utilization: Track CPU and memory usage across cluster nodes
- Filesystem Management: Monitor disk usage, available space, and capacity planning
- Network Performance: Observe network I/O and error rates across nodes
- Resource Allocation: View allocatable resources and current utilization
Metrics Included
CPU Metrics
- Node CPU Usage: Real-time CPU utilization chart for each node
- Node CPU Table: Tabular view showing node name, average CPU usage, and allocatable CPU
Memory Metrics
- Memory Usage Table: Comprehensive table showing used, allocatable, working set, RSS, and available memory per node
- Node Memory RSS: Resident Set Size memory usage chart
- Node Memory Working Set: Active memory being used by processes chart
- Node Memory Available: Available memory for new workloads chart
- Node Memory Usage: Current memory consumption chart
Network Metrics
- Node Network I/O: Network traffic showing ingress and egress data
- Node Network Errors: Network error rates and dropped packets
Filesystem Metrics
- Node Filesystem Usage: Current disk space consumption chart
- Node Filesystem Available: Available disk space chart
- Node Filesystem Capacity Table: Tabular view showing usage, available space, and total capacity per node
Dashboard Variables
This dashboard includes pre-configured variables for filtering:
- k8s.cluster.name: Filter by Kubernetes cluster name
- k8s.node.name: Filter by specific node names
