Overview
This document explains how to collect log data from Logrus and visualise it in SigNoz.
Prerequisites
- A running Golang application
Setup
Step 1: Install dependencies
Navigate to the root folder of your golang application and run the below command to install the required dependencies.
go get \
go.opentelemetry.io/contrib/bridges/otellogrus \
go.opentelemetry.io/otel/sdk/log \
go.opentelemetry.io/otel/sdk/trace \
go.opentelemetry.io/otel/trace \
go.opentelemetry.io/otel/exporters/otlp/otlplog/otlploghttp \
github.com/sirupsen/logrus
Step 2: Instrument OpenTelemetry Logrus Log Bridge in your Golang application
To instrument your Go application with the OpenTelemetry Logrus Log Bridge, add the following code to your golang application main.go file.
import (
   "context"
   "log"

   "github.com/sirupsen/logrus"
   "go.opentelemetry.io/otel/exporters/otlp/otlplog/otlploghttp"
   otel_log"go.opentelemetry.io/otel/sdk/log"
   "go.opentelemetry.io/contrib/bridges/otellogrus"
)


func main() {
   logExporter, err := otlploghttp.New(context.Background())
   if err != nil {
       // handle error
       log.Fatal(err)
   }


   // create log provider
   log_provider := otel_log.NewLoggerProvider(
       otel_log.WithProcessor(
           otel_log.NewBatchProcessor(logExporter),
       ),
   )


   defer log_provider.Shutdown(context.Background())


   // Create an *otellogrus.Hook and use it in your application.
   hook := otellogrus.NewHook("<signoz-golang>", otellogrus.WithLoggerProvider(log_provider))


   // Set the newly created hook as a global logrus hook
   logrus.AddHook(hook)

   ......
}
In this code, we initialized an OpenTelemetry Protocol (OTLP) Log provider using the OTLP log exporter and OTLP Batch processor. The OTLP Log provider is then used to create a global Logrus hook using the otellogrus package.
Step 3 (Optional): Inject Trace and Span ID fields to your logs
Trace and span IDs in structured logs provide a way to correlate logs, track requests across services, and diagnose issues effectively. To add the Span and Trace ID fields to your structured logs:
Import the OpenTelemetry Trace library to your code file
import (
   "go.opentelemetry.io/otel"
   sdktrace "go.opentelemetry.io/otel/sdk/trace"
   oteltrace "go.opentelemetry.io/otel/trace"
)
Fetch current Span and Trace ID from context using the OTLP TracerProvider
   otel.SetTracerProvider(
       sdktrace.NewTracerProvider(
           sdktrace.WithSampler(sdktrace.AlwaysSample()),
       ),
   )

   tracer := otel.GetTracerProvider().Tracer("signoz-tracer")
   _, span := tracer.Start(context.Background(), "signoz-tracer")
   defer span.End()
This code implements an OTLP TracerProvider. The OTLP TracerProvider is responsible for creating Spans which help to trace an operation.
Create a function to add Span and Trace ID values to your Logrus fields
func LogrusFields(span oteltrace.Span) logrus.Fields {
   return logrus.Fields{
       "span_id":  span.SpanContext().SpanID().String(),
       "trace_id": span.SpanContext().TraceID().String(),
   }
}
This function extracts the context span and trace IDs and adds the IDs as fields to the Logrus structured log.
Step 4: Send Logrus logs to SigNoz
To send Logrus logs to your SigNoz cloud account:
Add logs to your code.
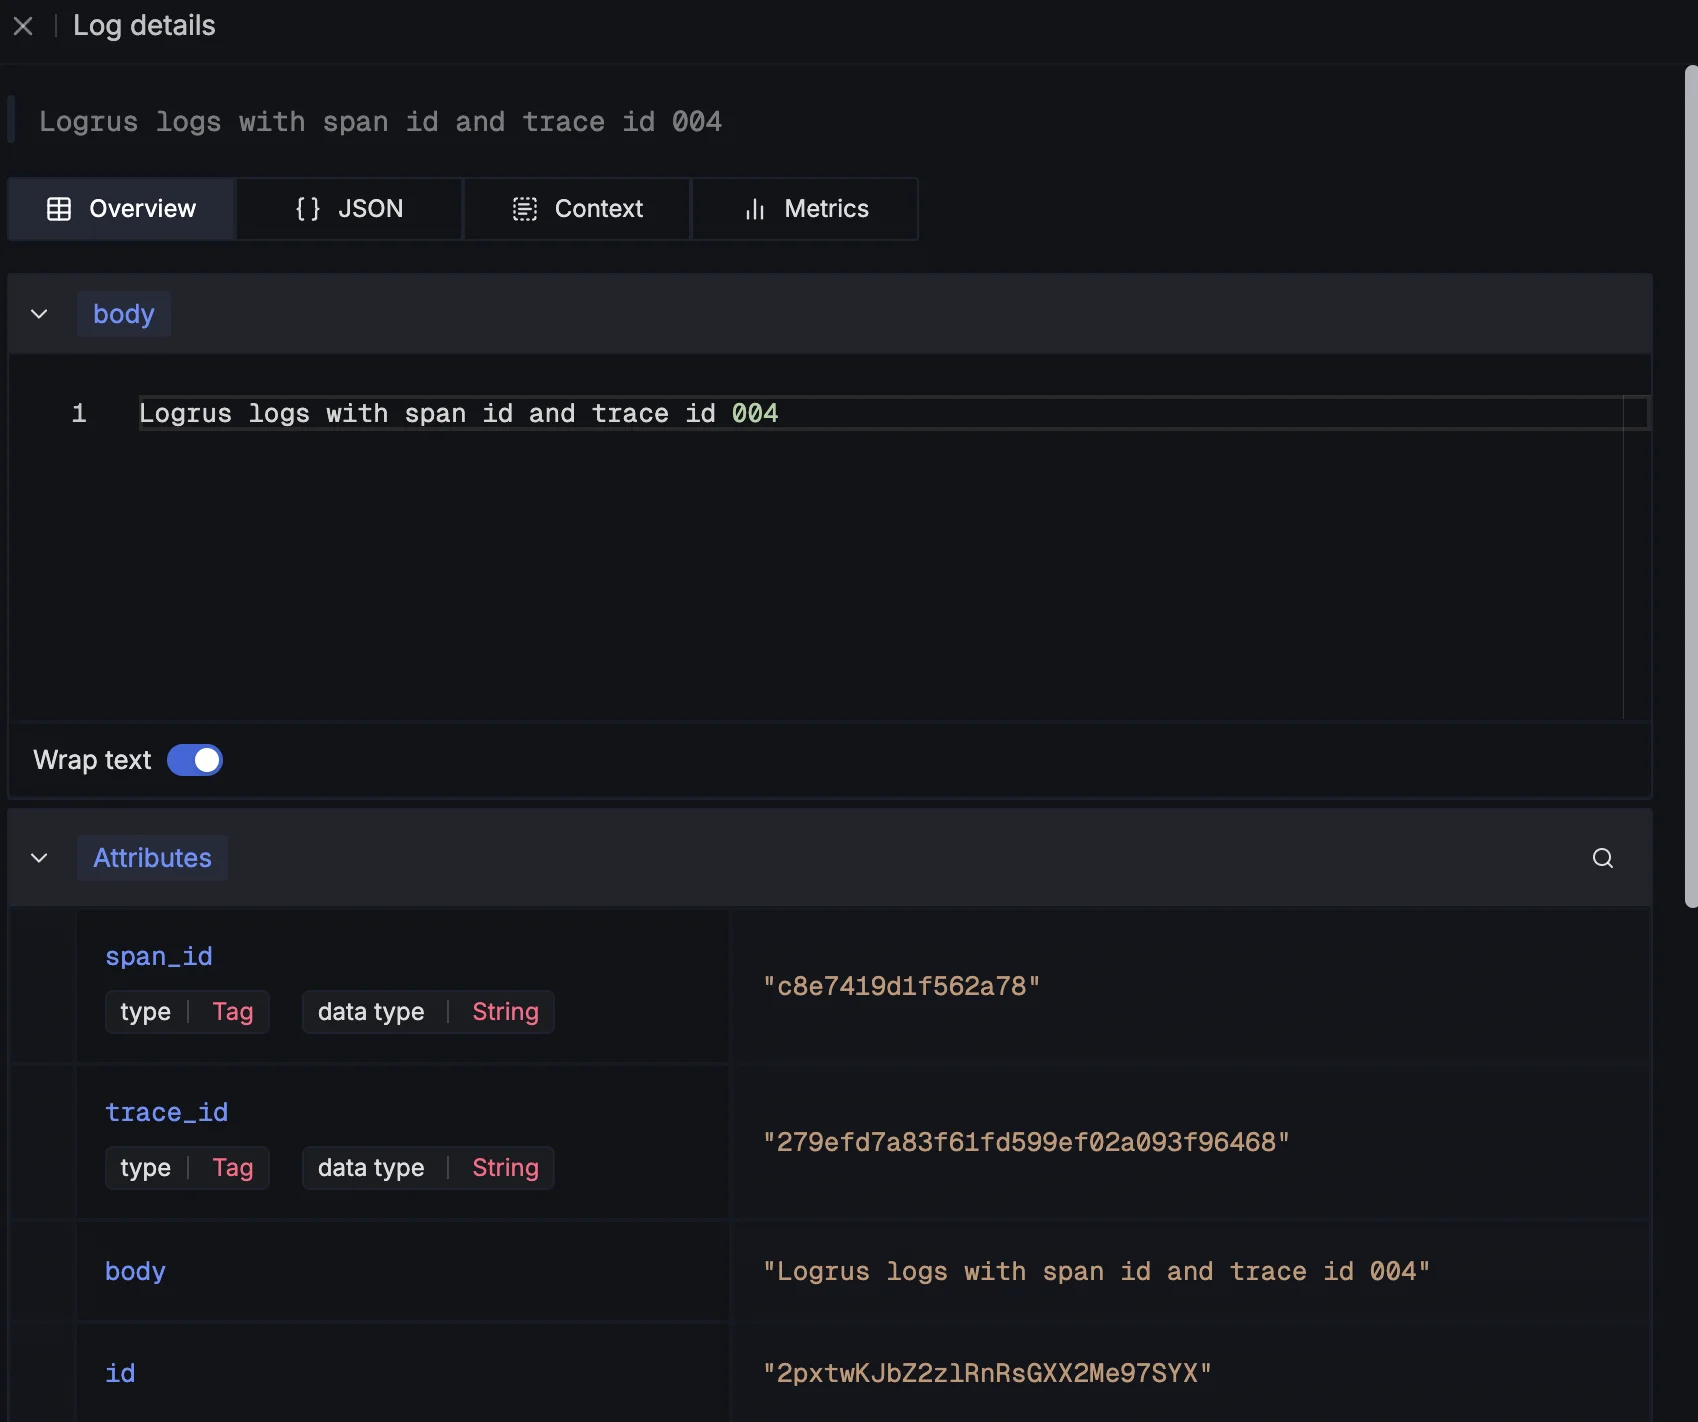
# with span and trace ids
logrus.WithFields(LogrusFields(span)).Info("Logrus logs with span id and trace id 004")

# without span and trace ids
logrus.Info("Logrus logs with span id and trace id 004")
Run your Golang application with your SigNoz credentials
INSECURE_MODE=false OTEL_EXPORTER_OTLP_HEADERS=signoz-ingestion-key=<your-ingestion-key> OTEL_EXPORTER_OTLP_ENDPOINT=ingest.<region>.signoz.cloud:443 go run main.goInput the following values:
<your-ingestion-key>: Your SigNoz ingestion key<region>: Your SigNoz Cloud region
Run your Golang application as specified above and wait some minutes for the logs to be sent to your SigNoz cloud dashboard. You can view the logs in the Logs section of your dashboard.
If using the k8s-infra chart (which auto-collects container logs), disable log collection for this application to prevent duplicates.
To send Logrus logs to your Self-hosted SigNoz dashboard:
Add logs to your code.
# with span and trace ids
logrus.WithFields(LogrusFields(span)).Info("Logrus logs with span id and trace id 004")

# without span and trace ids
logrus.Info("Logrus logs with span id and trace id 004")
Run your Golang application with your SigNoz credentials
INSECURE_MODE=true OTEL_EXPORTER_OTLP_ENDPOINT=<SIGNOZ_OPENTELEMETRY_ENDPOINT> go run main.goChange
<SIGNOZ_OPENTELEMETRY_ENDPOINT>to your SigNozotlpreceiver endpoint, changeINSECURE_MODEtotrueorfalsedepending on if your connection is secured or not.
Run your Golang application as specified above and wait some minutes for the logs to be sent to your SigNoz dashboard. You can view the logs in the Logs section of your dashboard.
If using the k8s-infra chart (which auto-collects container logs), disable log collection for this application to prevent duplicates.

