Metric Types and Aggregation
This page describes the different types of metrics that SigNoz supports and how they are aggregated.
Metric Types
SigNoz supports the following types of metrics:
Counter: A counter is a metric that represents a single numerical value that monotonically increases over time. A counter resets to zero when the process restarts. Counters are used to track the number of events that occur in a system. For example, the number of requests received by a server.
Gauge: A gauge is a metric that represents a single numerical value that can arbitrarily go up and down. Gauges are typically used for measured values like temperatures or current memory usage.
Histogram: A histogram is a metric that represents the distribution of a set of values. Histograms are used to track the distribution of values over time. For example, the response time of a web service.
Exponential Histogram: An exponential histogram is a metric that represents the distribution of a set of values on a logarithmic scale. Exponential histograms are used to track the distribution of values that span several orders of magnitude. For example, the latency of a network request.
Temporality of Metrics
The temporality of a metric determines how the measurement is reported over time. SigNoz supports the following types of temporality:
Cumulative metrics store the accumulated value of the metric since the start of the process — for example, an odometer in a vehicle.
Delta metrics store the change in the value of the metric since the last time it was reported — for example, the number of requests received by a server. Each time the metric is reported, the value is reset to zero.
A table representing the different types of metrics and their temporality support in SigNoz is shown below:
| Metric Type | Cumulative | Delta |
|---|---|---|
| Counter | Yes | Yes |
| Gauge | N/A | N/A |
| Histogram | Yes | Yes |
| Exponential Histogram | No | Yes |
The Gauge metric type does not have a temporality, as it represents a single value at a point in time.
Aggregation
The aggregation of metrics is a two-step process:
Temporal Aggregation: Temporal aggregation is the process of aggregating the measurements over a specific period within the same time series.
Spatial Aggregation: Spatial aggregation is the process of aggregating the measurements across multiple time series after temporal aggregation.
A table representing the different types of metrics and their temporal and spatial aggregation supported by SigNoz is shown below:
| Metric Type | Temporal Aggregation | Spatial Aggregation |
|---|---|---|
| Counter | Increase, Rate | Sum, Avg, Min, Max |
| Gauge | Latest, Sum, Avg, Min, Max, Count, Count Distinct | Sum, Avg, Min, Max |
| Histogram | - | P50, P75, P90, P95, P99 |
| Exponential Histogram | - | P50, P75, P90, P95, P99 |
The next few sections describe how SigNoz performs temporal and spatial aggregation for each metric type.
Gauge
Let's take an example of a Gauge metric that represents the memory usage of a process. The following table shows the measurements of the memory usage over time (at minutes:seconds timestamp). The measurements are reported every 5 seconds. This example has 7 time series, each representing the memory usage of a process (Px) running on the server (Hx).
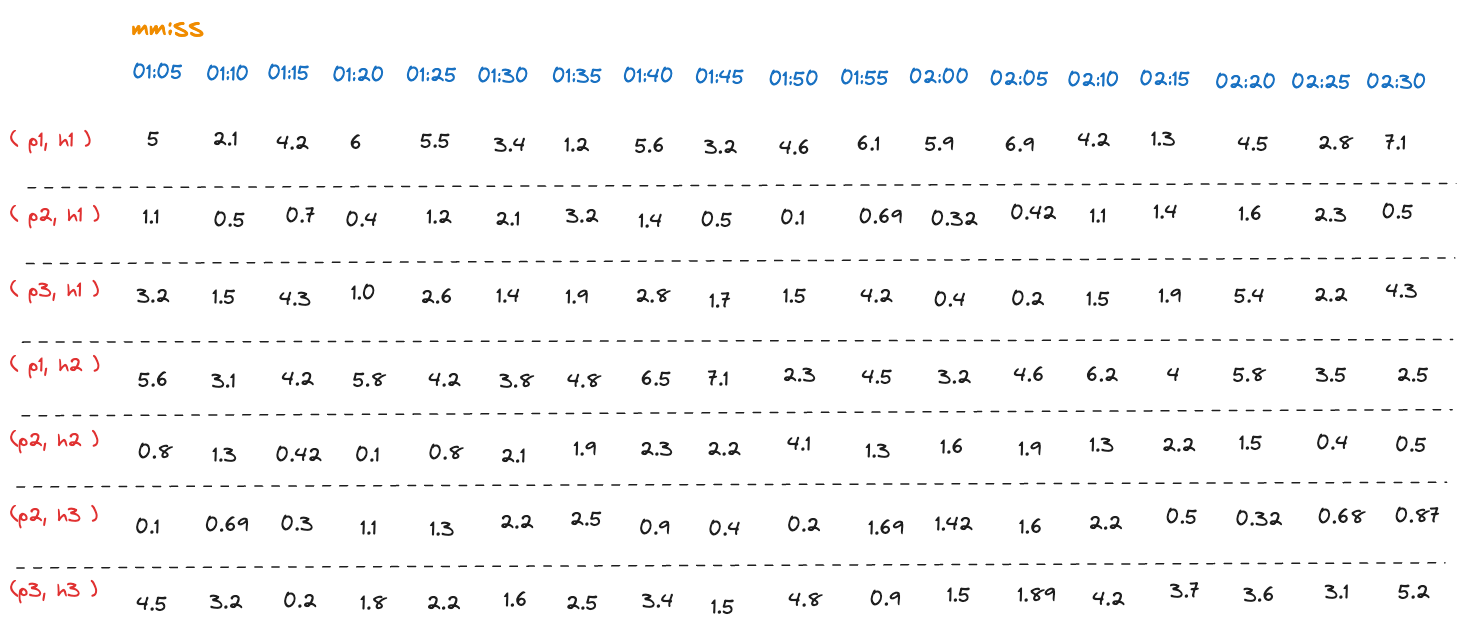
Raw memory usage measurements
Let's say we want to calculate the memory usage per host. The following steps show how SigNoz performs temporal and spatial aggregation for the Gauge metric:
Step 1: Find the aggregation interval
The aggregation interval is the period over which the measurements are aggregated. It is dynamically calculated based on the time range of the query. This is done to ensure that the number of data points returned is manageable and does not overload the system. In this example, for illustration purposes, we will use an aggregation interval of 15 seconds.
Step 2: Temporal Aggregation
Step 2.1: Group measurements into intervals
For each time series, the measurements are grouped into intervals of 15 seconds. The following table shows the grouped measurements for each time series:
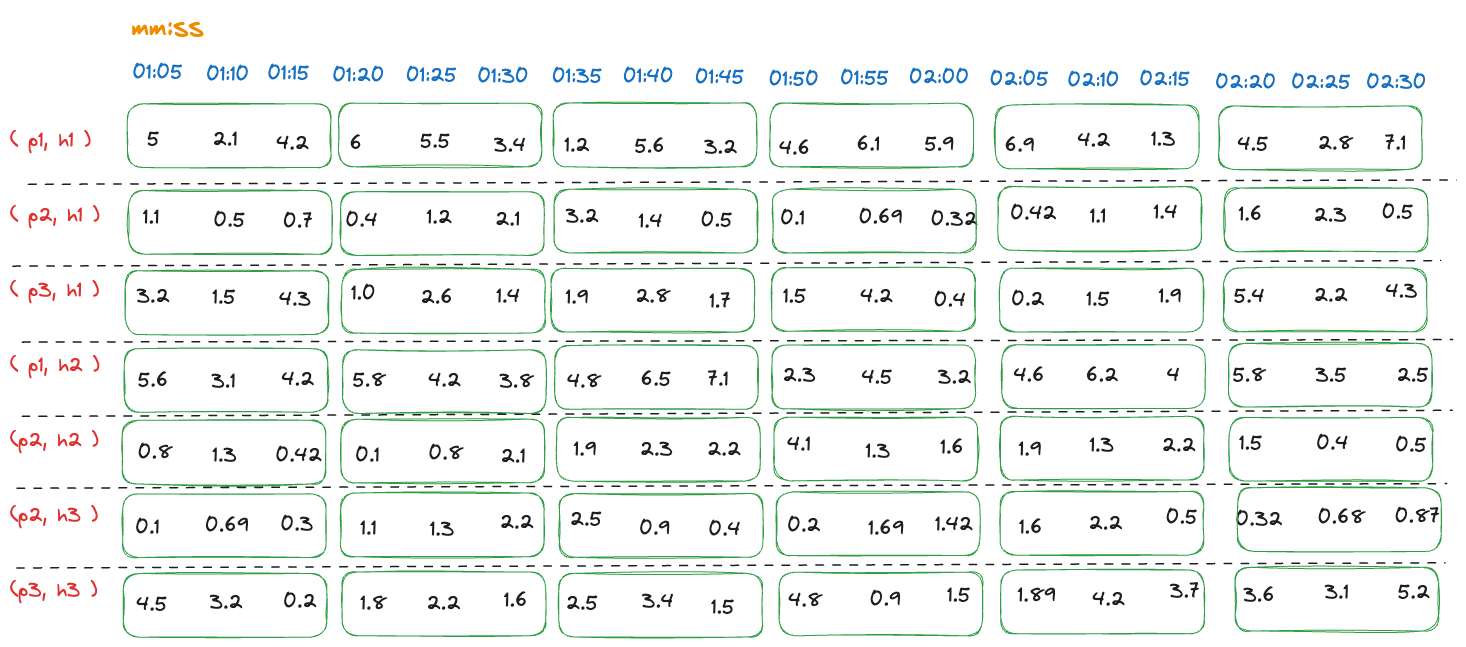
Grouped memory usage measurements
Step 2.2: Calculate the aggregated value for each interval
What temporal aggregation function to use?
The selection of the temporal aggregation function depends on the use case and the metric being measured. It's important to choose the right function to get meaningful insights from the data. Let's analyze what each temporal aggregation function represents in the context of memory usage:
Latest: The latest memory usage of the process in the interval. This might be fine if the last value can be a good representation of the memory usage.
Sum: The sum of memory usage measurements of the process in the interval. It doesn't make much sense to sum memory usage for intervals. For example, if the memory usage for an interval is [100, 102, 101], the sum would be 303, it would be incorrect to say that the memory usage was 303 in the interval.
Avg: The average memory usage of the process in the interval. This is a better representation of memory usage as it gives an idea of the average memory usage over the interval.
Min: The minimum memory usage of the process in the interval. This can be useful to find the minimum memory usage of the process in the interval.
Max: The maximum memory usage of the process in the interval. This can be useful to find the maximum memory usage of the process in the interval.
Count: The number of memory usage measurements in the interval. This doesn't make much sense in the context of memory usage.
Count Distinct: The number of distinct memory usage measurements in the interval. This doesn't make much sense in the context of memory usage.
For each interval, the aggregated value is calculated based on the temporal aggregation function specified in the query. The result of this step is a single aggregated value for each interval within the time series. The number of time series remains the same after temporal aggregation.
The following table shows the average value for each interval:
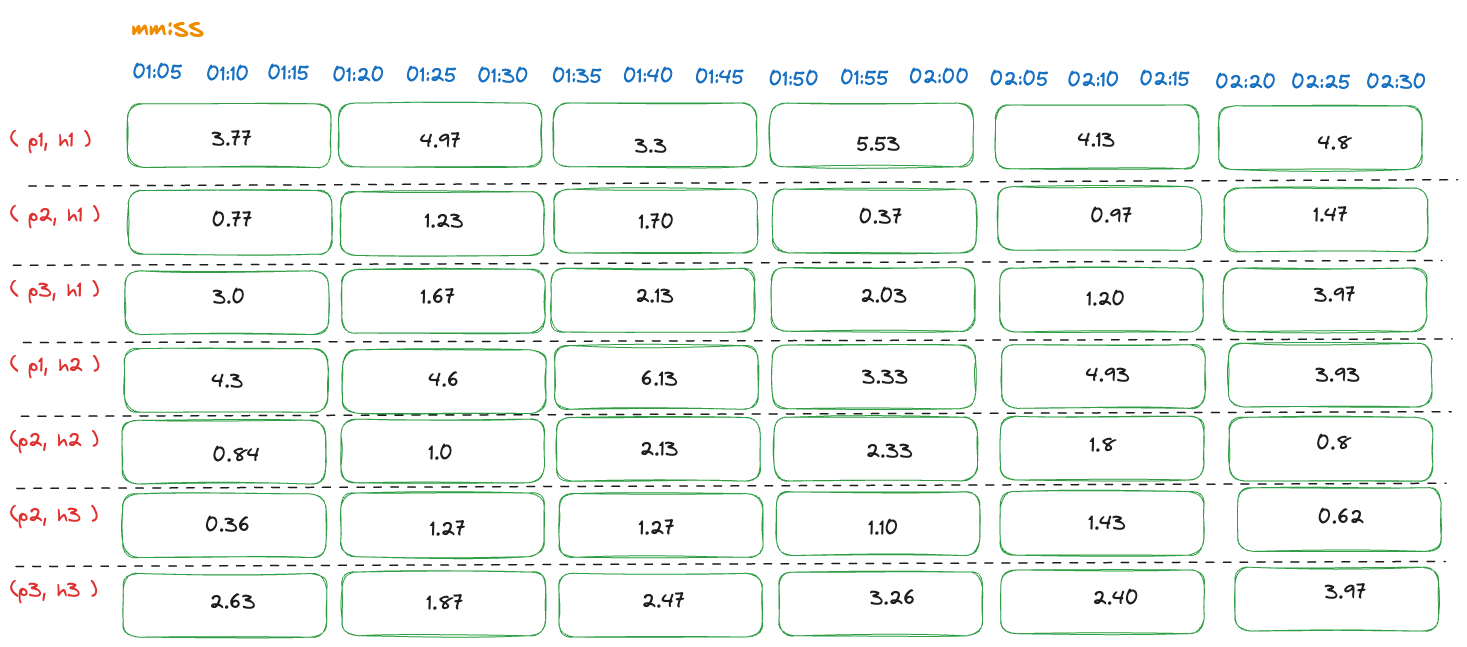
Aggregated memory usage measurements within series
Step 3: Spatial Aggregation
The spatial aggregation step aggregates the values across multiple time series. The result of this step is a single aggregated value for each interval for a group of time series. The grouping is done based on the group tags specified in the query. If no group tags are specified, all time series are considered as a single group. In this example, we want to calculate the memory usage per host. The group tag is the hostname.
Step 3.1: Group time series based on group tags
The time series are grouped based on the hostname. The following table shows the grouped time series:
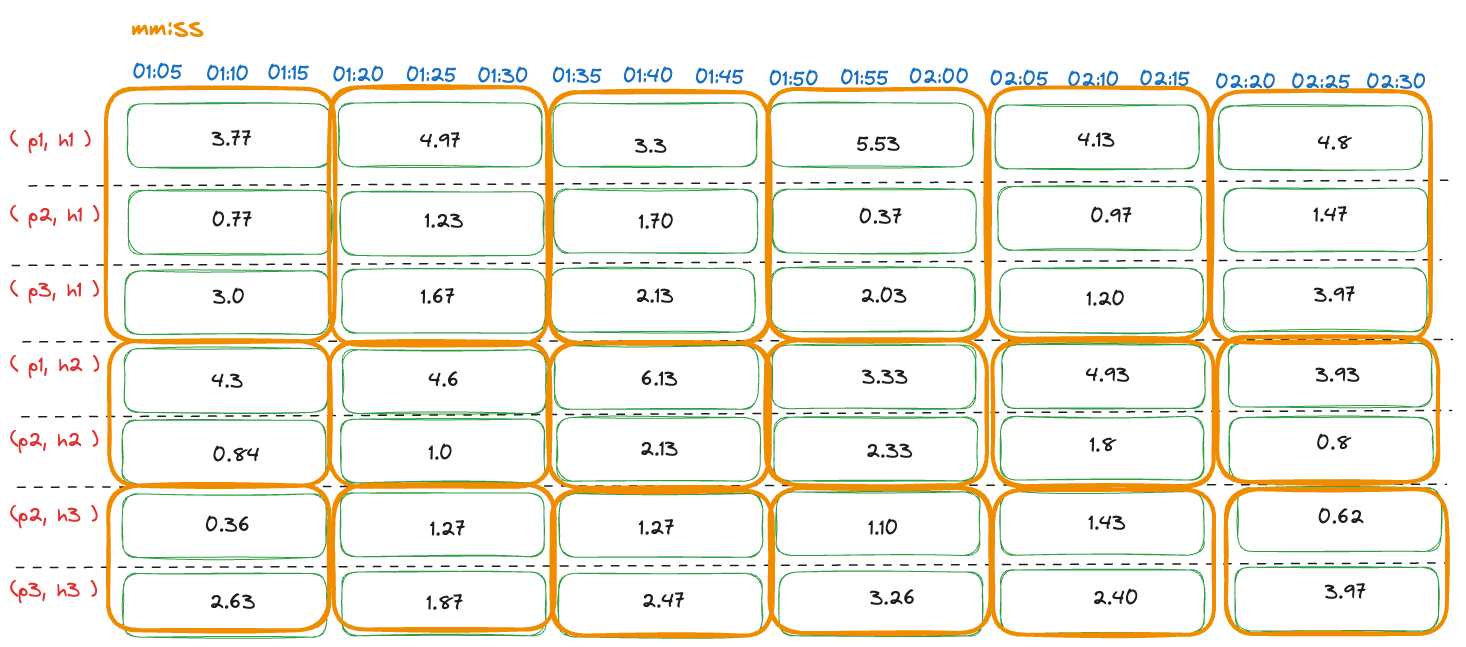
Grouped memory usage measurements by host
Step 3.2: Calculate the aggregated value for each interval
For each interval, the aggregated value is calculated based on the spatial aggregation function specified in the query. The result of this step is a single aggregated value for each interval for each group of time series. The number of time series is reduced after spatial aggregation. Let's analyze what each spatial aggregation function represents in the context of memory usage:
Sum: The sum of memory usage measurements of all processes in the group in the interval. . This can be useful to find the total memory usage of all processes (i.e. memory usage per host) in the group in the interval.
Avg: The average memory usage of all processes in the group in the interval. It doesn't make much sense to average memory usage of all processes in the group in the interval. For example, if the memory usage for processes (p1, p2, p3) in the host group is [20, 25, 32], the average would be 25.67, this doesn't help in understanding the memory usage of hosts.
Min: The minimum memory usage of all processes in the group in the interval. This can be useful to find the minimum memory usage of all processes in the group in the interval. If the goal is to find the minimum memory usage of all processes in the group in the interval, this can be useful.
Max: The maximum memory usage of all processes in the group in the interval. This can be useful to find the maximum memory usage of all processes in the group in the interval. If the goal is to find the maximum memory usage of all processes in the group in the interval, this can be useful.
As we can see, the spatial aggregation function Sum is the most useful in this context as it gives the memory usage per host. The following table shows the sum of memory usage for each host:
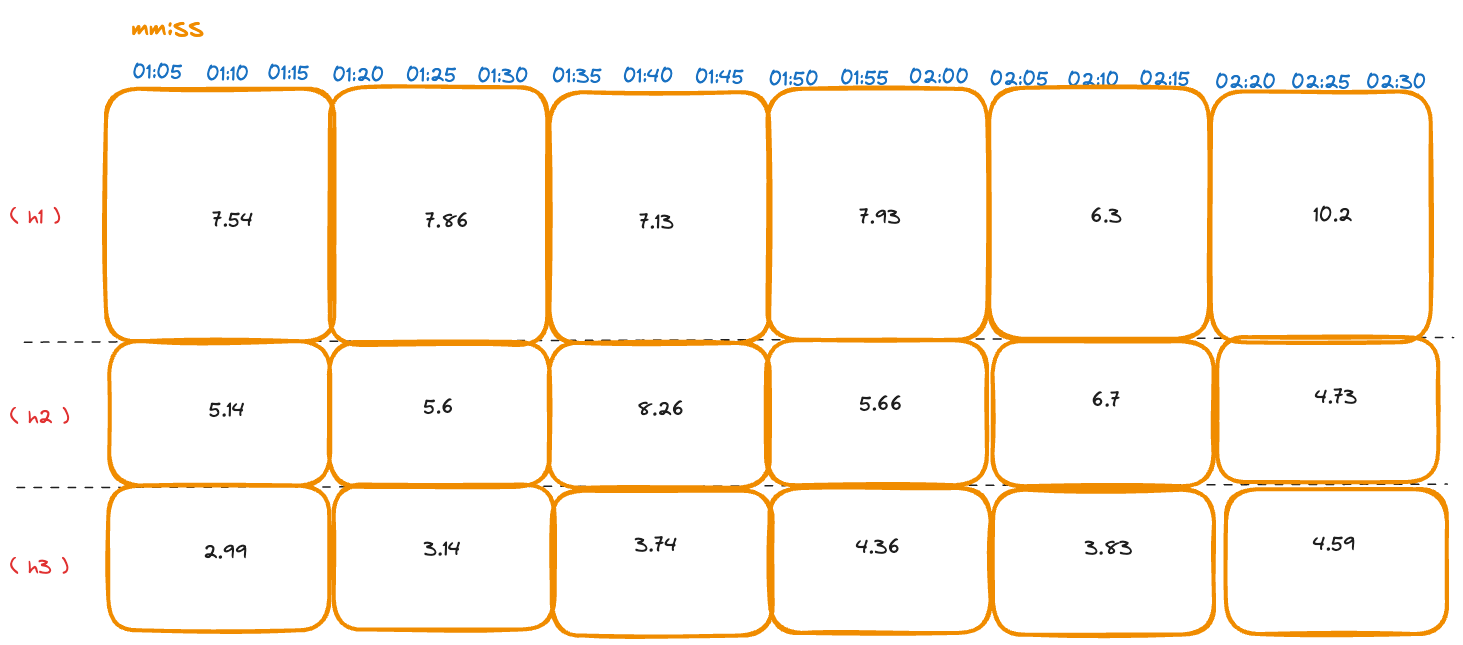
Aggregated memory usage measurements by host
The final result is the memory usage per host for each interval.
Counter
The Counter metric can have a cumulative or delta temporality.
Cumulative Counter
Let's take an example of a Counter metric that represents the number of requests received by a service. The following tables show the measurements of the number of requests over time (at minutes:seconds timestamp). The measurements are reported every 5 seconds. This example has 7 time series, each representing the number of requests received by a service (Sx) running on the server (Hx).
The following table shows the measurements of the number of requests over time (Cumulative Counter):
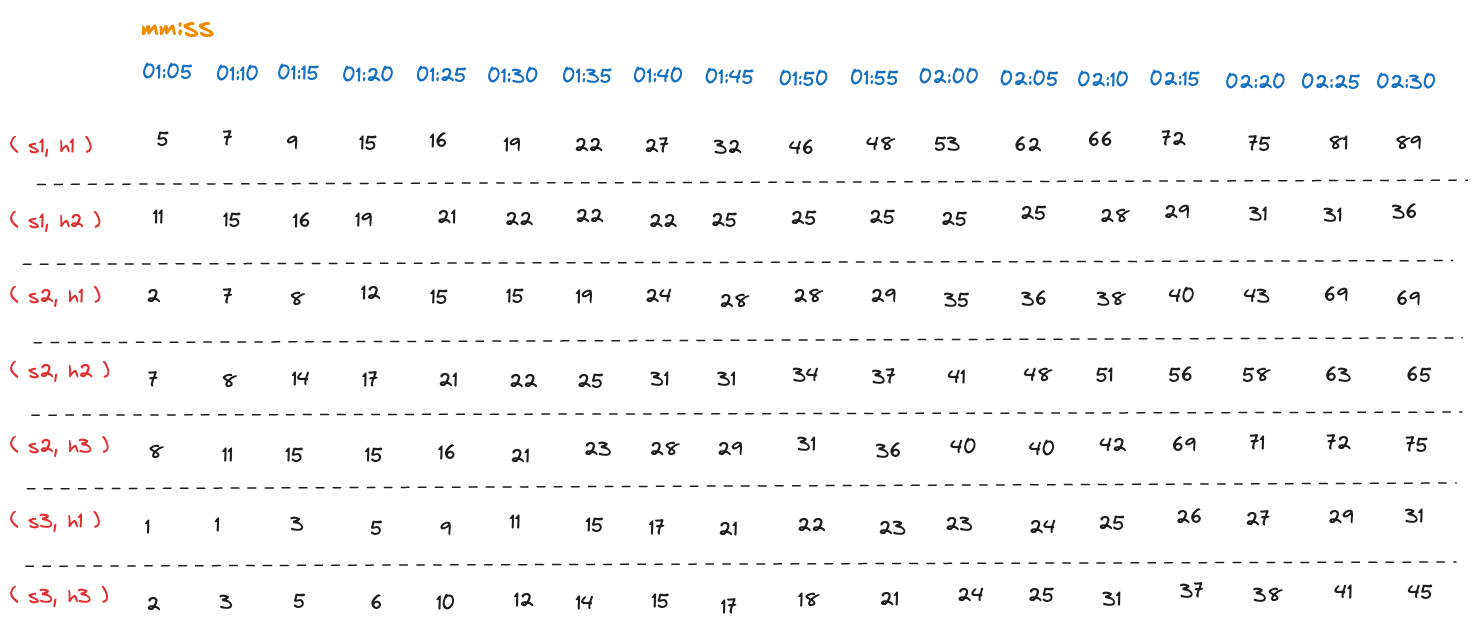
Raw request count measurements (cumulative)
Step 1: Find the aggregation interval
The aggregation interval is the period over which the measurements are aggregated. It is dynamically calculated based on the time range of the query. This is done to ensure that the number of data points returned is manageable and does not overload the system. In this example, for illustration purposes, we will use an aggregation interval of 15 seconds.
Step 2: Temporal Aggregation
Step 2.1: Group measurements into intervals
For each time series, the measurements are grouped into intervals of 15 seconds. The following table shows the grouped measurements for each time series:
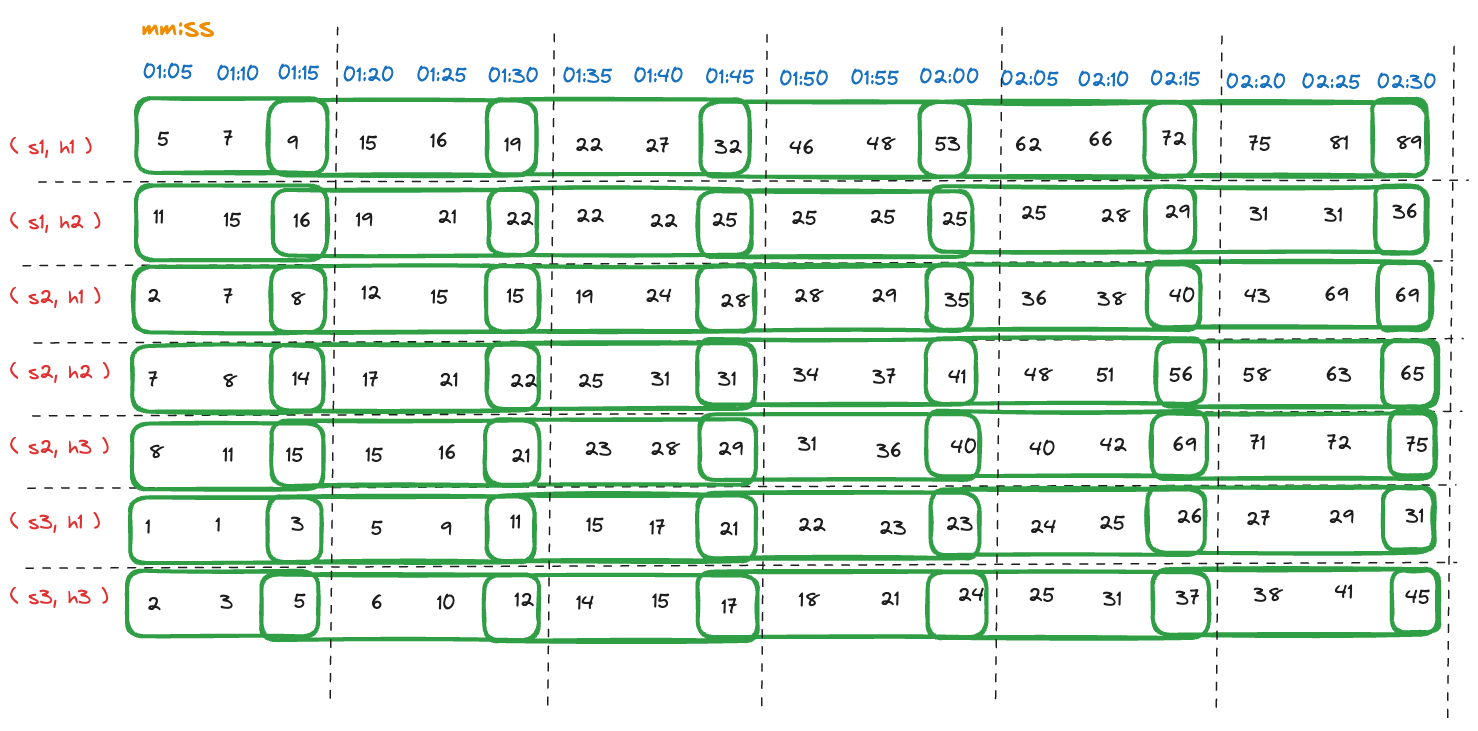
Aggregated request count measurements within series
Step 2.2: Calculate the aggregated value for each interval
For each interval, the aggregated value is calculated based on the temporal aggregation function specified in the query. The result of this step is a single aggregated value for each interval within the time series. The number of time series remains the same after temporal aggregation. Let's analyze what each temporal aggregation function represents in the context of request count:
Increase: The increase in the metric being measured in the interval. This is useful to find the total number of events that occurred in the interval.
Rate: The rate of increase of the metric being measured in the interval. It is calculated as the increase in the metric divided by the interval duration. This is useful to find the rate at which events are occurring in the interval.
The following table shows the increase in the number of requests received in each interval:
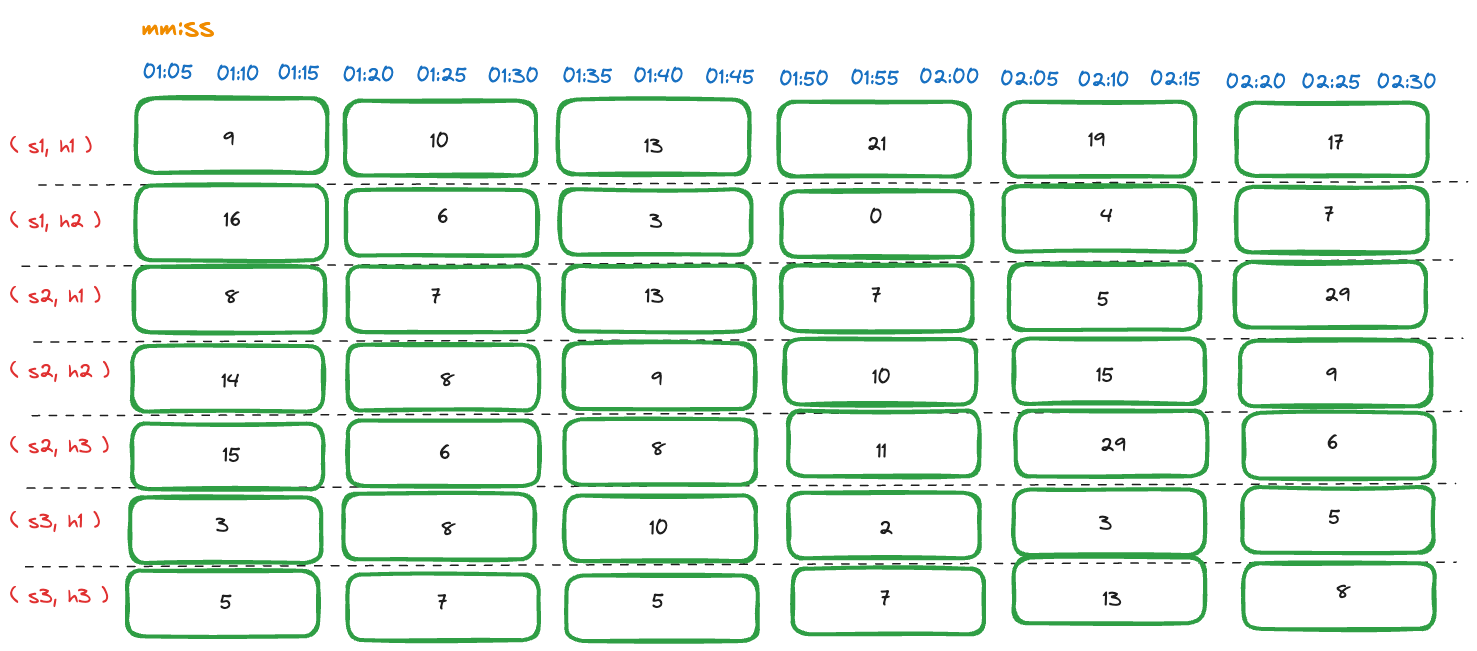
Aggregated request count measurements within series
Step 3: Spatial Aggregation
The spatial aggregation step aggregates the values across multiple time series. The result of this step is a single aggregated value for each interval for a group of time series. The grouping is done based on the group tags specified in the query. If no group tags are specified, all time series are considered as a single group. In this example, we want to calculate the number of requests received per service. The group tag is the service name.
Step 3.1: Group time series based on group tags
The time series are grouped based on the service name. The following table shows the grouped time series:
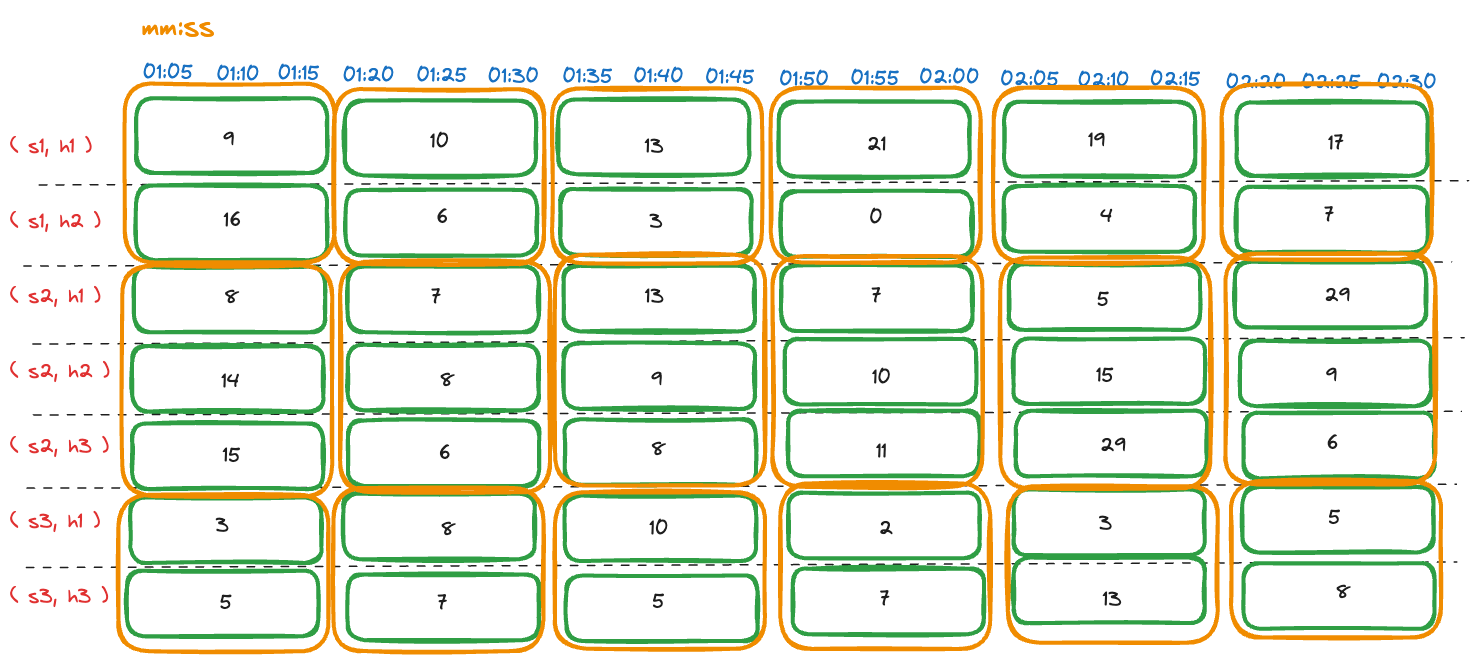
Grouped request count measurements by service
Step 3.2: Calculate the aggregated value for each interval
For each interval, the aggregated value is calculated based on the spatial aggregation function specified in the query. The result of this step is a single aggregated value for each interval for each group of time series. The number of time series is reduced after spatial aggregation. Let's analyze what each spatial aggregation function represents in the context of request count:
Sum: The sum of the number of requests received by all services in the group in the interval. This can be useful to find the total number of requests received by all services in the group in the interval.
Avg: The average number of requests received by all services in the group in the interval. It doesn't make much sense to average the number of requests received by all services in the group in the interval.
Min: The minimum number of requests received by all services in the group in the interval. This can be useful to find the minimum number of requests received by all services in the group in the interval.
Max: The maximum number of requests received by all services in the group in the interval. This can be useful to find the maximum number of requests received by all services in the group in the interval.
As we can see, the spatial aggregation function Sum is the most useful in this context as it gives the number of requests received per service. The following table shows the sum of the number of requests received by each service:
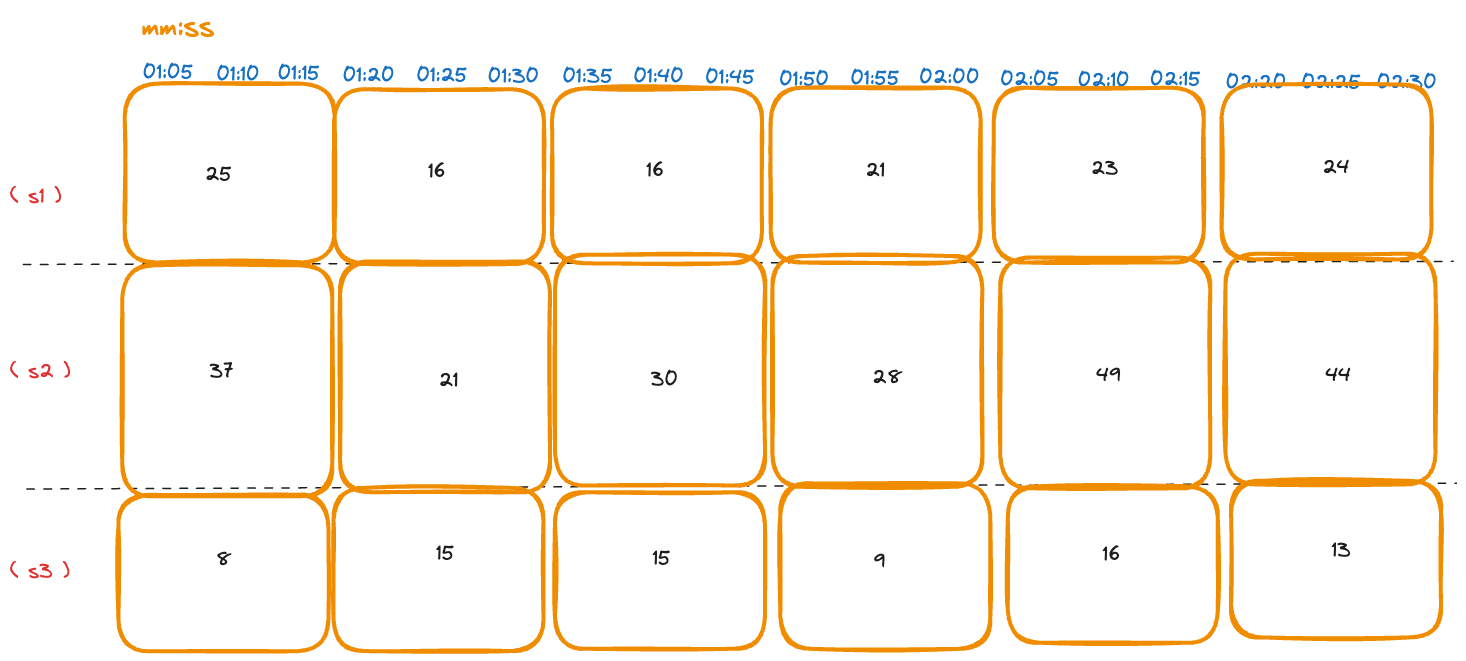
Aggregated request count measurements by service
The final result is the number of requests received per service for each interval.
Delta Counter
Let's take an example of a Counter metric that represents the number of requests received by a service. The following tables show the measurements of the number of requests since the last time it was reported (Delta Counter). The measurements are reported every 5 seconds. This example has 7 time series, each representing the number of requests received by a service (Sx) running on the server (Hx).
The following table shows the measurements of the number of requests since the last time it was reported (Delta Counter):
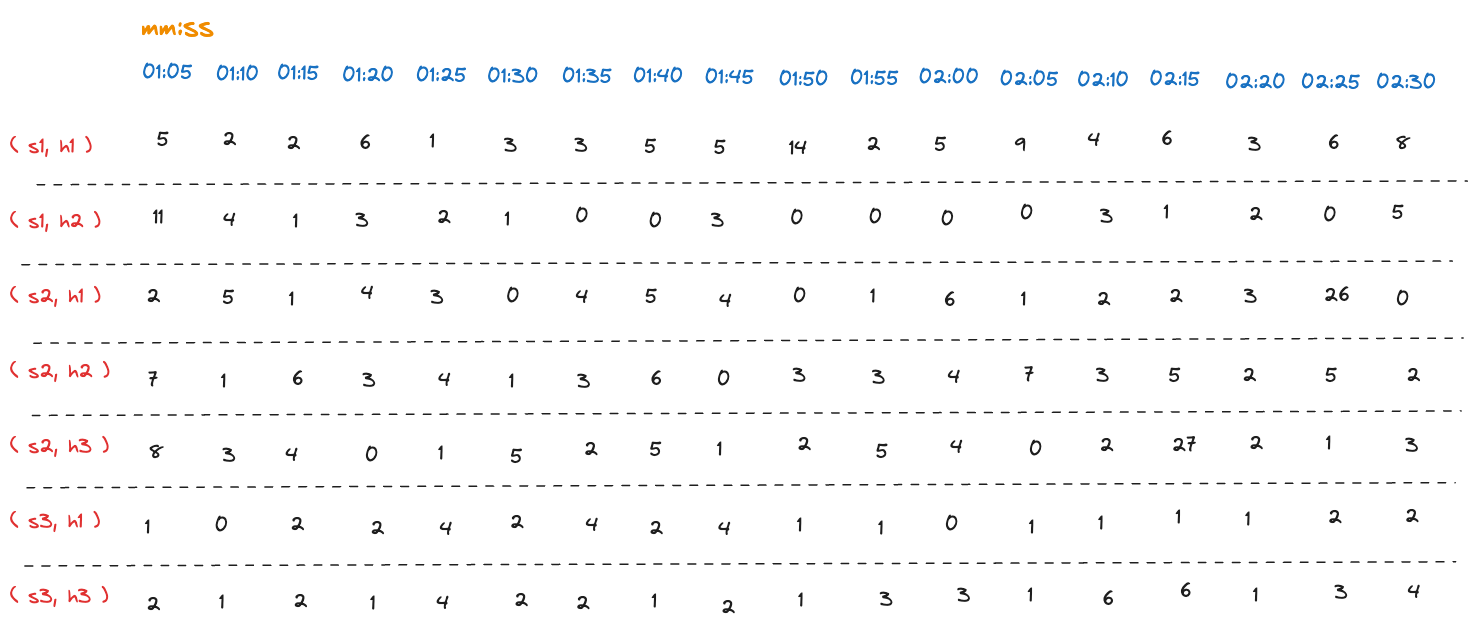
Raw request count measurements (delta)
Step 1: Find the aggregation interval
This step is the same as the Cumulative Counter.
Step 2: Temporal Aggregation
Step 2.1: Group measurements into intervals
For each time series, the measurements are grouped into intervals of 15 seconds. The following table shows the grouped measurements for each time series:
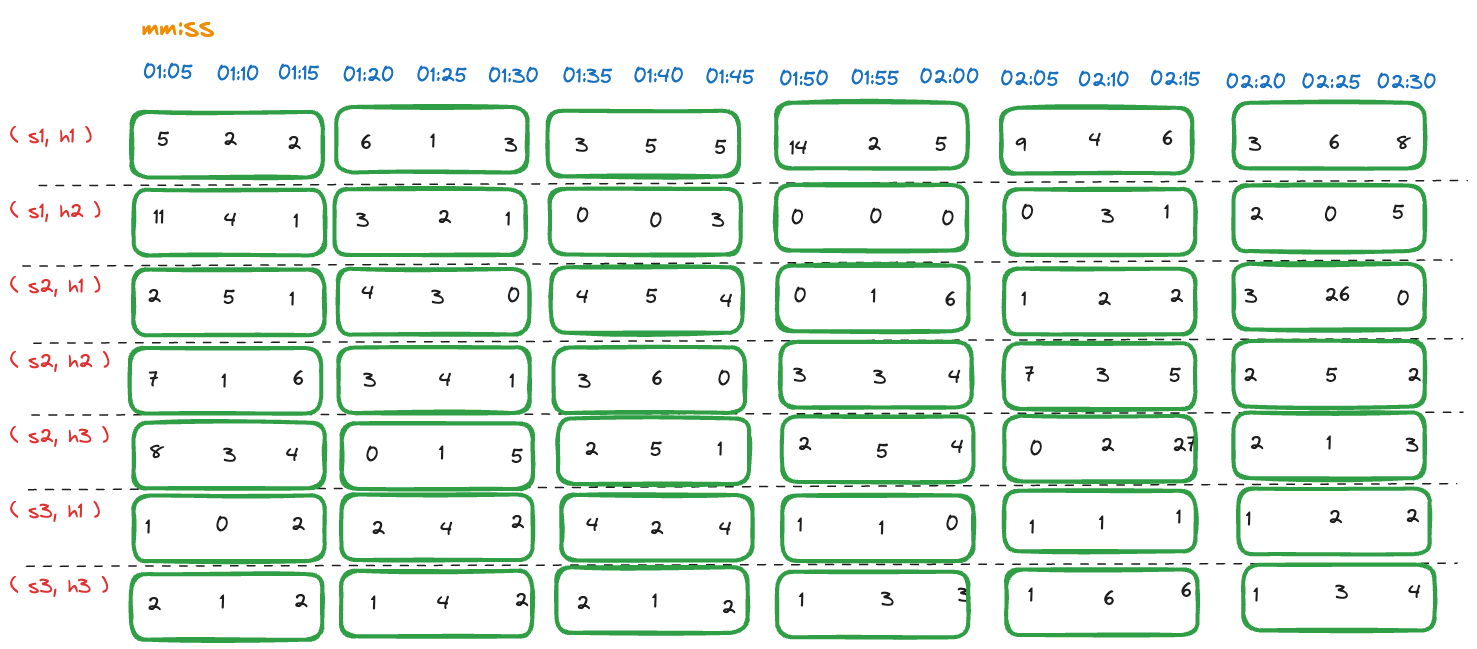
Aggregated request count measurements within series
Step 2.2: Calculate the aggregated value for each interval
The following table shows the increase in the number of requests received in each interval:

Aggregated request count measurements within series
Step 3: Spatial Aggregation
This step is the same as the Cumulative Counter.
Histogram & Exponential Histogram
The aggregation of Histogram metrics is similar to that of Counter metrics. The difference is that Histogram metrics store the distribution of a set of values. There is no configuration required for temporal aggregation as the values get aggregated into buckets based on the histogram configuration. The result of the temporal aggregation is a single aggregated histogram for each interval within the time series.
The spatial aggregation step aggregates the values across multiple time series. The result of this step is a single numerical value indicating the percentile value for each interval for a group of time series. The grouping is done based on the group tags specified in the query. If no group tags are specified, all time series are considered as a single group.
Last updated: June 6, 2024
