One-Click integration for
Azure Monitoring
SigNoz Cloud monitors every Azure service; VMs, AKS, App Service, Container Apps, Azure Functions,
SQL Database, Blob Storage, Cosmos DB in a single OTel-native ClickHouse backend.
Metrics, logs, and traces correlated in one view. No per-metric charges. No proprietary agents.
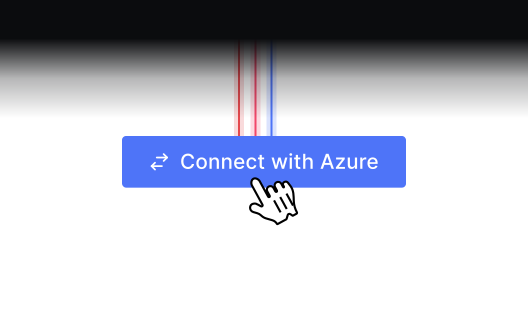
Integrate your Azure account - with just one click - no agents, no config files
SigNoz Cloud's One-Click Azure Integration deploys via an ARM template and automatically discovers your Azure resources. VMs, AKS, App Services, Container Apps, Blob Storage, Cosmos DB, and databases start sending metrics immediately - no manual OTel Collector setup required. The fastest path to full Azure visibility.
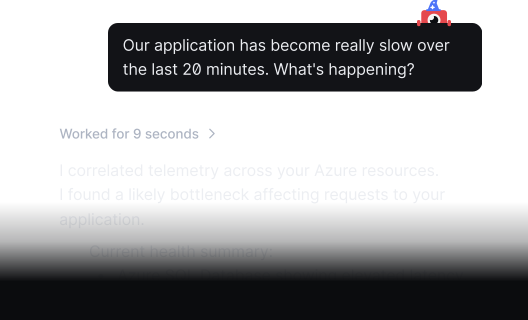
RCA of your Azure infrastructure in plain English. With Noz AI Assistant.
SigNoz MCP Server connects to Claude Code, Cursor, and other AI coding agents. Give your agent full Azure context, VM CPU, AKS pod status, App Service traces, SQL Database latency and debug production Azure issues without leaving your terminal. No separate AI SRE tool. Your Azure data stays in your environment.
Full AKS cluster visibility into pods, nodes, workloads, and application traces
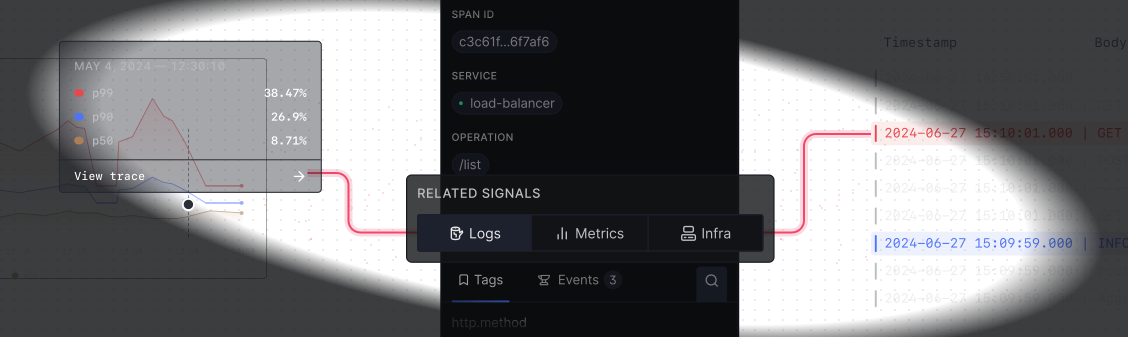
End-to-end distributed tracing for Azure App Service and Azure Functions
Instrument your App Service or Functions app with the OTel SDK and see p50/p90/p99 latencies, error rates, and service dependency maps alongside underlying Azure infrastructure metrics (CPU, memory, requests). See exactly which function invocation, downstream API call, or SQL query is the bottleneck.
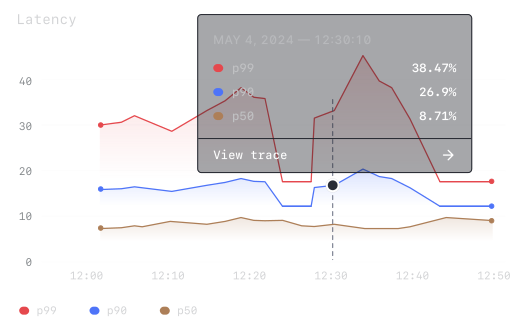
Single place to troubleshoot metrics, traces & logs
When an App Service latency alert fires, jump from the Azure infrastructure metric to the application trace to the log line that explains it without opening Azure Monitor, App Insights, and your log tool separately. SigNoz stores all three signal types in a single ClickHouse backend. One query surface. No manual correlation.
Your Azure instrumentation stays yours. Forever.
SigNoz is built on OpenTelemetry from day one, not just compatible. Every Azure VM metric, AKS pod trace, and App Service log uses standard OTel attributes: service.name, cloud.region, k8s.pod.name, correlated across signals automatically. No proprietary agents in your codebase. No re-instrumentation if you change backends.
Get started in minutes - First data in, first dashboards live no setup required
SigNoz ships with pre-built dashboard templates for Azure VMs, AKS, App Services, Container Apps, and database services. Import in one click. All templates are open source under Apache 2.0, maintained by the SigNoz community, and fully customisable. No dashboard-building required to get immediate Azure visibility.
One transparent price. No per-VM, per-metric, or per-query charges.
Azure Monitor charges per metric query and per GB of log ingestion. Most observability tools add another unpredictable bill on top - per host, per seat, or per custom metric. SigNoz Cloud charges $0.30/GB for logs and traces, $0.10 per million metric samples. No per-VM fees. No premium for OTel metrics. One number you can forecast.


