6 Silent Traps Inside CloudWatch That Can Hurt Your Observability
One of the most common things we hear from our users, is how AWS costs keep increasing with CloudWatch often playing a big role. CloudWatch has long been the default observability solution for AWS users. While it’s great for some use-cases, it’s also important to check out and weigh other alternatives which could be better suited for modern observability demands. Let’s examine some areas where modern observability platforms outweigh CloudWatch.

Metrics API Limits
CloudWatch imposes strict quotas on metric queries that can bottleneck performance at scale. For example, the GetMetricData API is limited to 50 requests/sec per region [for standard queries].
Each call can fetch at most 500 metrics in one batch, and there’s a cap on the rate of data points returned. Specifically, CloudWatch will throttle if you scan above 180,000 data points per second [for recent data] or 396,000 data points per second [for historical data], calculated over your query’s time range.
These limits mean large-scale dashboards or high-resolution queries can quickly hit throttling. In fact, the CloudWatch API will return errors like Too many datapoints requested if you overshoot these bounds. By contrast, open-source time-series databases [Prometheus, ClickHouse] that back platforms like Grafana and SigNoz are designed for high throughput and can be scaled horizontally without fixed query TPS [Transaction per second] limits.

SigNoz, for instance, uses ClickHouse [a columnar datastore] that enables fast aggregation queries even at millions of data points, allowing quicker root-cause analysis.
Log Query Concurrency
For log analytics, CloudWatch Logs Insights has constrained throughput. By default, only 30 concurrent log queries are allowed per account [and only 5 if you use the cheaper Infrequent Access log storage class].
Each Insights query can scan max 50 log groups [or 10,000 with wildcard selection], and results are limited to 10,000 rows in the console. This means at peak time you could have at most 30 users or automated queries running simultaneously and beyond that, queries will be queued or rejected.
Modern platforms built on Elasticsearch or ClickHouse [as used by SigNoz] support much higher concurrency by scaling the backend clusters. In fact, AWS felt the need to raise the Logs Insights limit from 10 to 20 and now 30 due to customer demand, highlighting how users were hitting the ceiling.
In contrast, SigNoz, offers a more scalable solution for log analytics. ClickHouse's architecture allows for high-throughput querying. This design enables SigNoz to handle a significantly higher number of concurrent log queries, making it well-suited for organisations requiring robust log analysis capabilities.
Pricing Model and Cost Predictability
CloudWatch uses a pay-as-you-go pricing model with charges in multiple categories including custom metrics, logs ingestion, log storage, API calls, dashboards, alarms, etc. There is no simple flat rate, and costs can scale unpredictably with usage. For a full breakdown of every billing bucket, see our CloudWatch pricing guide, and for actionable moves to reduce your bill, see the cost optimization playbook.
Let’s understand it’s gravity by comparisons and examples.

Metrics Cost
Critically, every single metric you publish costs money. In the US East region, the first 10,000 custom metrics are priced at 0.30$ per metric per month, then 0.10$ per metric for the next 240k, $0.05 for the next 750k, and $0.02 beyond 1M.
That means if you have, say, 20k metrics scraped every minute [common in a moderately sized Kubernetes cluster when each pod exports dozens of metrics], you’re paying about $3,000 for the first 10k and $1,000 for the next 10k.
$4k per month just for metrics.
On the other hand, if we consider platforms like SigNoz [cloud version] which uses a transparent and usage-based pricing model that helps prevent costs from ballooning. Let’s consider the same example and variables to calculate the costs incurred with SigNoz. Monitoring 20k metrics at a one minute interval in SigNoz results in approximately 864 million samples per month, priced at $0.10 per million samples.
This adds upto $86.40 per month.
Query and Dashboard Costs
Unbeknownst to some, CloudWatch even charges for retrieving metrics [querying]. API calls like cost GetMetricData $0.01 per 1,000 metrics requested.
CloudWatch also charges $3 per month for each custom dashboard beyond the first three. This means if you set up 10 team dashboards, you’re paying $21 per month just in dashboard fees.
Contrastingly modern observability vendors, say SigNoz, offer unlimited dashboards without additional charges and lets you query/ retrieve metrics without any extra charges, making it a better option.
Log Costs
CloudWatch Logs is often where AWS users see the biggest bills. The pricing has multiple dimensions — log ingestion costs $0.50 per GB for standard logs [with volume discounts at very high tiers], and log storage costs $0.03 per GB per month.
So if you ingest 100 GB of logs in a month, that’s $50 for ingest. Storing, say, 1 TB of logs for a month would be $30. On top of that, Logs Insights queries cost $0.005 per GB scanned. A complex query that scans 100 GB of logs amounts to $0.50 each run. This usage-based model can lead to shocks. For instance, a sudden spike in errors might generate 10 GB of extra logs, which then incur both ingest fees and query fees when you investigate.
Alternatives like BetterStack’s Logtail offer more predictable bundles — 30 GB per month free, then a fixed price per GB beyond [ $0.45 per GB for additional logs], with longer retention options at low cost.
Similarly, SigNoz offers 0.3$ per GB for log ingestion with 15 day retention along with hot and cold storage options.
Fragmentation of telemetry signals
CloudWatch splits metrics, logs, and traces into separate interfaces [CloudWatch Metrics/Alarms, CloudWatch Logs, X-Ray]. This fragmentation creates navigation friction when you’re diagnosing an issue.
For example, if you see a spike in a metric, there’s no one-click way to view the related logs; you must manually open the Logs Insights console and construct a query.

In contrast, platforms like SigNoz unify the three pillars together. SigNoz provides a single pane to view metrics, traces, and logs together. You can click on a trace span and see the logs for that operation immediately, or jump from an error log to the trace and related metrics.
High-Volume Trace Performance
Let’s explore how trace performance holds up under high volumes of traces across CloudWatch and modern observability platforms. AWS X-Ray, the distributed tracing tool integrated with CloudWatch, is AWS’s native solution for this. But it comes with some well-known limitations, let’s take a closer look.
Time Range Query Constraint
There is a known limitation that the AWS X-Ray console can only query traces within a 6-hour time range at a time. Even though X-Ray retains trace data for 30 days in the backend, the UI will not allow viewing a full day or week span.
This makes analyzing longer-term trends or comparing trace rates over time very cumbersome. In contrast, SigNoz and Jaeger UIs allow selecting arbitrary time ranges [limited by data retention] for trace searches.
If you want to see all traces in the last 24 hours for a certain service, you can do that in SigNoz’s interface, whereas in X-Ray you would have to run 4 separate 6-hour queries and manually aggregate the information.

Trace Document Size
If a trace [with all its segments/subsegments] exceeds 100 KB in size, X-Ray will truncate it and cannot display the entire trace.
In practice, this means a complex transaction that involves, say, hundreds of microservice calls or a deeply recursive workflow might not be fully viewable in the X-Ray console. This is a significant drawback for high-volume distributed systems, exactly when you need tracing the most [to see all the pieces of a large transaction], the tool gives up.

SigNoz, stands a class apart here since it’s designed to handle traces with up to 1 million spans without enforced size limits. The system is optimised to process and visualise large traces efficiently, ensuring complete trace data is available for analysis.
User Experience & Design
This is a more personal opinion and is highly subjective. Trying out an observability platform like SigNoz, after being a CloudWatch user definitely feels like a “culture shock”. If a platform falls short on user experience but delivers its promises, we often overlook the lack of ease in usage.
But that’s only until you discover a product that offers both great user experience and delivers on its promises strongly.


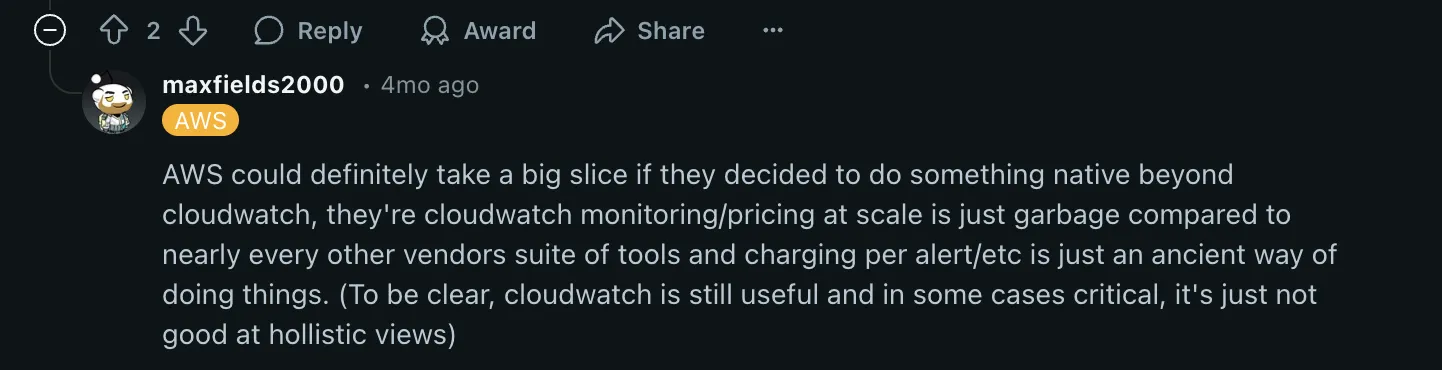
Personally I appreciate the efforts put into making user experience a breeze by SigNoz and Datadog! Below are a few reddit threads of users not being happy with CloudWatch UI and experience.

Quick Comparison Chart
Here’s a quick comparison chart for you.
| Feature/ Aspect | CloudWatch | Modern Observability Platforms |
|---|---|---|
| Native AWS Integration | ✅ Deep integration with AWS services | ⚠️ Requires setup for AWS but supports multi-cloud |
| Easy Setup for AWS Metrics | ✅ One-click setup within AWS | ⚠️ Requires instrumentation via OpenTelemetry |
| Correlation Across Signals | ❌ Manual effort needed | ✅ Seamless correlation between logs, metrics, traces |
| OpenTelemetry Support | ⚠️ Partial, not first-class | ✅ Native support for OpenTelemetry |
| Dashboard Performance | ❌ Slow and limited interactivity | ✅ Fast, dynamic, and responsive dashboards |
| Visualisation Flexibility | ❌ Basic widgets, no templating | ✅ Rich visualisations, filters, and templating |
| Querying & Analysis at Scale | ❌ Can become slow and unreliable | ✅ Designed for high-scale querying |
| Cost Efficiency at Scale | ❌ Bills can spike unexpectedly | ✅ Optimised for scale and cost-control features |
| Vendor Lock-in | ❌ Tightly coupled to AWS | ✅ Open standards, vendor-neutral |
| Alerting Capabilities | ✅ Supports alarms and auto-actions | ✅ Advanced alerts with anomaly detection, SLOs |
| Reliability at High Scale | ❌ Known for metric delays/misses under load | ✅ Built for high-scale, real-time use cases |
CloudWatch works for many use cases, especially if you're deep into AWS. But as your systems scale and span across environments, you need something that handles all signals well and brings everything together in one place. That’s when it’s time to rethink your observability stack and explore options that truly fit your needs.
