How Distributed Tracing augments the APM experience?
There are standalone distributed tracing tools like Jaeger, and there are APM tools that do not provide distributed tracing capabilities. In this article, we will see how distributed tracing complements an APM tool for a holistic performance monitoring experience.
Both APM and distributed tracing are critical tools to understand the performance of your applications. And if your application is facing performance issues impacting customer experience, you need to understand what’s causing it fast.
The goal of both APM and distributed tracing tools should thus be to help you understand performance issues in your application as quickly as possible.
APM vs. Distributed Tracing
APM vs. Distributed Tracing is not a meaningful comparison. Most applications have some kind of APM tool in place. APM tools have a number of features that help developers track application performance. Distributed tracing is a specific technology to track how user requests are performing in a distributed system like a microservices-based application.
Let’s have a brief overview of APM and distributed tracing.
What is APM?
APM stands for Application Performance Management or Application Performance Monitoring. You may wonder, what’s the difference? The term ‘management’ can signify a proactive approach, and the term monitoring can signify a reactive approach. But it doesn’t matter as long as the organization using APM can keep their application performance in check.
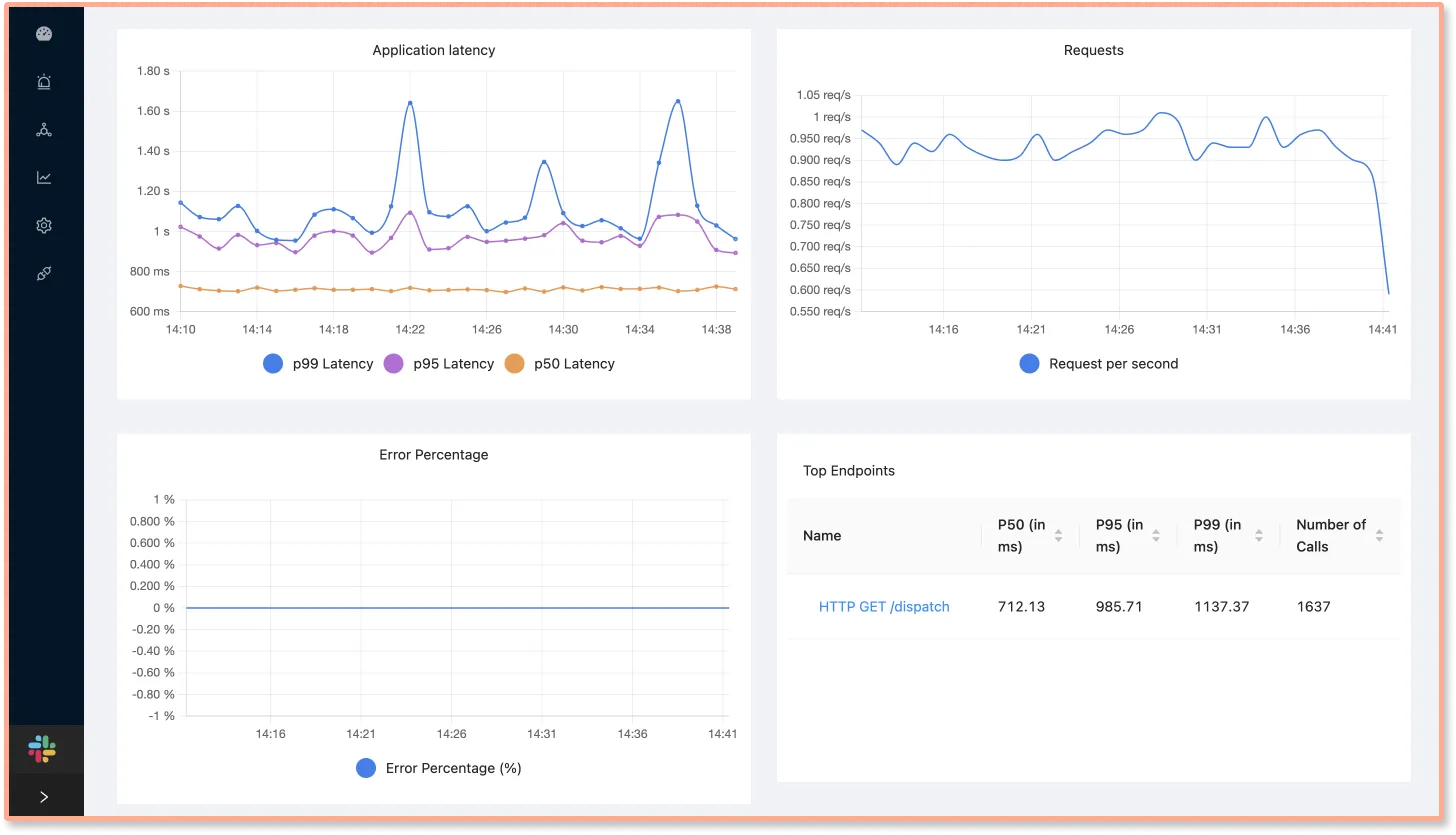
Some of the common capabilities of APM are as follows:
- Track application latency
- Track error rates
- Track request rates, top endpoints, external and DB calls
Apart from application metrics, some APM tools can also provide host, infrastructure, and network metrics. There is no end to what can be captured in terms of data, but the real value addition is to enable application owners to stay ahead of any potential performance issues.
What is Distributed Tracing?
Distributed tracing is a technology that tracks user requests across services, networks, and protocols and creates a complete picture of how your distributed system performed while processing a user request. It is the best-suited technology for analyzing application performance in distributed systems like microservices, serverless, and lambda.
In modern-day cloud-native applications, a single user request triggered at the frontend web or mobile client can go through hundreds or thousands of services before serving the user what they need. As a result, it’s almost impossible for a single team to keep track of everything that happens to a user request. That’s where distributed tracing comes into the picture.
Read our complete guide on Distributed Tracing
Distributed tracing works by passing by context object along the execution path of a user request. The context ID correlates a user request across network boundaries, processes, and protocols.
The data collected by distributed tracing is known as trace data. Trace data can be visualized in different formats to give you an idea of how the components of your application architecture interacted to process a user request.
Common visualization formats include Flamegraphs and Gantt Charts.
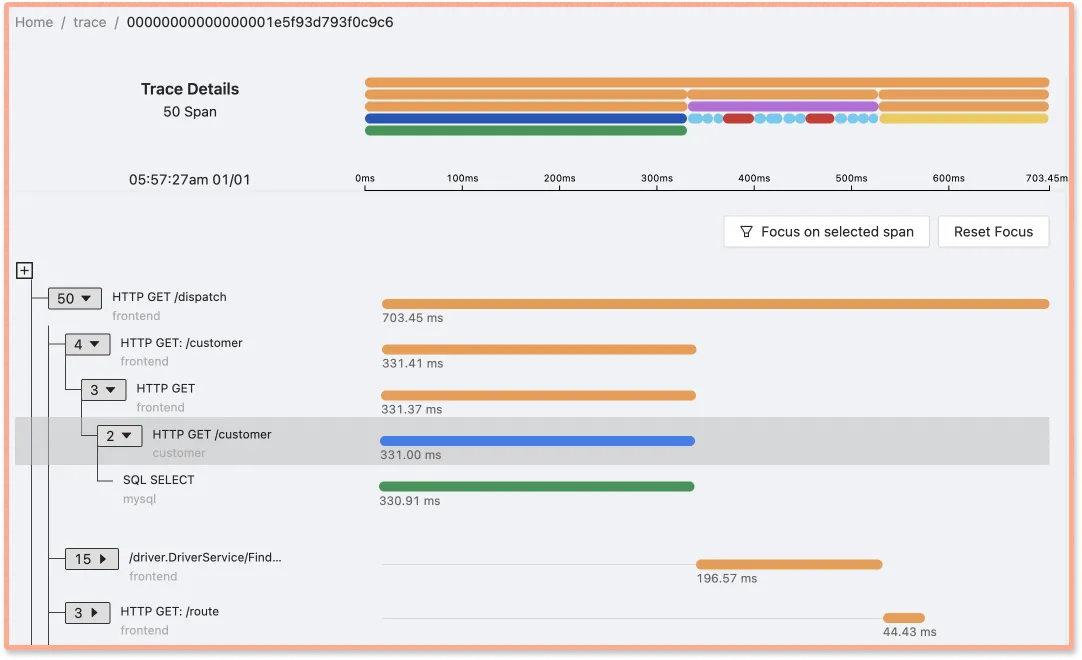
Tracing data visualized as Flamegraph and Gantt chart. (Source: SigNoz dashboard)
APM and Distributed Tracing
Although there are standalone distributed tracing tools like Jaeger, you need an integrated experience of APM and distributed tracing. Engineering bandwidth is costly, and although bugs can’t be avoided, they should be resolved as fast as possible.
An APM tool that also provides the capability to implement distributed tracing can reconstruct an end-to-end picture of a distributed system like a microservices-based application.
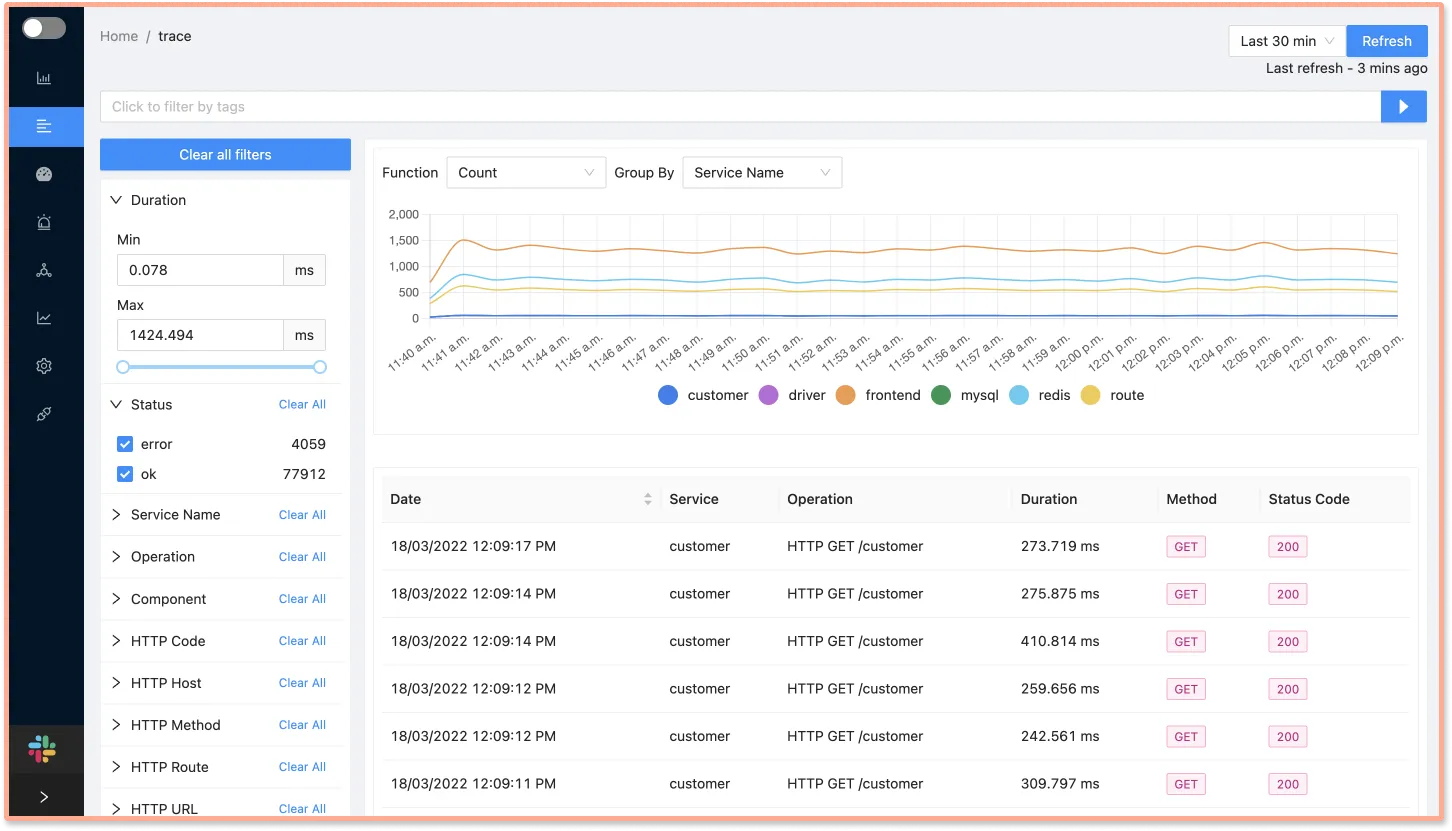
For example, let’s suppose that you notice high latency in one of your services during a particular duration. You will need to dig deeper at that timestamp to identify the bottlenecks. In an APM tool that also provides distributed tracing, the tracing data is correlated with application metrics.
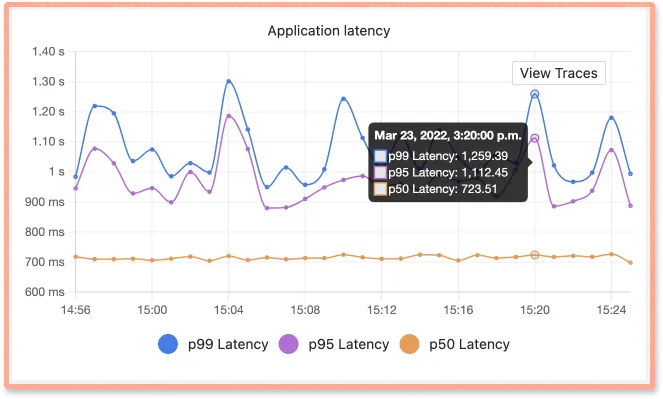
You can click on View Traces to see the tracing data at a timestamp of high latency. (Source: SigNoz dashboard)
Once you access the tracing data, you can identify the exact events that caused the latency issues. Distributed tracing makes the root cause analysis of performance issues much quicker.
For microservices-based applications, it is critical for application owners to see how a specific event fits in the scheme of its entire user request. Tracing data in the form of Flamegraphs and Gantt charts can give you that picture.
APM gives you application metrics that when combined with distributed tracing can empower engineering teams to troubleshoot complex issues quickly.
Getting started with APM and Distributed Tracing
SigNoz Cloud is the easiest way to run SigNoz. Sign up for a free account and get 30 days of unlimited access to all features.

You can also install and self-host SigNoz yourself since it is open-source. With 24,000+ GitHub stars, open-source SigNoz is loved by developers. Find the instructions to self-host SigNoz.
Further Reading
Examples of Distributed Tracing
More articles on Distributed Tracing
