Implementing Distributed Tracing in a Nodejs application
In this article, we will implement distributed tracing for a nodejs application based on microservices architecture. To implement distributed tracing, we will be using open-source solutions - SigNoz and OpenTelemetry, so you can easily follow the tutorial.
In modern microservices-based applications, it is difficult to understand how requests are performing across multiple services, infrastructure, and protocols. As companies began moving to distributed systems, they realized they needed a way to track requests in their entirety for debugging applications. Distributed tracing is a technology that was born out of this need. Let’s have a brief overview of distributed tracing.
What is distributed tracing?
In a microservices architecture, a user request travels through hundreds, even thousands of services before serving the user what they need. Engineering teams often responsible for maintaining single services have no visibility over how the system performs as a whole.
Read our complete guide on Distributed Tracing
Distributed tracing gives insights into how a particular service is performing as part of the whole in a distributed software system. It involves passing a trace context with each user request which is then passed across hosts, services, and protocols to track the user request.
In this article, we will use OpenTelemetry and SigNoz to enable distributed tracing in a sample nodejs application.
OpenTelemetry and SigNoz
OpenTelemetry is a vendor-agnostic set of tools, APIs, and SDKs used to instrument applications to create and manage telemetry data(Logs, metrics, and traces). It aims to make telemetry data(logs, metrics, and traces) a built-in feature of cloud-native software applications.
OpenTelemetry provides the instrumentation layer to generate and export your telemetry data to a backend. Then, you need to choose a backend tool that will provide the data storage and visualization for your telemetry data. That’s where SigNoz comes into the picture.
SigNoz is a full-stack open-source APM tool that provides metrics monitoring and distributed tracing.
We will demonstrate implementing distributed tracing in a nodejs application in two sections:
- Running a sample nodejs application with OpenTelemetry
- Visualizing traces data with SigNoz dashboards
Running a sample nodejs application with OpenTelemetry
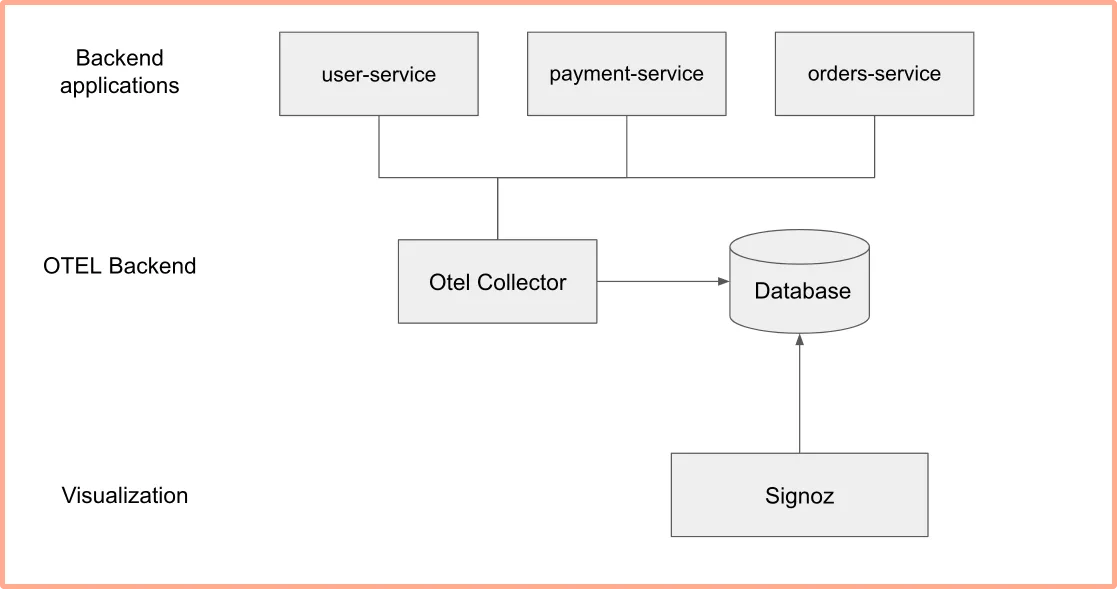
The sample nodejs application will have three microservices:
- user-service
- orders-service
- payment-service
Here’s the architecture of the sample application along with OpenTelemetry and SigNoz.
Pre-requisites
- Node JS 14 or newer
Download the latest version. - MySql 8
- SigNoz
Installing SigNoz
SigNoz can be installed on macOS or Linux computers in just three steps by using a simple install script.
The install script automatically installs Docker Engine on Linux. However, on macOS, you must manually install Docker Engine before running the install script.
git clone -b main https://github.com/SigNoz/signoz.git
cd signoz/deploy/
./install.sh
You can visit our documentation for instructions on how to install SigNoz using Docker Swarm and Helm Charts.

When you are done installing SigNoz, you can access the UI at http://localhost:3301/application
Installing MySql
Download MySQL community version from here based on your operating system.
Once installation is complete, run the below commands to create a database for our sample nodejs app.
$ mysql -u root
mysql> create database signoz;
mysql> use signoz;
If you have MySQL already installed and is configured with a password, you might need to update the password in the sample app here.
Running sample application
Below are the steps to run the sample nodejs application with OpenTelemetry:
-
Clone sample nodejs app repository and go to the root folder
We will be using a sample nodejs app at this GitHub repo.git clone git@github.com:SigNoz/distributed-tracing-nodejs-sample.git cd distributed-tracing-nodejs-sample -
Install the required dependencies
You can check out the depencies required frompackage.jsonfile. Install all the required dependencies for the sample application usingnpm. Also, install typescript and ts-node-dev globally.npm install npm install -g typescript npm install -g ts-node-devOpenTelemetry needs the following packages to instrument the nodejs app.
@opentelemetry/sdk-node- This package provides the full OpenTelemetry SDK for Node.js including tracing and metrics.@opentelemetry/auto-instrumentations-node- This module provides a simple way to initialize multiple Node instrumentations.@opentelemetry/exporter-trace-otlp-http- This module provides the exporter to be used with OTLP (http/json) compatible receivers. -
tracer.tsfile
In order to instrument our services, we will create a singletracer.tsfile and use it to instrument all three services.We need to initialize OpenTelemetry before our application gets loaded. If your application begins requiring packages before OpenTelemetry is set up, it can create issues. You can initialize OpenTelemetry by using the code as shown below:
import init from "./tracer";
const { sdk } = init("order-service"); // provide service name to view in signoz dashboard
You can check out the code sample here.
-
Setting up SigNoz as the OpenTelemetry backend
We have set up environment variables required by OpenTelemetry in thescriptssection ofpackage.json. To set up OpenTelemetry to collect and export telemetry data, you need to specify OTLP (OpenTelemetry Protocol) endpoint. It consists of the IP of the machine where SigNoz is installed and the port number at which SigNoz listens.OTLP endpoint for SigNoz -
<IP of the machine>:4318Here's the
scriptssection to run the microservices:"scripts": { "payment": "OTEL_EXPORTER_OTLP_ENDPOINT=127.0.0.1:4318 OTEL_RESOURCE_ATTRIBUTES=service.name=PaymentService ts-node-dev -r ./src/tracer.ts ./src/payment-service.ts", "users": "OTEL_EXPORTER_OTLP_ENDPOINT=127.0.0.1:4318 OTEL_RESOURCE_ATTRIBUTES=service.name=UserService ts-node-dev -r ./src/tracer.ts ./src/user-service.ts", "orders": "OTEL_EXPORTER_OTLP_ENDPOINT=127.0.0.1:4318 OTEL_RESOURCE_ATTRIBUTES=service.name=OrderService ts-node-dev -r ./src/tracer.ts ./src/order-service.ts" }, ...You can check the file here.
If you have installed SigNoz on your local machine, then your endpoint is
127.0.0.1:4318.If you have installed SigNoz on some domain, then your endpoint is
http://test.com:4318 -
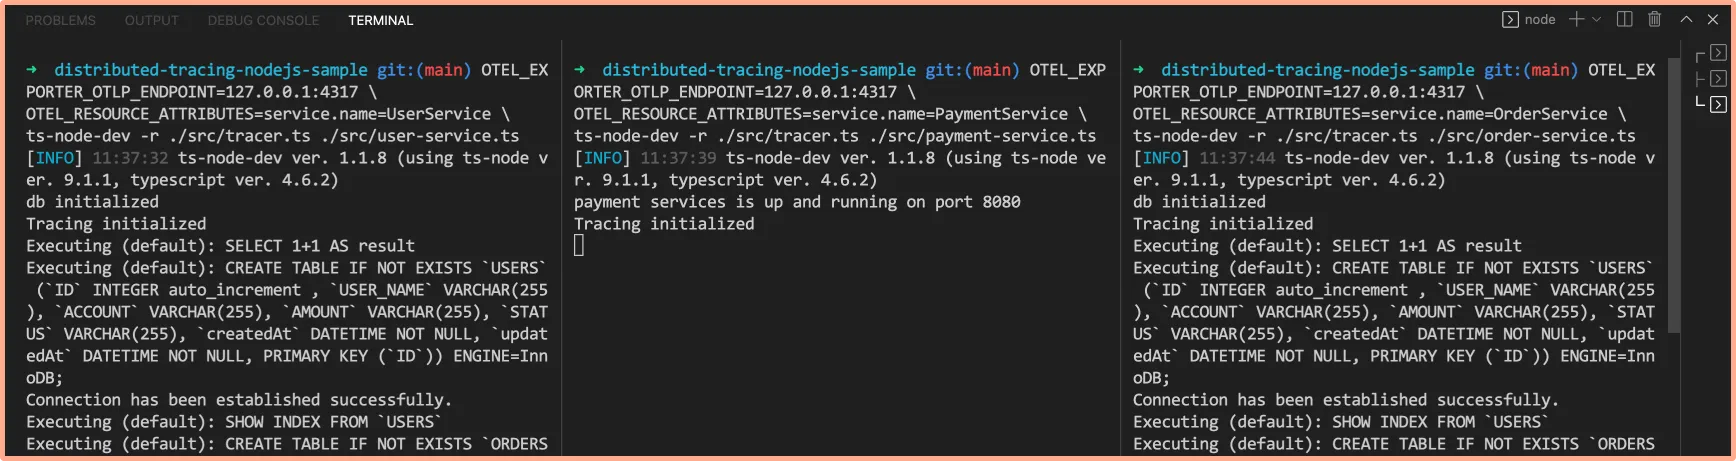
Run the microservices
From the root folder of your application on your terminal, run each microservice.npm run users npm run payment npm run ordersEnsure that the microservices are running on different ports. As earlier mentioned, you can set ports using the
.envfile. Your microservices ports are setup in the.envfile as shown below:ORDER_PORT = 8082; USERS_PORT = 8081; PAYMENT_PORT = 8080;You can check the file in the cloned repo.
-
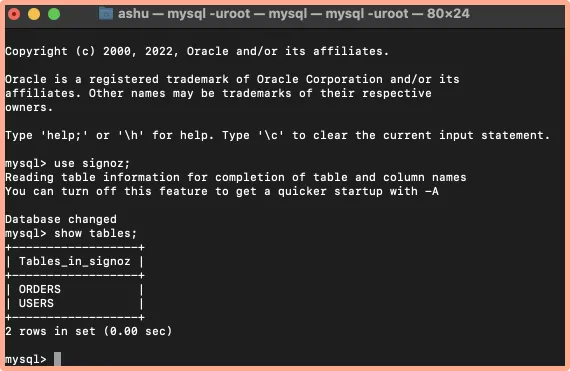
Confirm table creation
After running the services, check if the tablesORDERSandUSERSare created using the commands below:mysql> use signoz; mysql> show tables;
Visualizing traces data with SigNoz dashboards
To visualize the traces data with SigNoz, we first need to generate some user data by interacting with the sample nodejs application.
Generating user data by interacting with the sample app
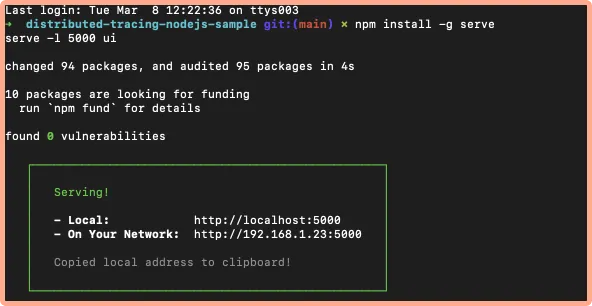
You need to generate some user data to see how it appears in the SigNoz dashboard. The sample application comes with an UI to interact with the app. Use the below command in the root folder to launch the UI:
npm install -g serve
serve -l 5000 ui
This will run the app UI on port 5000. Open the UI at http://localhost:5000/.
- Create a new user
ClickCreate Userbutton to create a new user in the MySQL db.
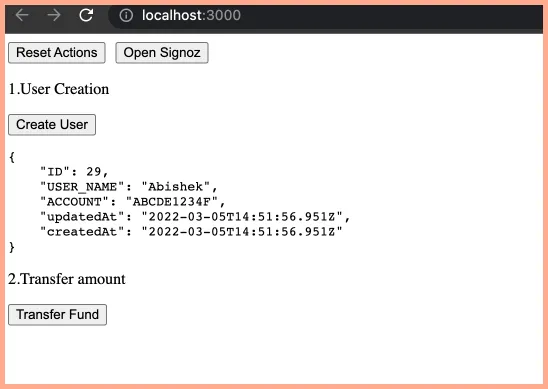
- Transfer some amount
Transfer some amount by clickingTransfer Fundbutton.
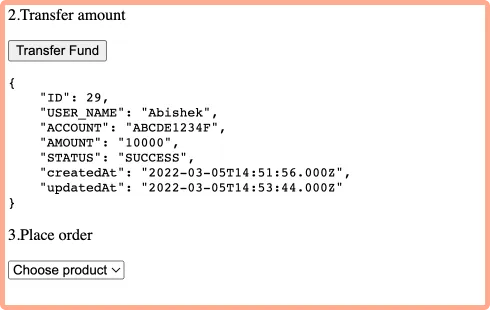
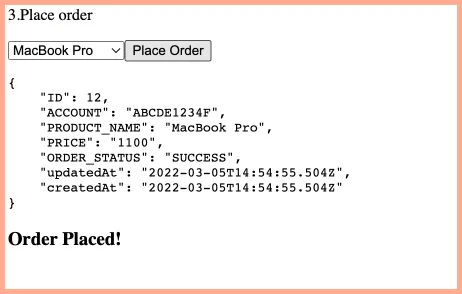
- Place an order
Place an order by selecting a product from dropdown.
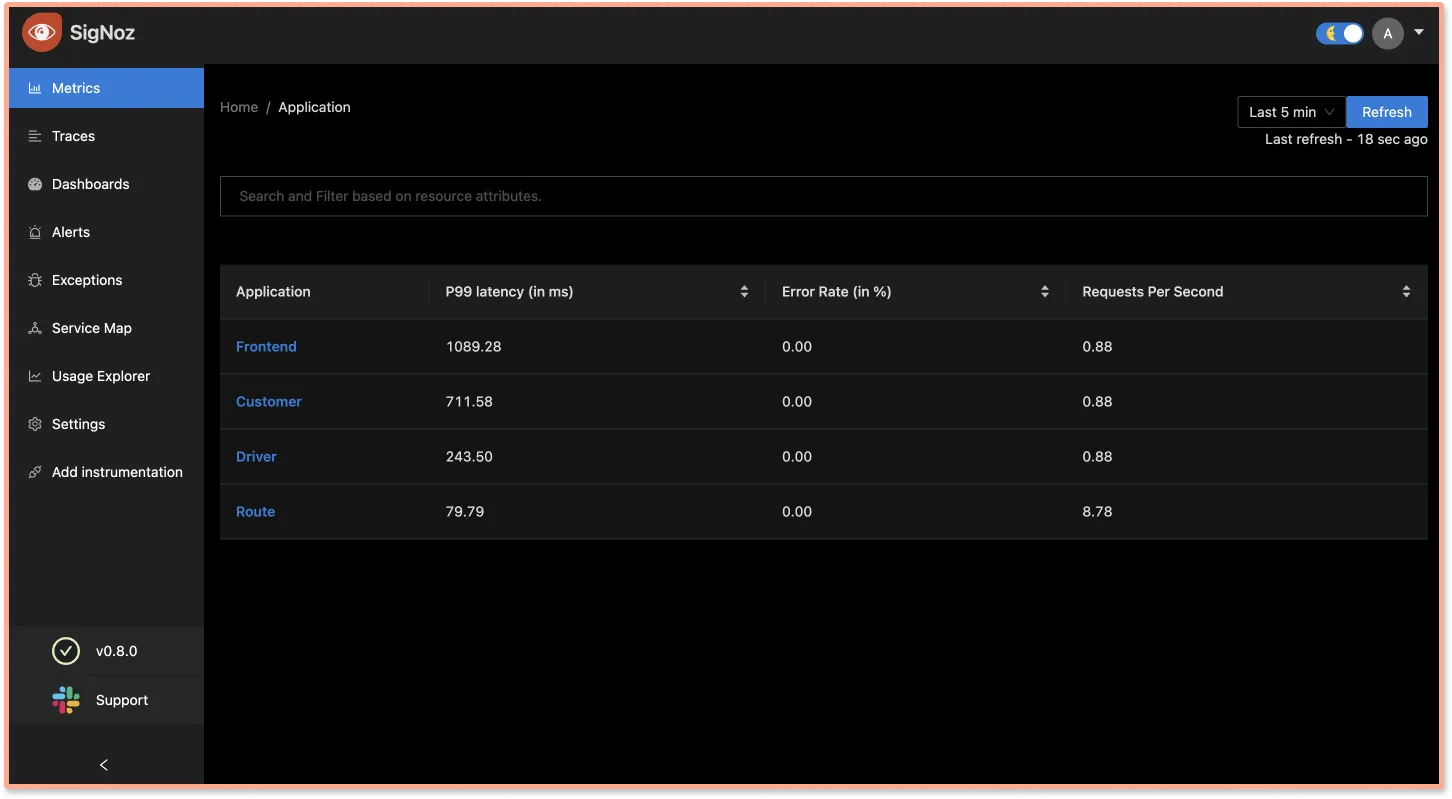
Now go to SigNoz dashboard, wait for sometime and refresh the dashboard. You will notice the list of service names that we configured:
- user-service
- order-service
- payment-service
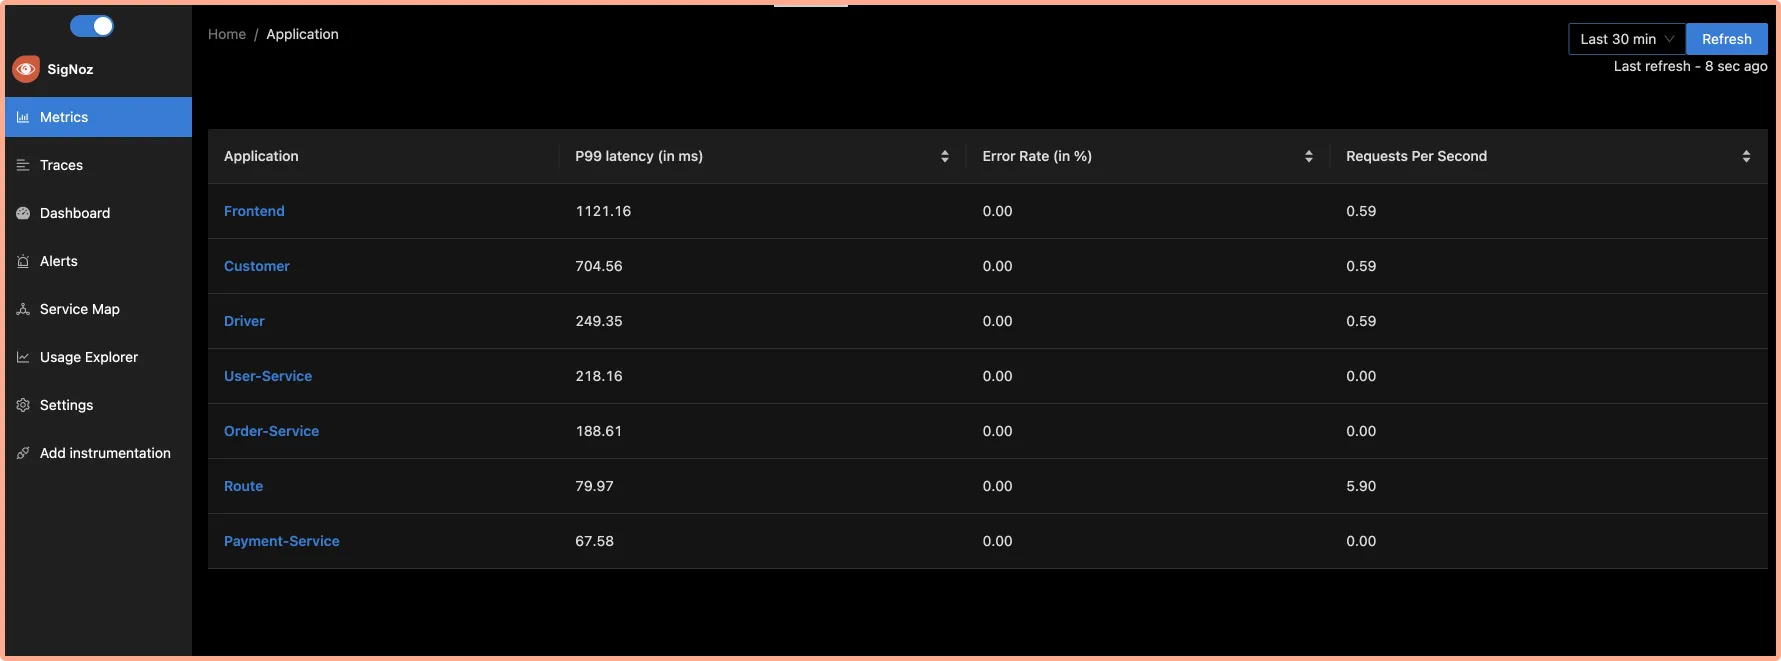
You can play around with the dashboard to see what data is captured. Below is a handy guide on how to use the SigNoz dashboard to see the captured data.
Capturing MySQL traces
To view MySQL traces add below opentelemetry package:
npm install @opentelemetry/instrumentation-mysql2
Now, make the following changes in your tracer.ts file:
const { MySQL2Instrumentation } = require('@opentelemetry/instrumentation-mysql2')

.....
const sdk = new opentelemetry.NodeSDK({
    traceExporter,
    instrumentations: [
			getNodeAutoInstrumentations(),
      new MySQL2Instrumentation()
	 ],
    resource: new Resource({
      [SemanticResourceAttributes.SERVICE_NAME]: serviceName,
    }),
  })
.....
Restart the microservices, and generate new usage data in order to see traces related to MySQL events.
How to use SigNoz dashboard to analyze traces
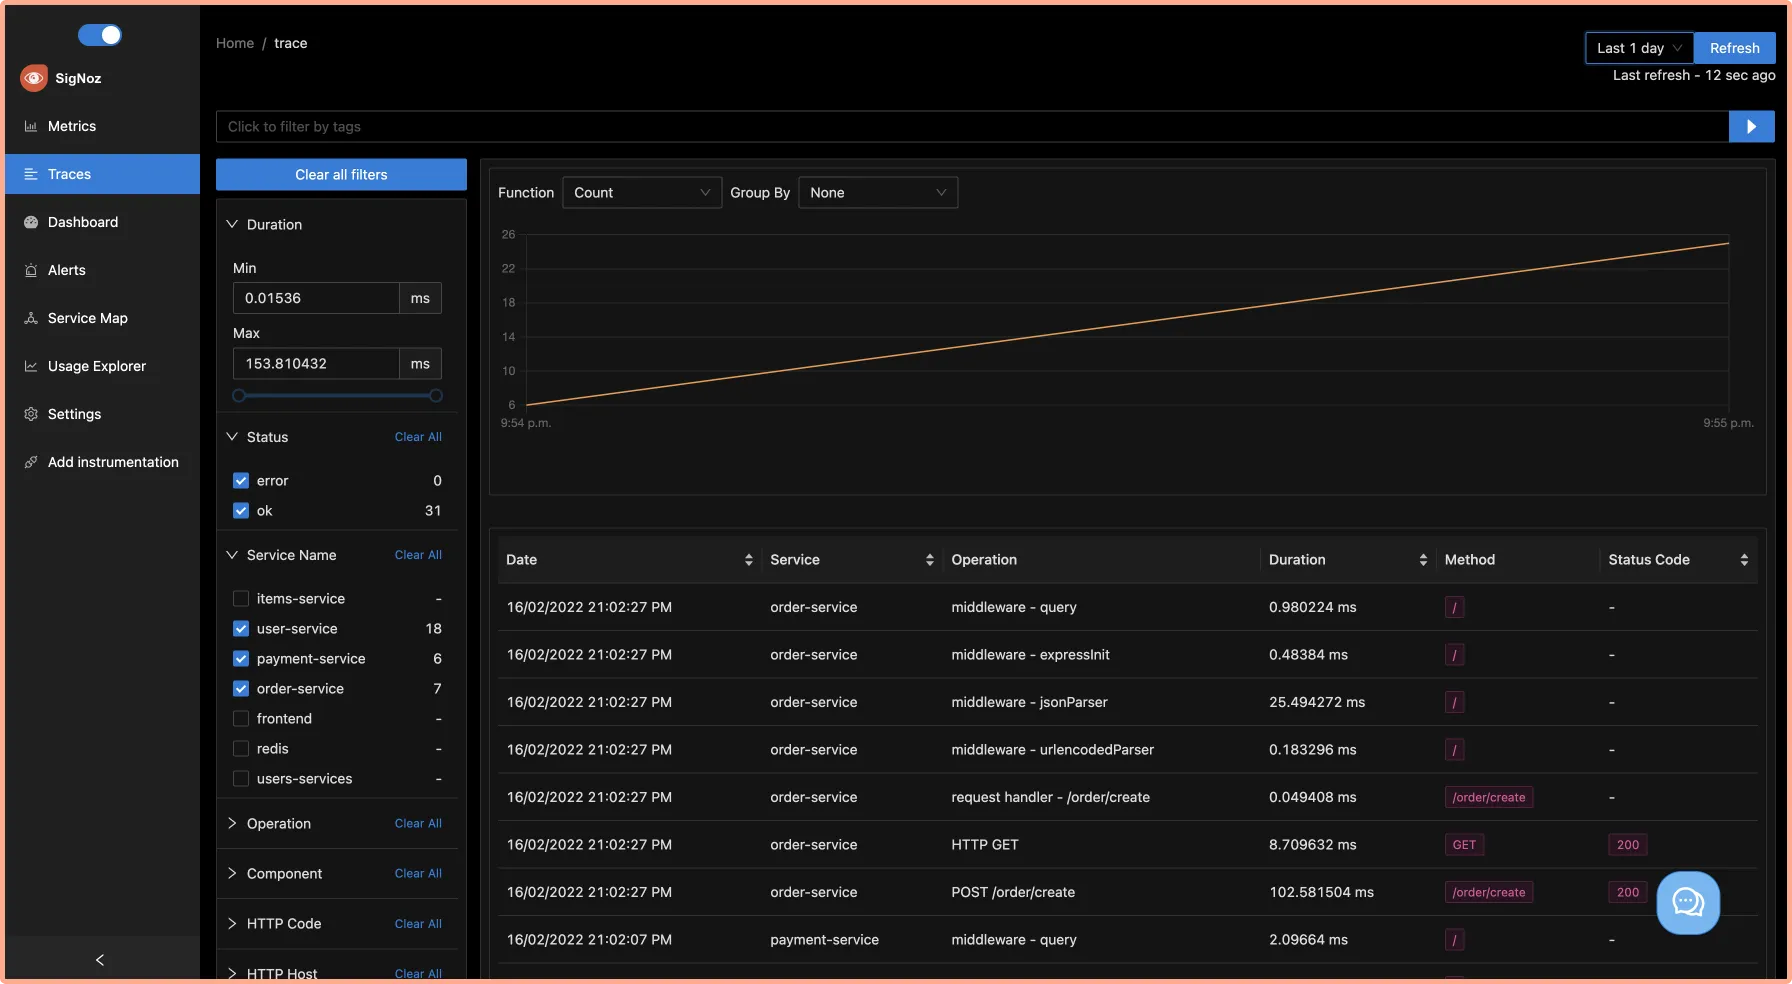
The traces tab of SigNoz dashboard provides powerful filters to analyze the traces data. You can use a number of filters to see traces data across many dimensions.
- See the count of requests by service and HTTP Status code
-
Identify latency issues with Flamegraphs and Gantt charts
You can inspect each event in the table with flamegraphs and Gantt charts to see a complete breakdown of the request. Establishing a sequential flow of the user request along with info on time taken by each part of the request can help identify latency issues quickly. Let’s see how it works in case of our sample nodejs app.Go to operation filter on the left navigation apply two filters
GET /payment/transfer/:idand service namepayment-service. Click on the single event listed in the table as shown below:
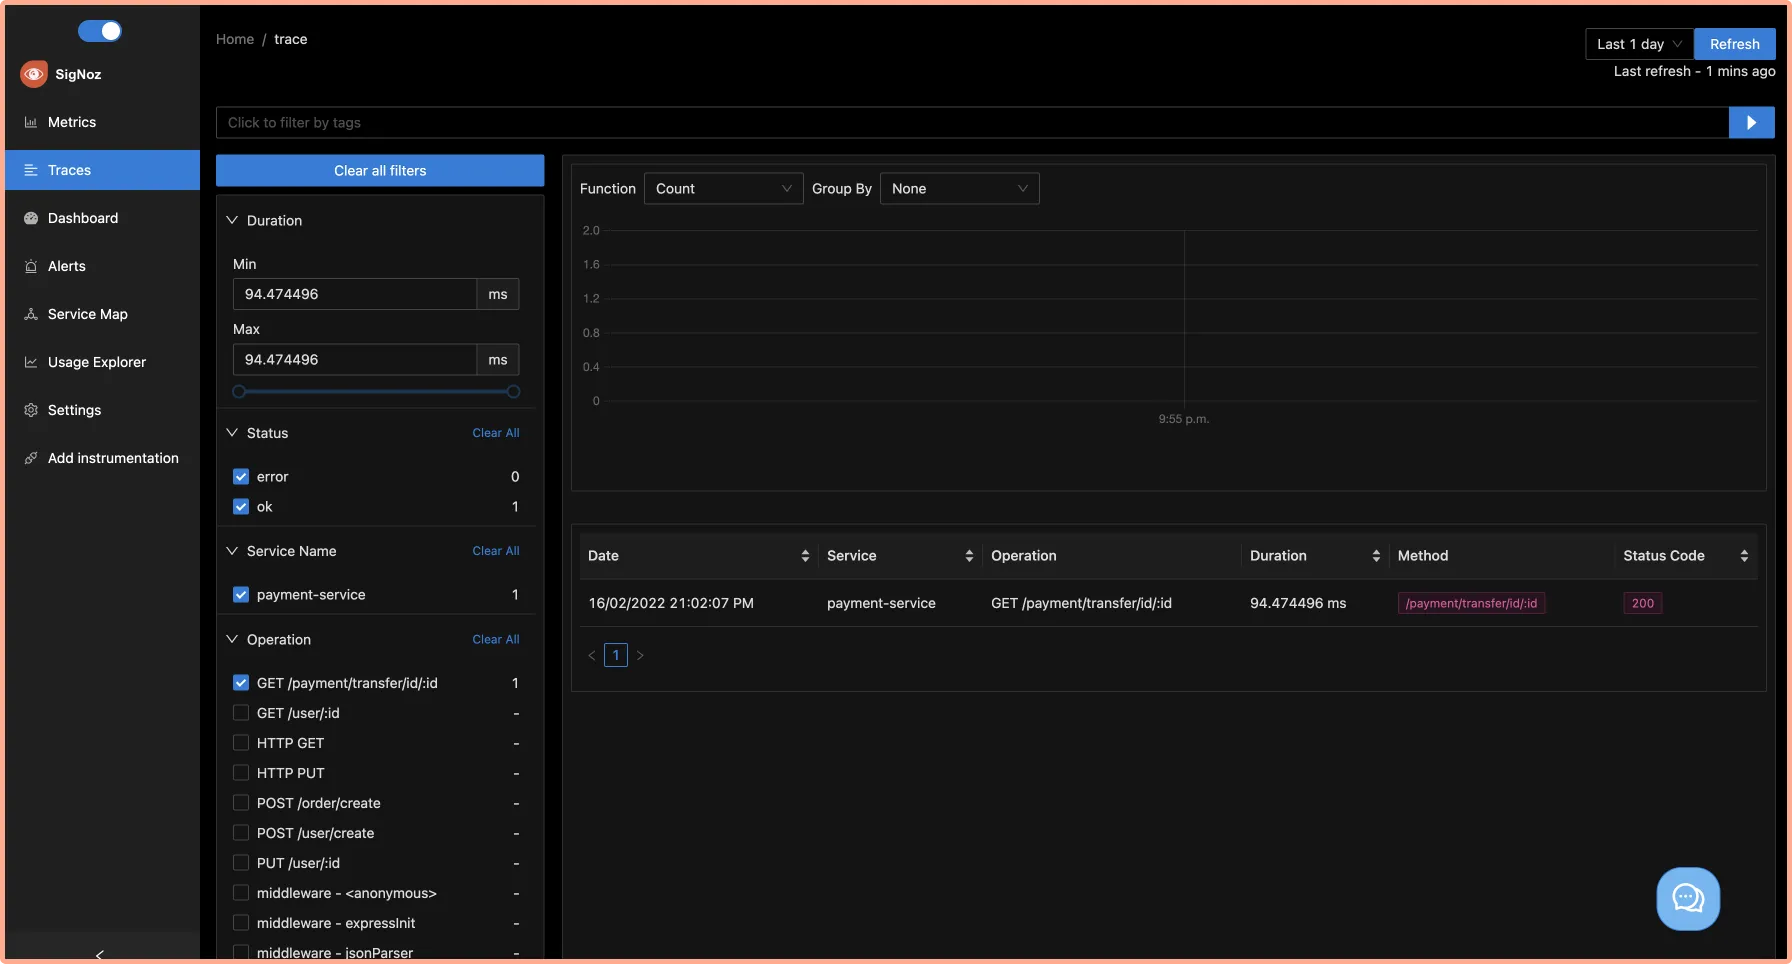
You will be able to see the flamegraph of the selected event which shows how the request traveled between the payment and the user-service. You can also use the Gantt chart to analyze each event in detail.
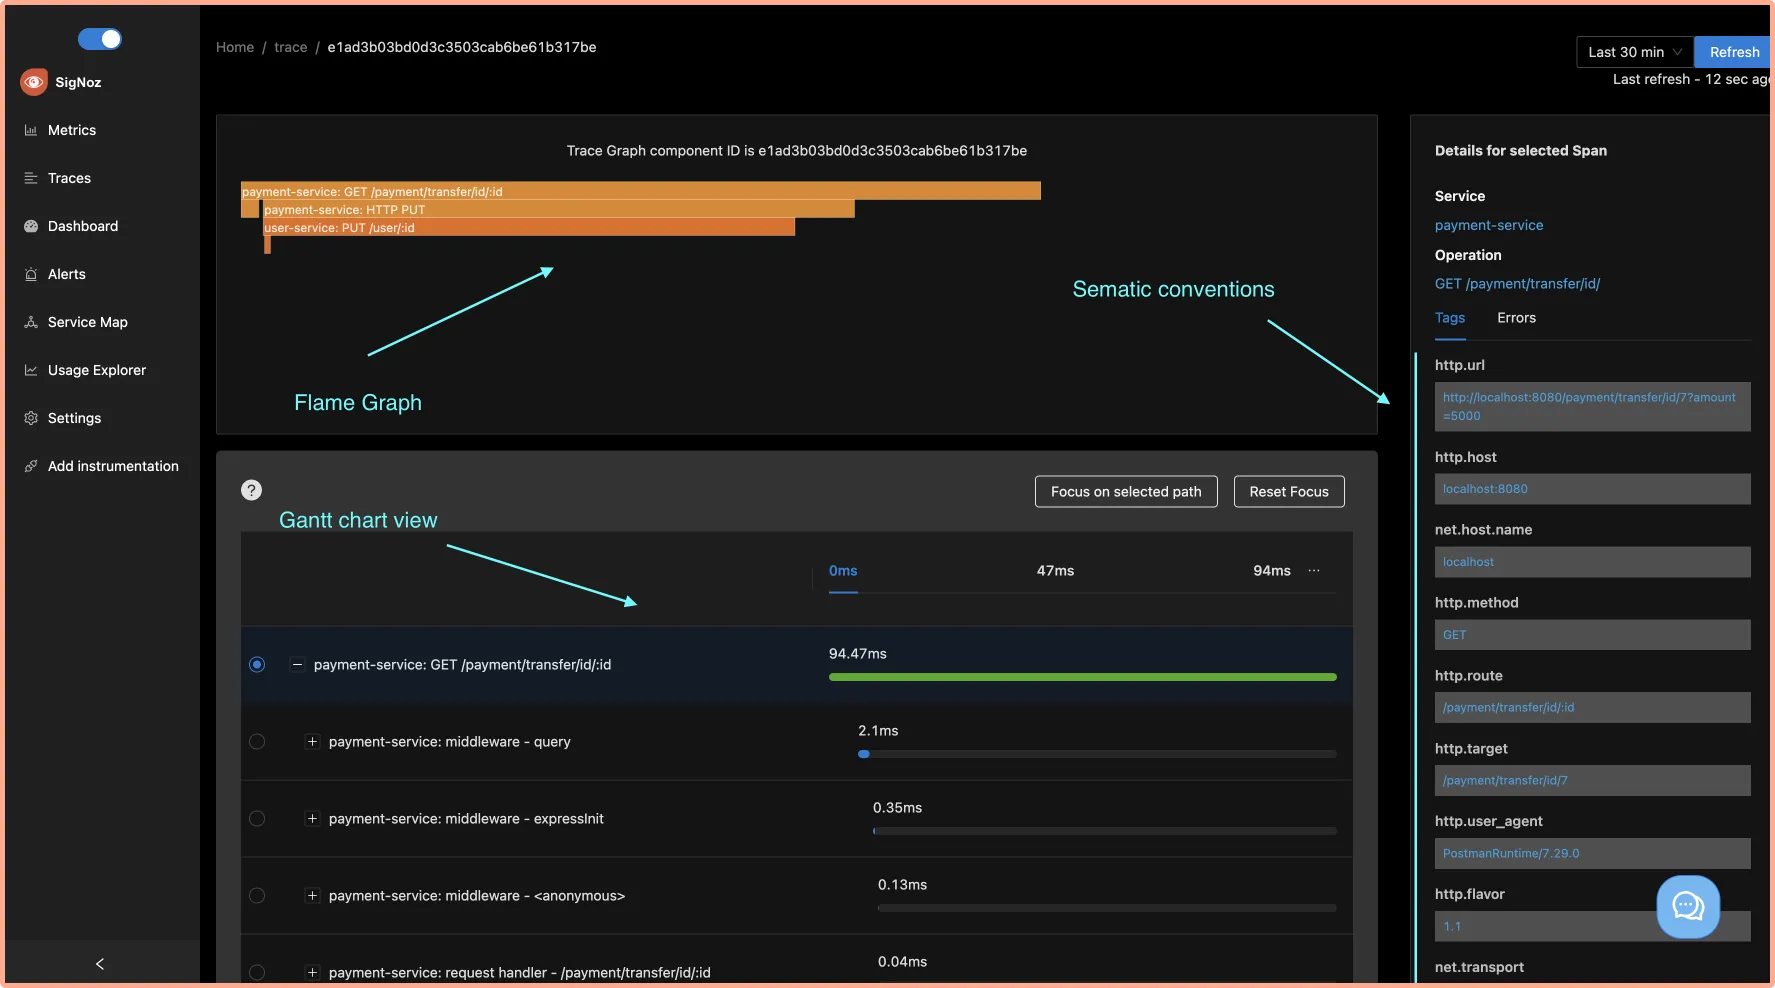
SigNoz also provides a detailed view of common semantic conventions like HTTP, network, and other attributes.
The end-to-end tracing of user requests can help you to identify latency issues quickly.
Conclusion
Distributed tracing is a powerful and critical toolkit for developers creating applications based on microservices architecture. For nodejs applications based on microservices architecture, distributed tracing can enable a central overview of how requests are performing across services which is needed for quick debugging.
OpenTelemetry and SigNoz provide a great open-source combo to implement distributed tracing for your nodejs applications. You can check out SigNoz by visiting its GitHub repo 👇
If you are someone who understands more from video, then you can watch the below video tutorial on the same with SigNoz.
If you have any questions or need any help in setting things up, join our slack community and ping us in #support channel.

Read more about distributed tracing from SigNoz blog 👇
