AWS ECS Monitoring | Breaking out of the observability vendor lock-in with SigNoz
In the not-too-distant past, the debate was between on-prem and cloud-native. You’re now faced with the choice of choosing between the different cloud infrastructure providers, and inevitably, someone will throw in the phrase “vendor lock-in”. And not having a response for the famed “vendor-lockin” sometimes leads to building things that are much more complex than required basis the stage that the product is in. In this one, I’d like to talk to you about how you can break out of the cursed vendor-lockin while using AWS ECS to manage your workloads.
AWS ECS is a managed service container orchestration service from AWS. It’s easy to set up, manage, and does the job. You don’t need to configure a bunch of pods, services, deployments, daemon sets, yada yada yada to run an app that responds with “hello world”. Sometimes a few clicks are all you need, and that's just what ECS does. Coming back to vendor lock-ins, through this article I’d like to take you through the architecture and the process through which we leverage the container orchestration capabilities of ECS without depending on AWS for logging, distributed tracing, metrics, alerts, and visualizations. You’re damn right, Christmas came early for you!
How to Monitor AWS ECS Workloads with OpenTelemetry
On instrumentation, the modern path for ECS workloads is the AWS Distro for OpenTelemetry (ADOT): run the ADOT Collector as a sidecar or daemon in your task definitions to collect traces and metrics from your containers and ship them to a backend. That keeps your ECS telemetry vendor-neutral, whether you visualize it in CloudWatch, SigNoz, or elsewhere.
If you use AWS copilot cli to deploy applications on AWS ECS Fargate, the complete process of deploying your application becomes a walk in the park. Take a look at this article for a quick walk-through. To know how to configure canary deployments for ECS workloads you can go through this article right here. You got that right, anything ECS and Wednesday got your back.
Depending only on logs to debug issues, identify bottlenecks, and pinpoint potential points of failure is a thing of the past. Having the right tools to monitor the health, behavior, and performance of your application is essential - conventionally with ECS this is done using AWS CloudWatch Logs, Metrics, Alarms & AWS X-Ray. These tools are amazing to get off the ground and get started. However, they are limited in functionality and are increasingly expensive as traffic increases and you need to scale your operations.
Fret not, I don’t come to instil fear, I come bearing gifts.
In these dark and perilous times, SigNoz decided to come in and save the day. SigNoz is an open-source APM(Application Performance Monitoring) tool. It helps developers monitor their applications & troubleshoot problems. It is open source and is a one-stop solution for developers to view their application’s logs, traces, and metrics.
I wish I was paid for this (nudge-nudge SigNoz). Here is why I like SigNoz over the AWS Services for observability
-
It shows you the traces, metrics, and logs of your application in one place. This makes it much easier for you to troubleshoot issues, without switching between different services.
-
It is much cheaper than other paid APM alternatives like data dog and is also cheaper than using AWS cloudwatch and AWS X-ray. Here is an article that compares the pricing between datadog and SigNoz.
-
It is open-source, so you can host it on your own infrastructure and you can monitor your data without it ever leaving your servers. If you want you can even host your own clickhouse cluster to store your data but deploy your services on AWS.
-
It uses open telemetry to collect data so it is language-agnostic and can be used with any stack of your choice.
-
It also uses clickhouse, an OLAP database that has significant performance improvement and consumes fewer resources than other log storage solutions. Here is an article about why Cloudflare migrated from Elastic search to clickhouse.
You're not wrong to point out that they are the new kid on the block, however, they are battle-tested. They are used by companies like Outplay, Wombo, Fi Money, and more. Along with it they also have 12K+ stars on GitHub and a thriving and extremely helpful community. I speak from first-hand experience, the community really helped me when I was getting this set up configured the first time around.
The rest of the article talks about what the setup would look like, and things that you need to be careful about. But if you’re more of an “enough talking, show me what it’s capable of” kinda person, here’s a link to a Github repo that allows you to get off the ground with a single command.
Self-Hosting SigNoz on AWS ECS (Backend Setup)
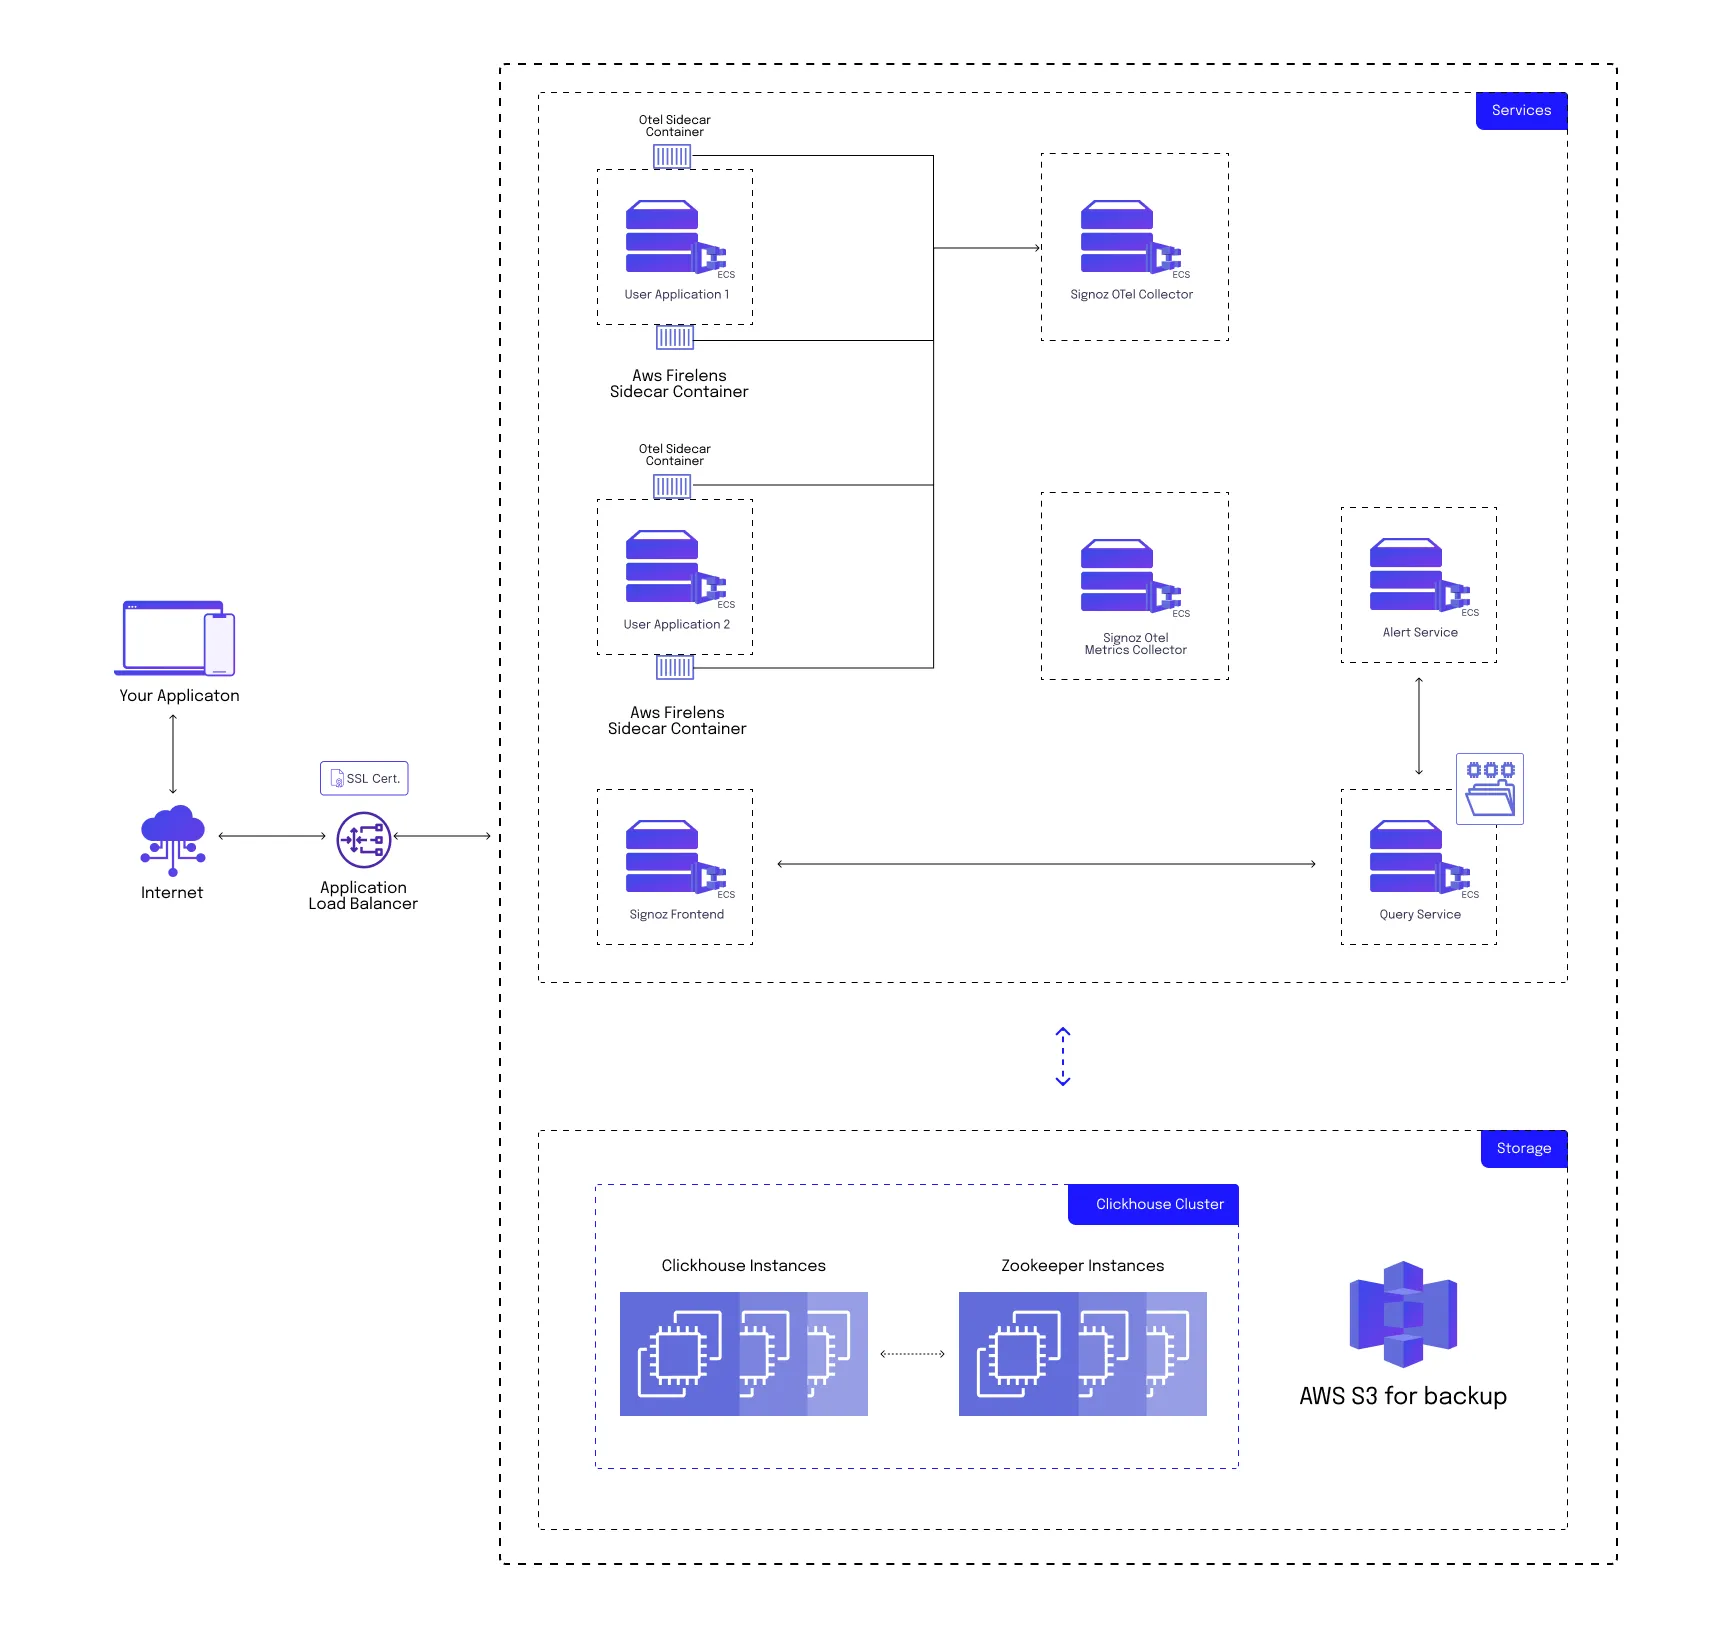
SigNoz architecture:

SigNoz has multiple internal services such as:
SigNoz Otel Collector
It is responsible for collecting data from various sources, including applications, infrastructure, and other monitoring tools. The Otel Collector can ingest data in various formats, such as OpenTelemetry, and from various systems such as Jaeger, and Zipkin. This data is then sent and stored in a Clickhouse database.
Query Service
It enables users to query and analyze the data collected by SigNoz. The Query Service is responsible for processing user queries and returning the relevant data in a structured format that can be visualized and analyzed.
Frontend Service
It is the user interface component of the SigNoz observability tool. It provides a web-based dashboard that allows users to visualize and interact with the data collected by SigNoz.
Alert Manager
It enables users to set up alerts based on specific criteria and receive notifications when those alerts are triggered.
In our AWS ECS setup, we’re going to have separate ECS services corresponding to each of the SigNoz internal services. It’ll look something like this:
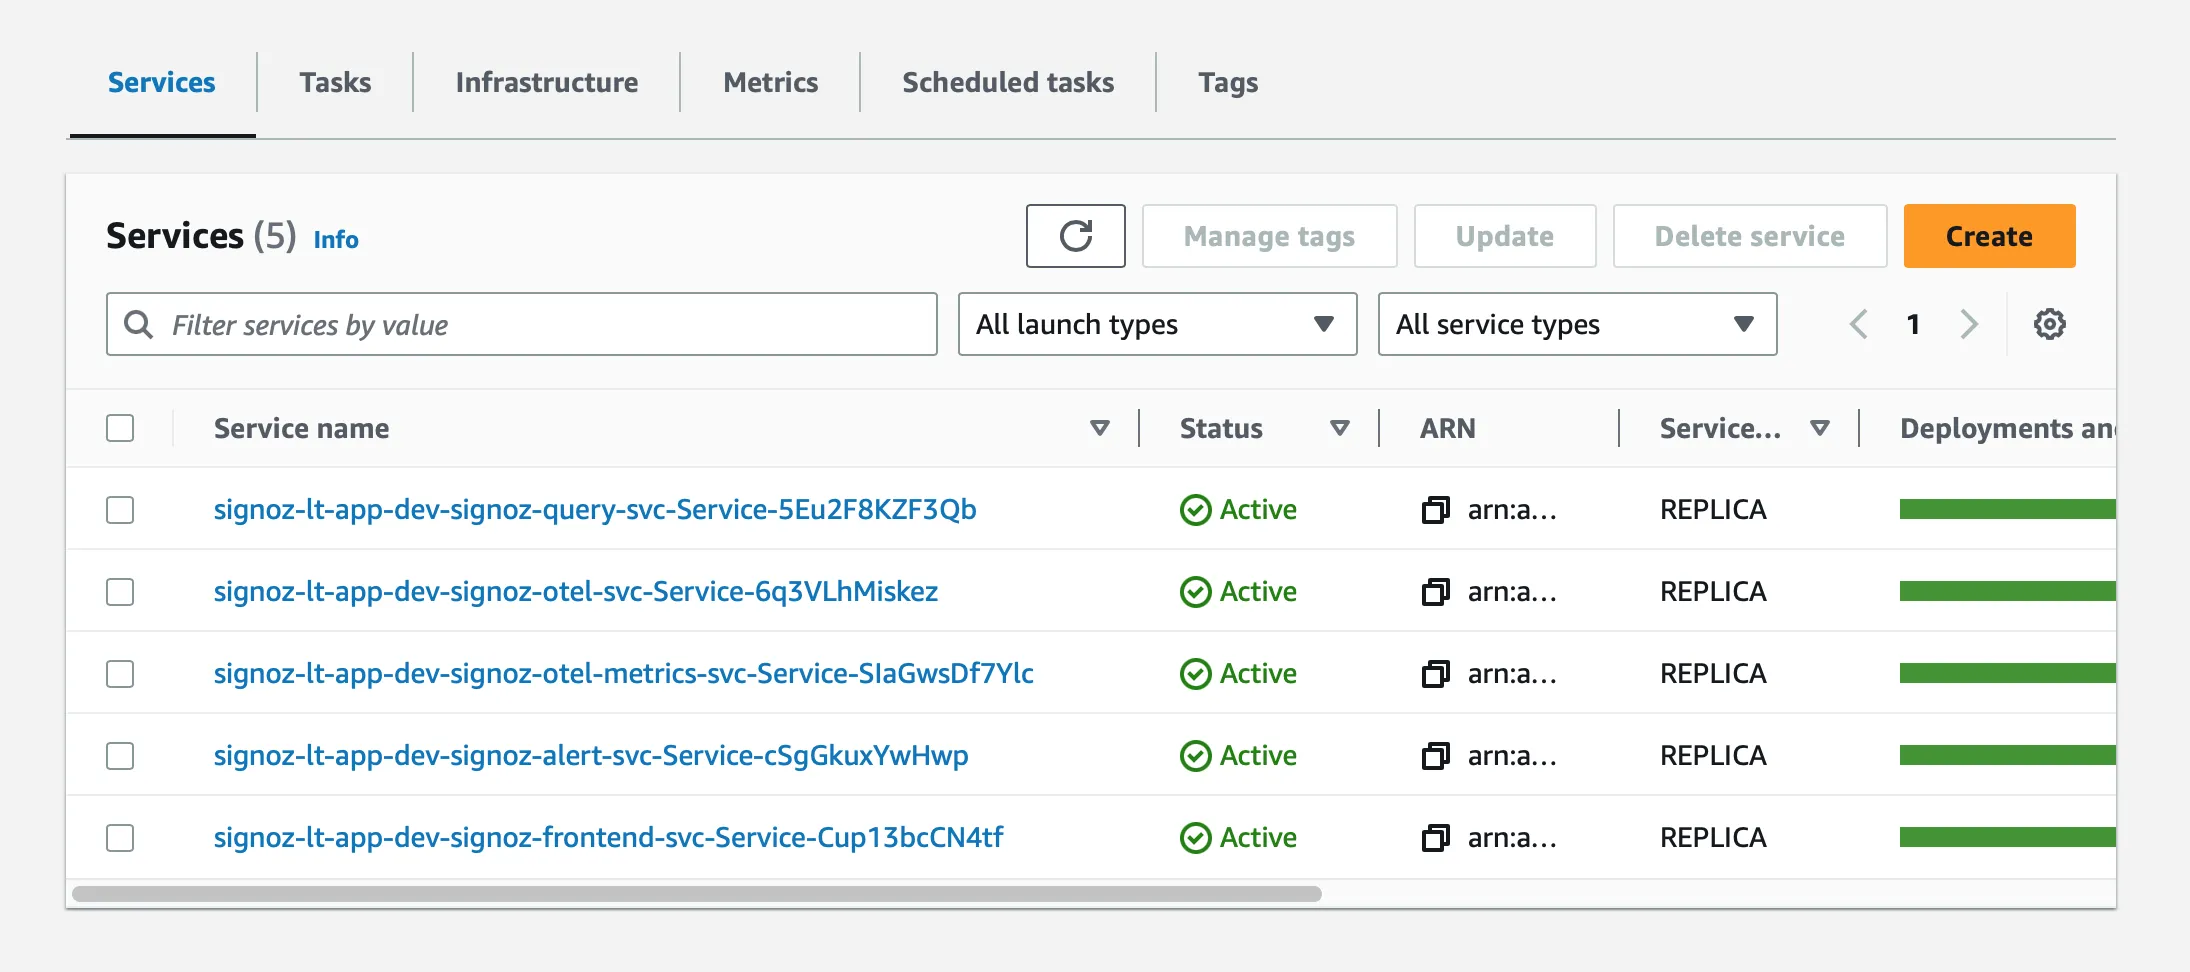
Here are all the 5 services that have been deployed on AWS ECS Fargate
We’ve also mounted an EFS to store metadata that the query service requires to authenticate users. This ensures data persistence across restarts and ensures your ECS service doesn’t lose state.
Additionally, you’re going to have to deploy otel & fluentbit sidecars along with each of your application containers for seamless and efficient tracing, logging, and metrics.
You can choose to use Clickhouse’s SAAS offering, host your own on-prem clickhouse servers, or even deploy your clickhouse cluster on EC2 instances. I chose to deploy the cluster on EC2 instances.
Hosting your own clickhouse cluster
The EC2 Clickhouse Architecture will look like this:
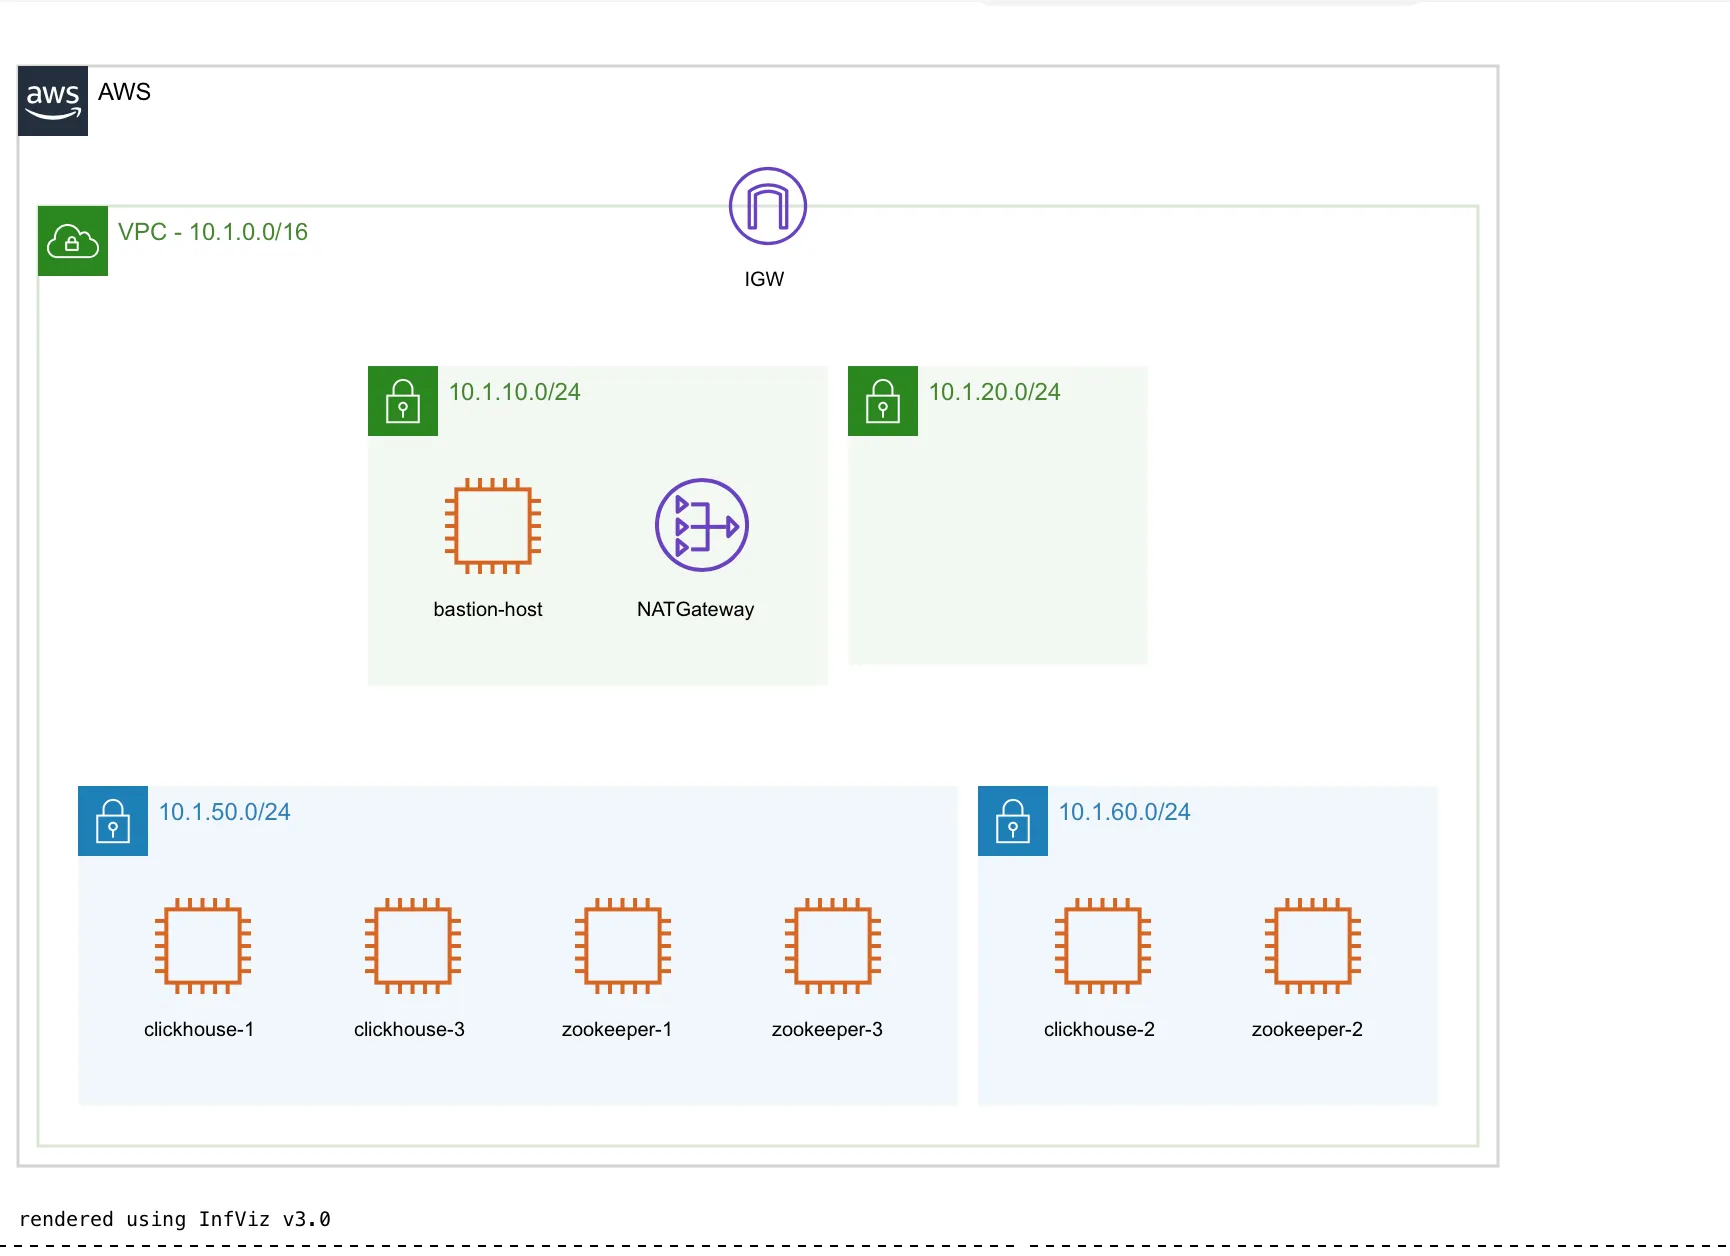
First, let's create a vpc, with a couple of private & public subnets inside it. We will host the entirety of our cluster inside the private subnet and host a single bastion host in our public subnet so we can ssh into our servers in the private subnet in case we need to troubleshoot any issues.
You can choose to deploy 1 or more clickhouse shards and zookeepers. We’ve created custom AMIs for configuring our zookeeper and clickhouse cluster that you can directly use. These AMIs are configured to back up clickhouse data to an AWS S3 bucket daily.
That’s it, it was that easy. The end setup would look like this:
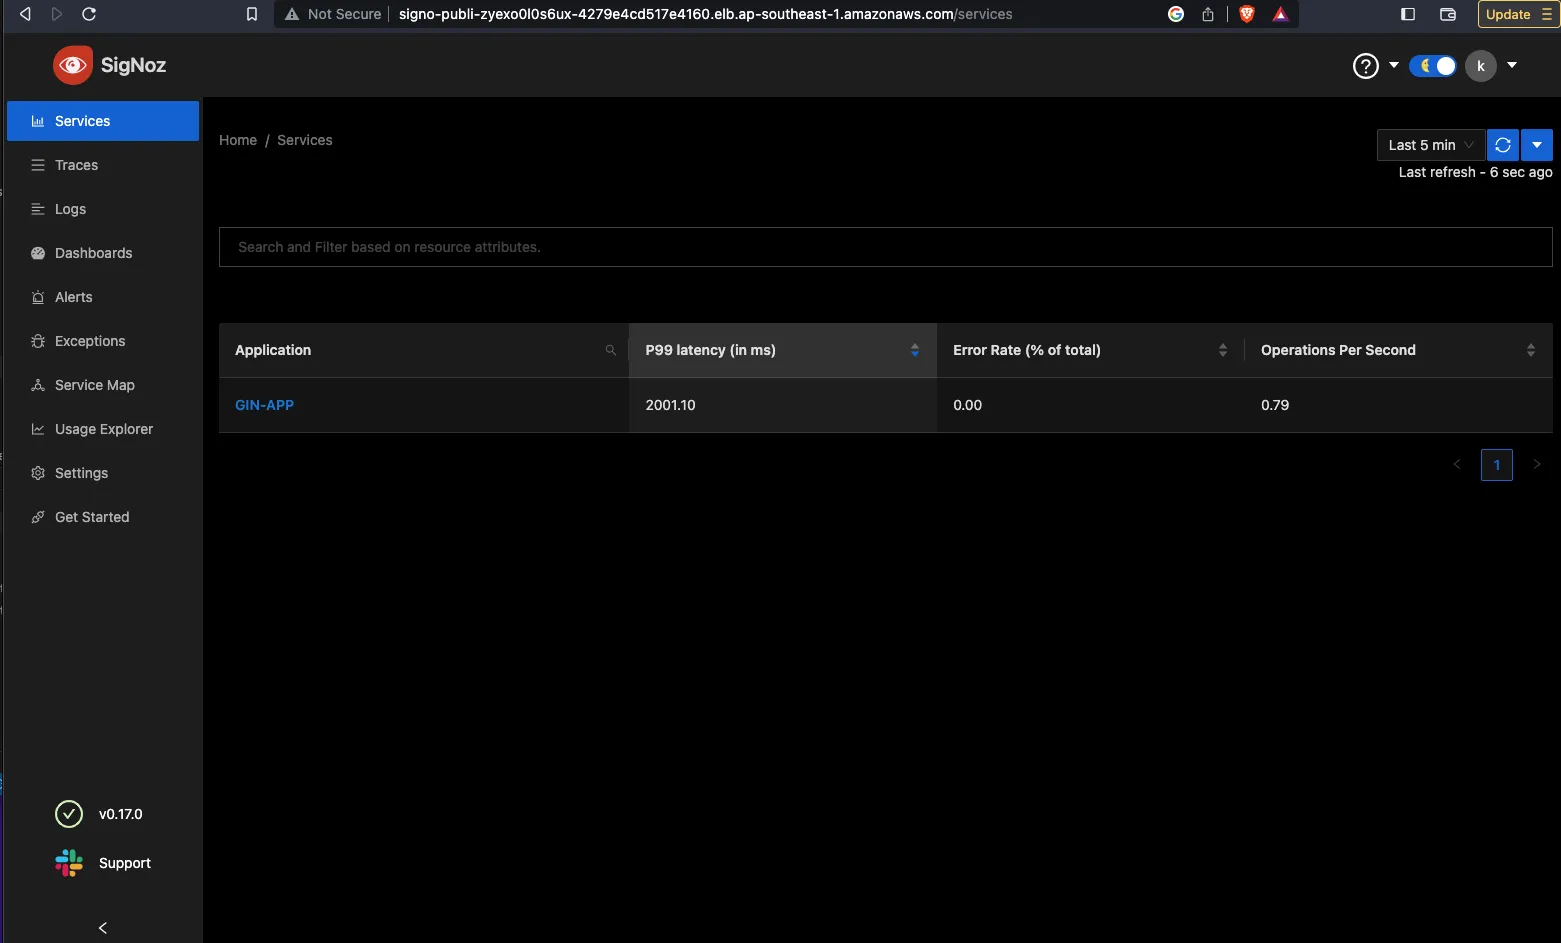
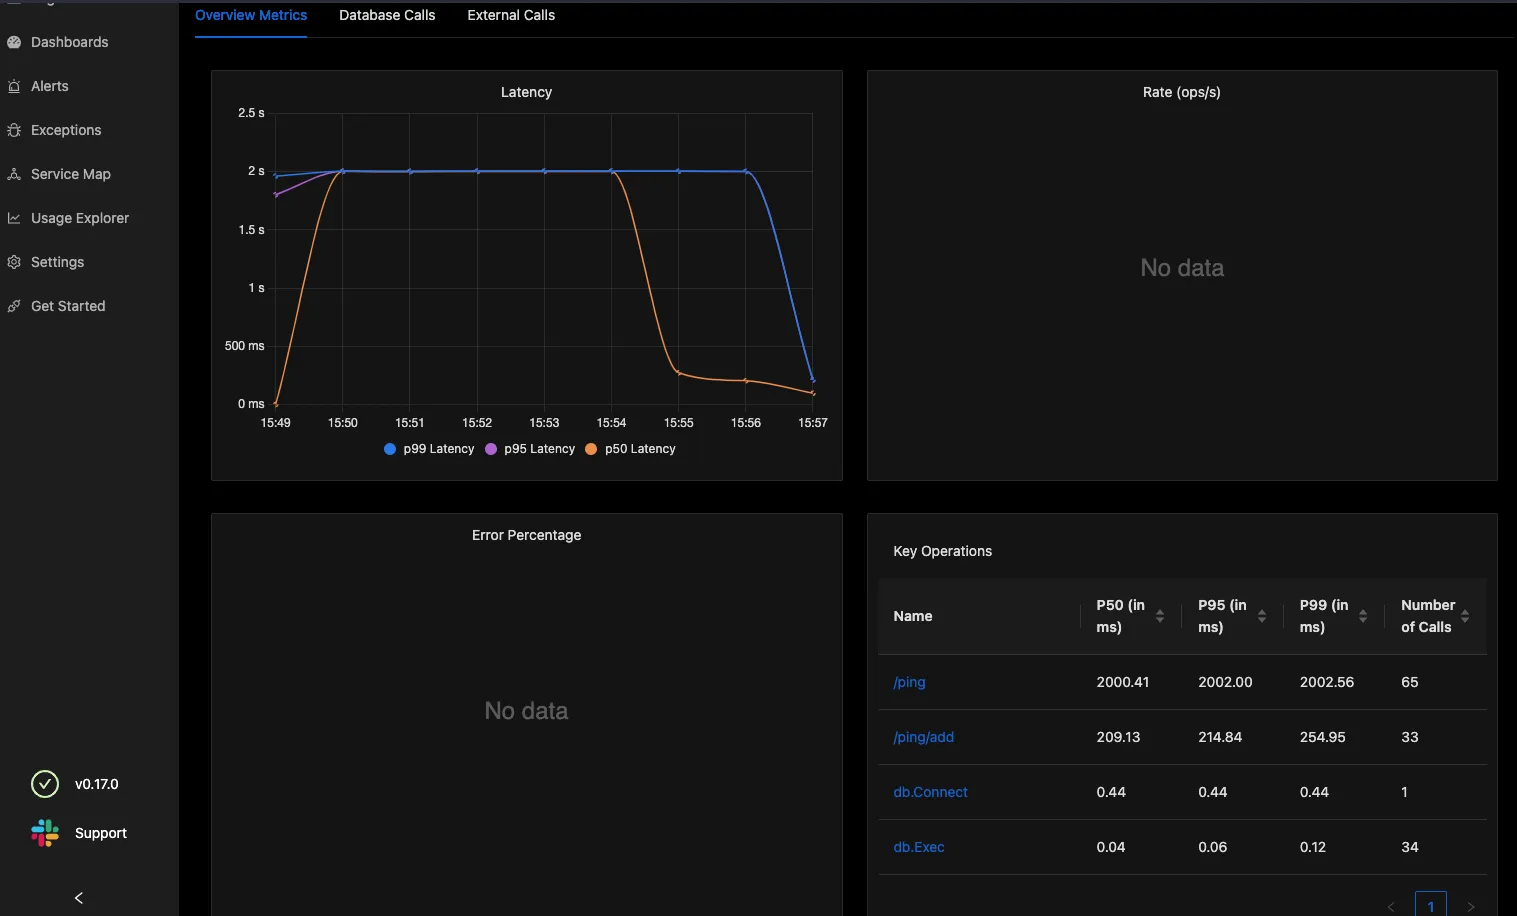
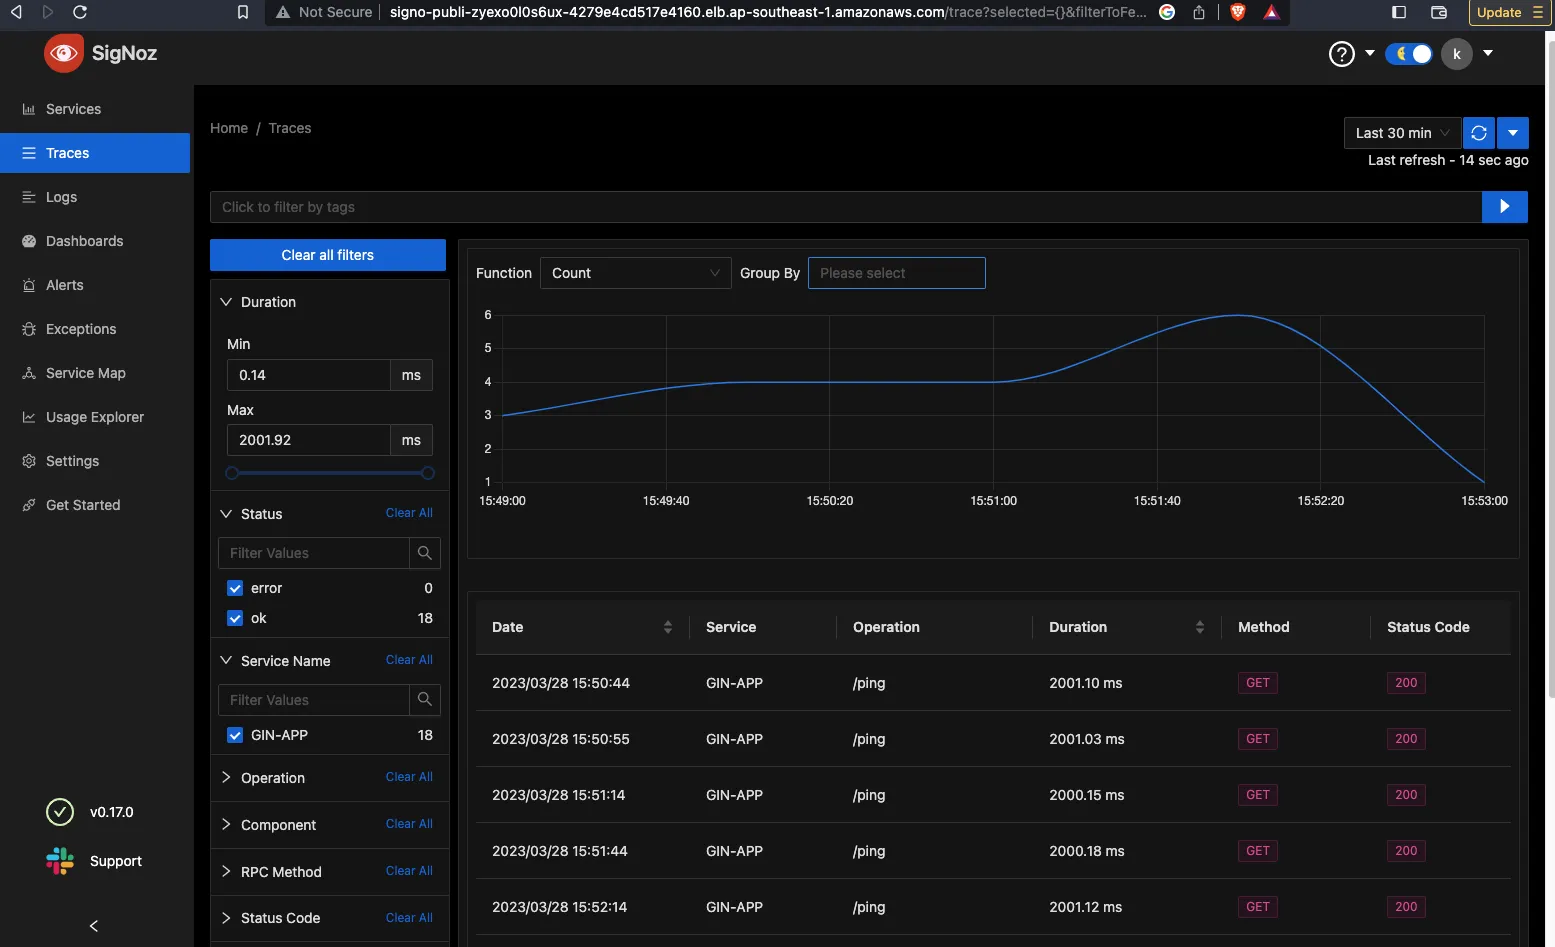
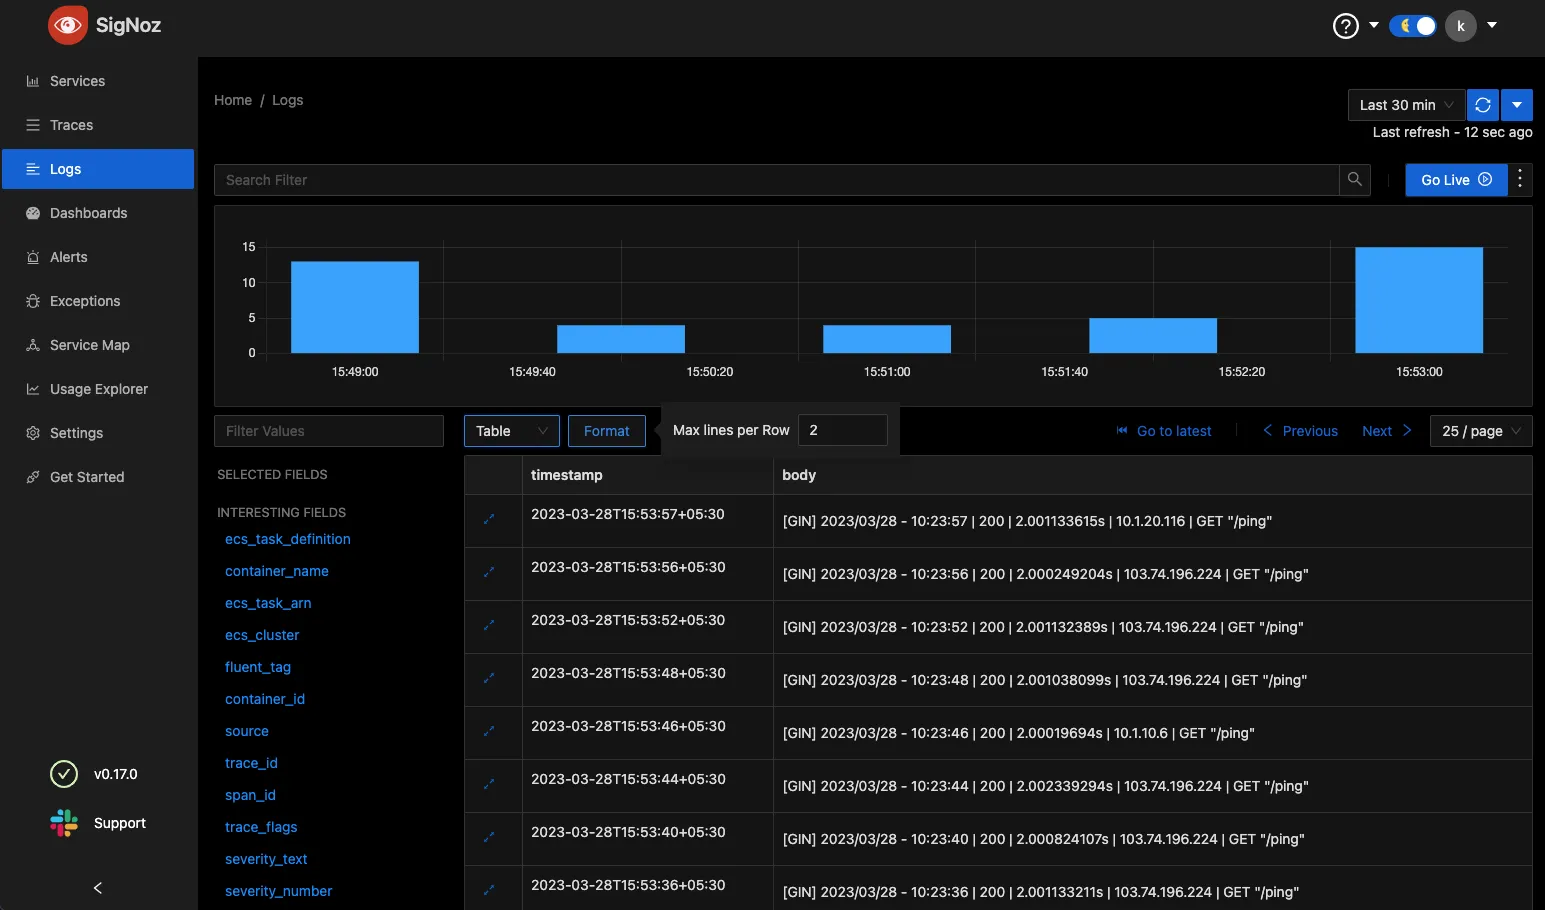
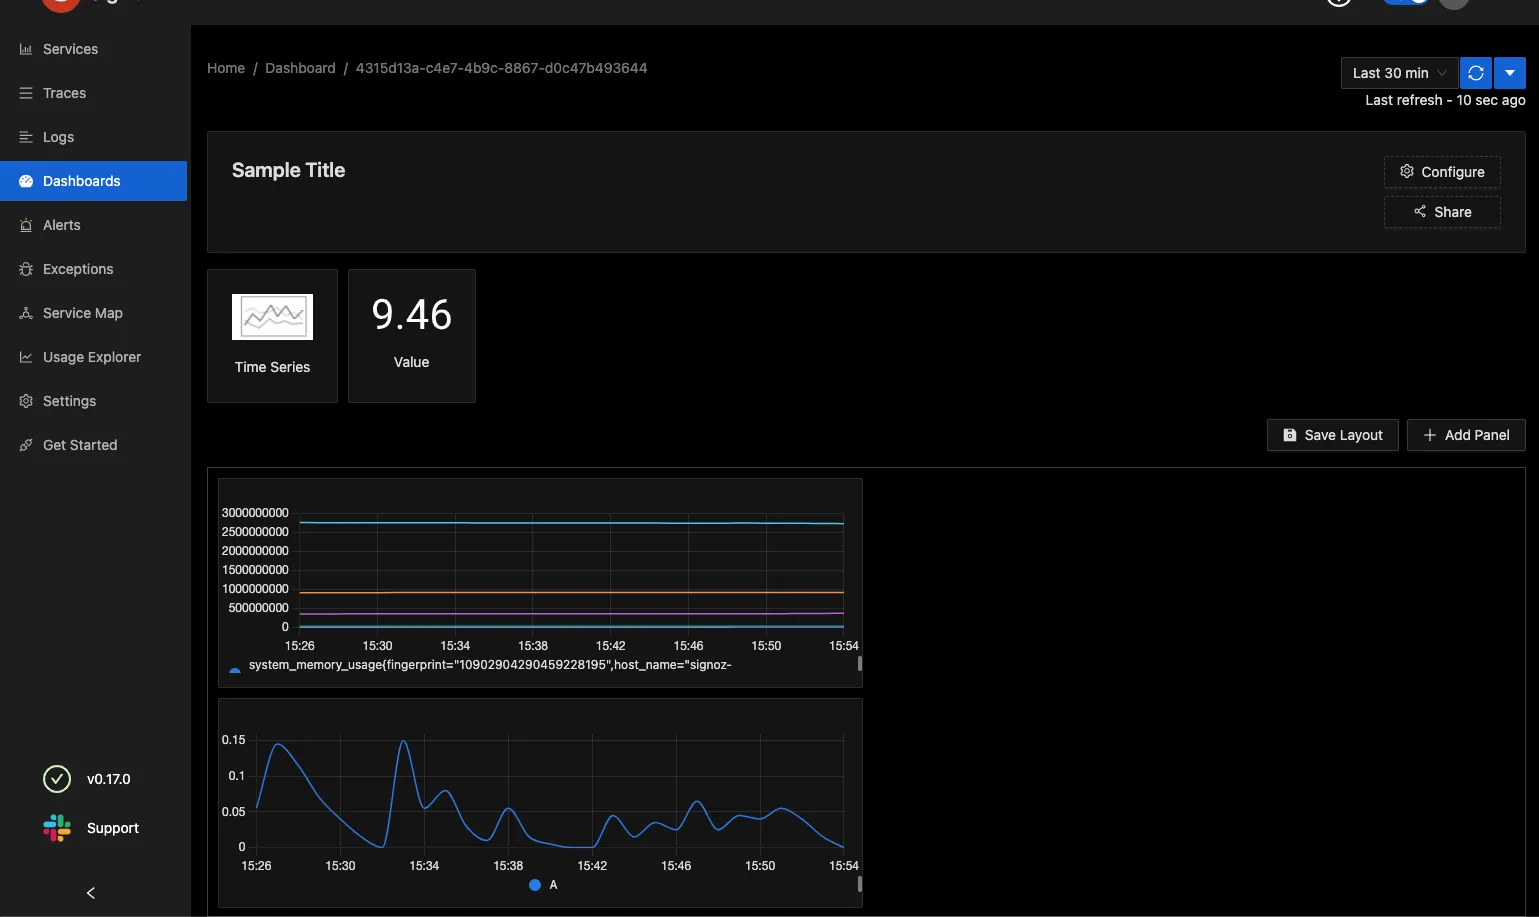
Here are some sample images of how the SigNoz setup looks for my workload
What's next?
At Wednesday we migrated a few of our production workloads out of XRay and CloudWatch. This setup largely consisted of AWS CloudWatch Logs, Metrics, and Alerts with slack integration using AWS Chatbot, along with X-Ray for distributed traces. We migrated workloads with no loss of functionality and without skipping a beat. If you’d like to get your hands on the JSON to set up some commonly used dashboards, here is the good stuff (wink wink)
Feel free to check out related reads on AWS and cloud observability:
- AWS Lambda monitoring
- OpenTelemetry vs CloudWatch
- AWS monitoring tools
- APM tools
- OpenTelemetry vs X-Ray
- Kubernetes monitoring best practices
- Cloud monitoring tools
Conclusion
In conclusion, hosting SigNoz on AWS ECS Fargate provides a powerful and scalable solution for monitoring and troubleshooting distributed systems. With features like distributed tracing, customizable alerting, and a powerful query language, SigNoz is a valuable tool for identifying and resolving performance issues in complex systems. SigNoz is currently working on adding tail-based sampling and an Anomaly detection framework. Overall, the upcoming developments for SigNoz promise to make it even more powerful and valuable, and we're excited to see what the future holds for this amazing open-source tool.
Here is a one-hit setup to create the entire infrastructure (yes yes, I mean it, the entire infrastructure!) with a single command. Go check out ECS SigNoz now!
Originally published on Wenesday.is.
