CI/CD Observability Powered by OpenTelemetry
Modern engineering teams spend a lot of time and resources in setting up monitoring of their production systems - tracking uptime, catching errors, and responding to incidents before customers ever notice. But what about the journey before code reaches production? For most teams, observing the CI/CD pipeline is either an afterthought or completely overlooked.
While we recognize its importance, do we truly understand how well our CI/CD process is functioning? Are we delivering value to users as quickly and reliably as possible?
This is where CI/CD observability steps in. By shining a light on your entire software development lifecycle, you gain the necessary insights needed to optimize not just your code, but your entire development process. CI/CD observability empowers teams to move beyond gut feelings and anecdotal evidence, making data-driven decisions that accelerate delivery and improve development processes.
Why CI/CD Observability Matters
Your CI/CD pipeline is the heartbeat of your software organization. Every feature, bug fix, and improvement flows through it. Yet, without observability, you’re left guessing about critical questions such as:
- How often do our changes introduce production issues?
- How long does it take for a change to reach production?
- How quickly are pull requests reviewed and merged?
- Where are the slowdowns in our workflow?
- Which pipelines are reliable, and which are flaky?
- Who are our most active contributors, and how are they performing?
Without answers, bottlenecks go unnoticed and are addressed reactively, pipeline failures become recurring headaches, and engineering teams can’t measure the impact of their efforts. In short, you can’t improve what you can’t see.
Implementing CI/CD observability with OpenTelemetry & SigNoz
With the introduction of CI/CD semantic conventions in OpenTelemetry (OTel), telemetry collection from CI/CD systems is now standardized. The githubreceiver component in the OTel Contrib repository makes it straightforward to ingest GitHub Actions telemetry. Combined with SigNoz, this enables teams to visualize and analyze CI/CD telemetry within minutes.
Deploy SigNoz
Set up SigNoz by following the installation guide for your preferred environment (cloud or self-hosted).
Configure the OpenTelemetry Collector
- Then configure the OpenTelemetry Collector with the
githubreceivercomponent. - Refer to the CI/CD GitHub Metrics documentation for detailed, environment-specific setup instructions.
- Then configure the OpenTelemetry Collector with the
Explore Your CI/CD Metrics in SigNoz
Once configured, use SigNoz dashboards to monitor builds, deployments, and pipeline health in real time.
Analyzing SigNoz/charts repository
Let’s take a look at our charts repository and try to gain some insight into what is happening.
1. Repository Health

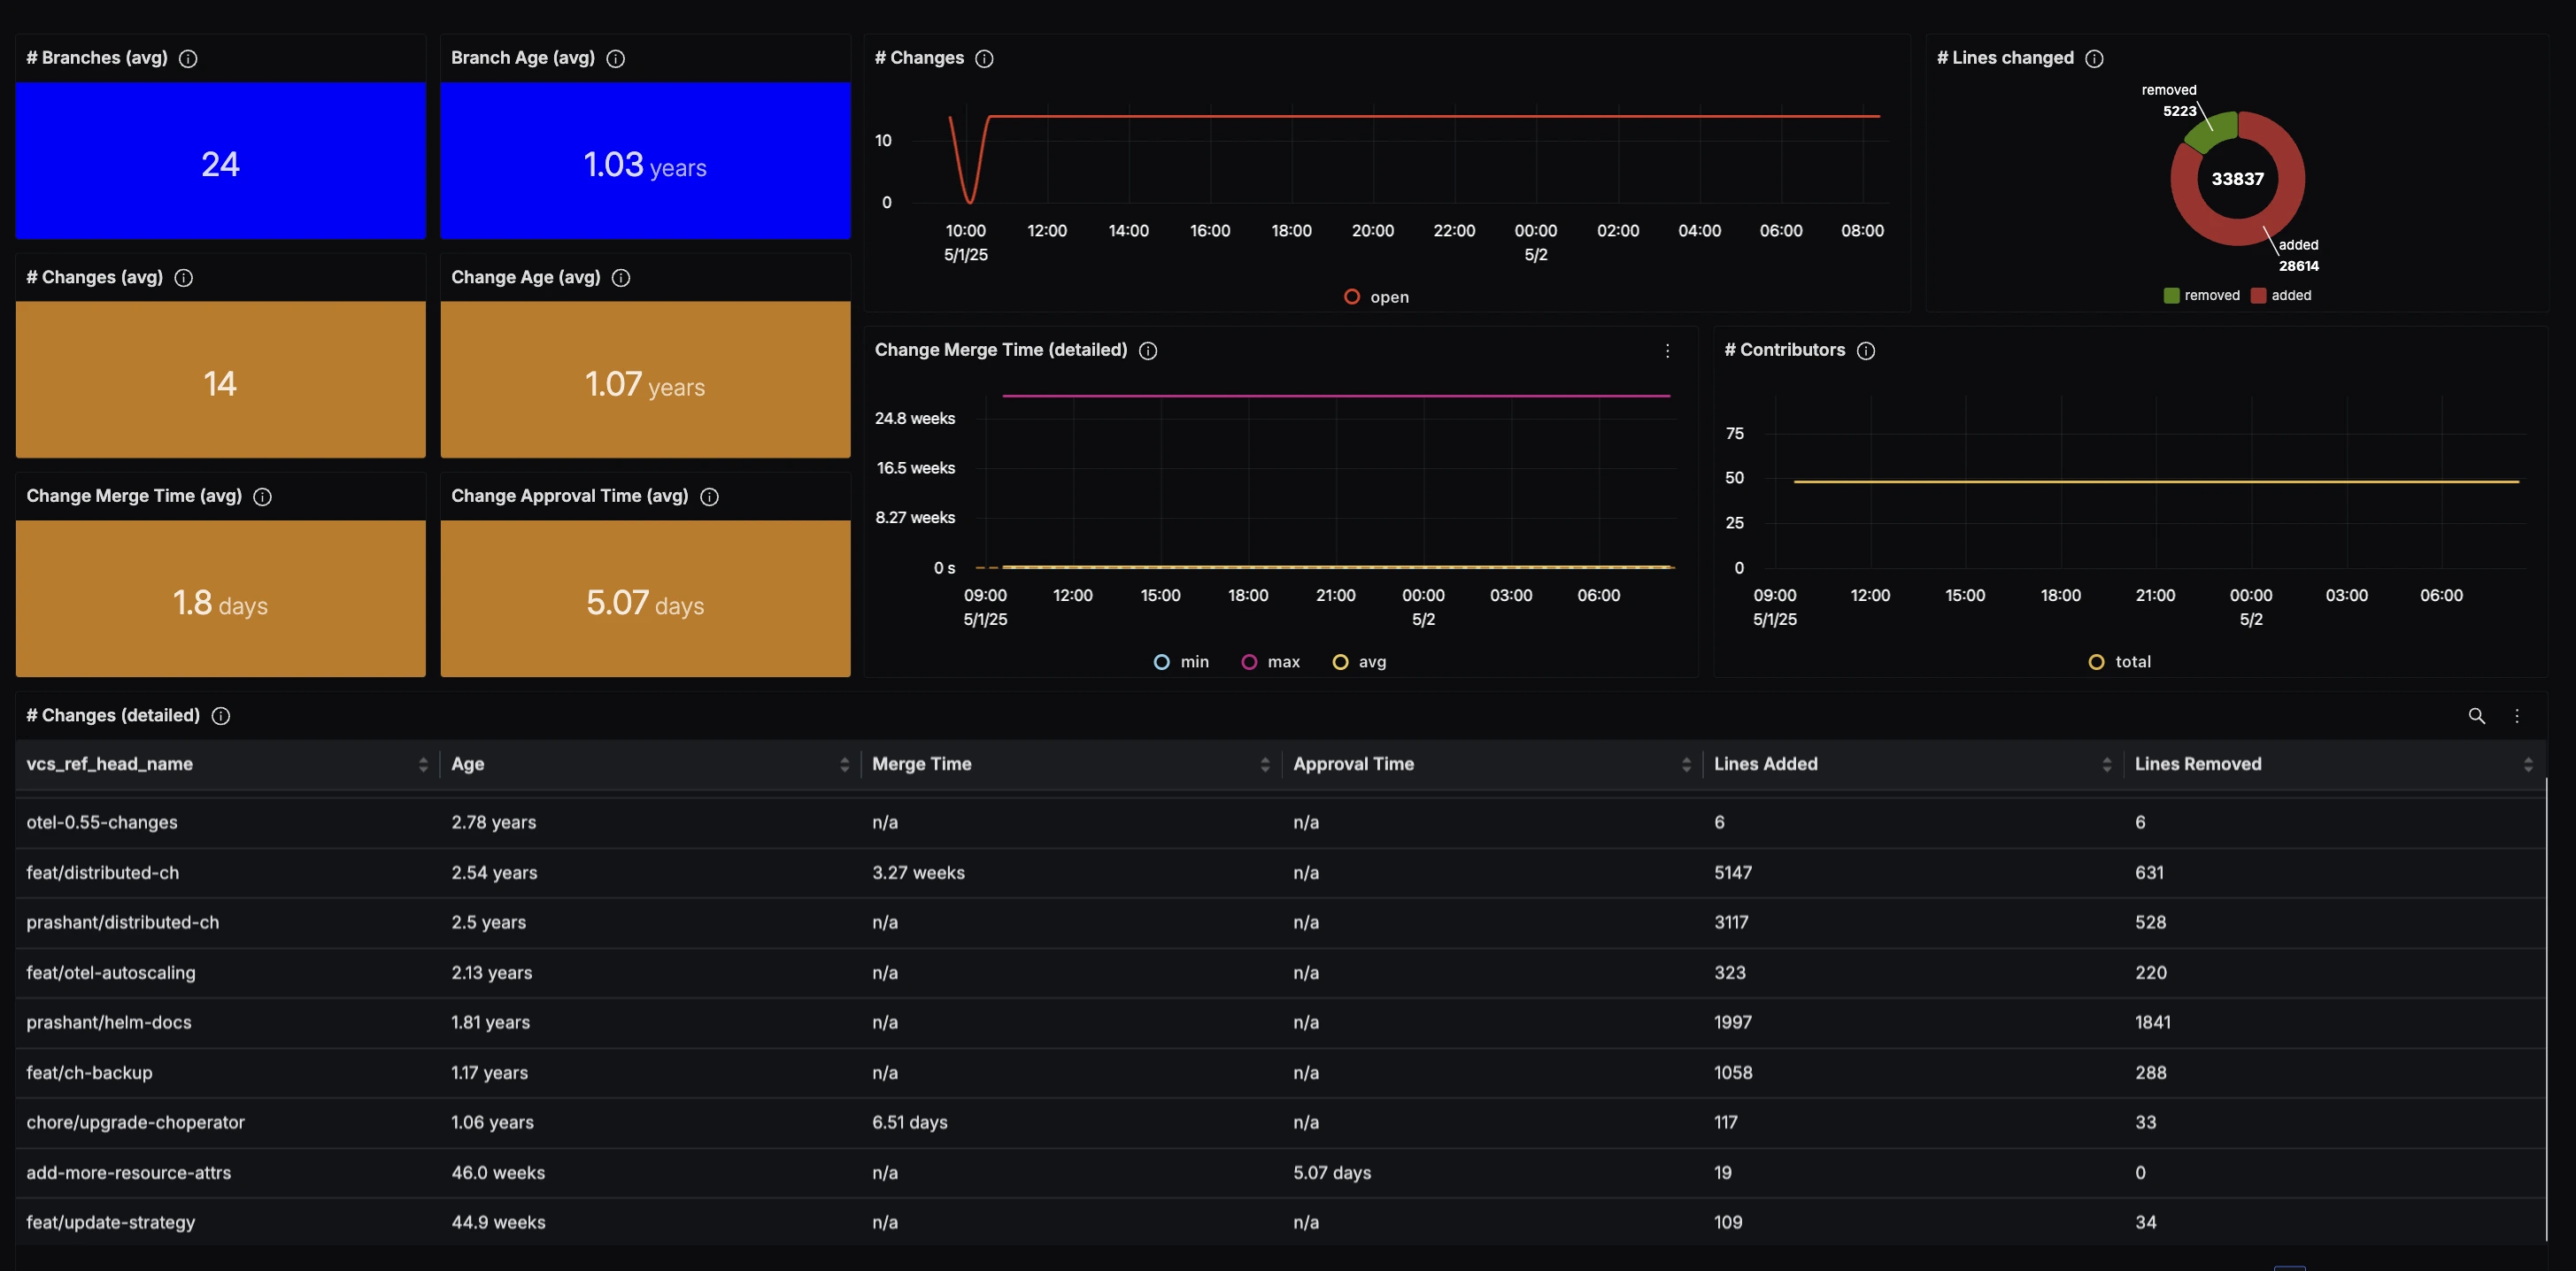
The average time a Pull Request remains open is a staggering 1.07 years. This immediately highlights that many PRs are being ignored. For PRs that do get reviewed, the average merge time is just 1.8 days indicating that the team is efficient once they engage with a PR.
The average approval time of 5.07 days (longer than the merge time) revealed that some approved PRs weren't being merged promptly. A deeper look reveals that the branch add-more-resource-attrs was the pull request that was approved but not merged.
These insights led to clear action items:
- Create an automated system to flag approved PRs awaiting merge
- Establish SLAs for PR review timeframes
2. DORA Metrics
DORA metrics are a set of industry-standard measurements that help teams understand and improve the speed and reliability of their software delivery process. The four key DORA metrics are:
Deployment Frequency
To measure how often you deploy to production, SigNoz lets you filter your CI/CD data to focus on production deployment pipelines (such as “release charts”). By counting the number of production deployments over a chosen time period, you get a direct view of your team’s release cadence.
Lead Time for Changes
It also calculates lead time for changes by tracking the journey of a code change from when it’s merged (or a pull request is closed) to when it’s deployed in production. This includes both the time the code spends waiting after merge and the time taken by your deployment pipeline. For example, if PRs are typically merged in 1.8 days and your pipeline takes 13 minutes to deploy, your lead time for changes is about 2 days.
Change Failure Rate
Change failure rate is determined by identifying deployments that require a hotfix or rollback. In SigNoz, this is tracked by checking if a deployment is quickly followed by a corrective action-such as a hotfix merged soon after a release. If no hotfixes are needed after deployments, your change failure rate is 0%. This metric helps you monitor release stability.
Mean Time to Recovery (MTTR)
MTTR is measured by calculating the time between a failed deployment and the next successful deployment that resolves the issue. For example, if a deployment fails and a hotfix is deployed 13 minutes later, your MTTR is 13 minutes. This shows how quickly your team can restore service after an incident.
3. Pipeline Health and Flakiness Detection
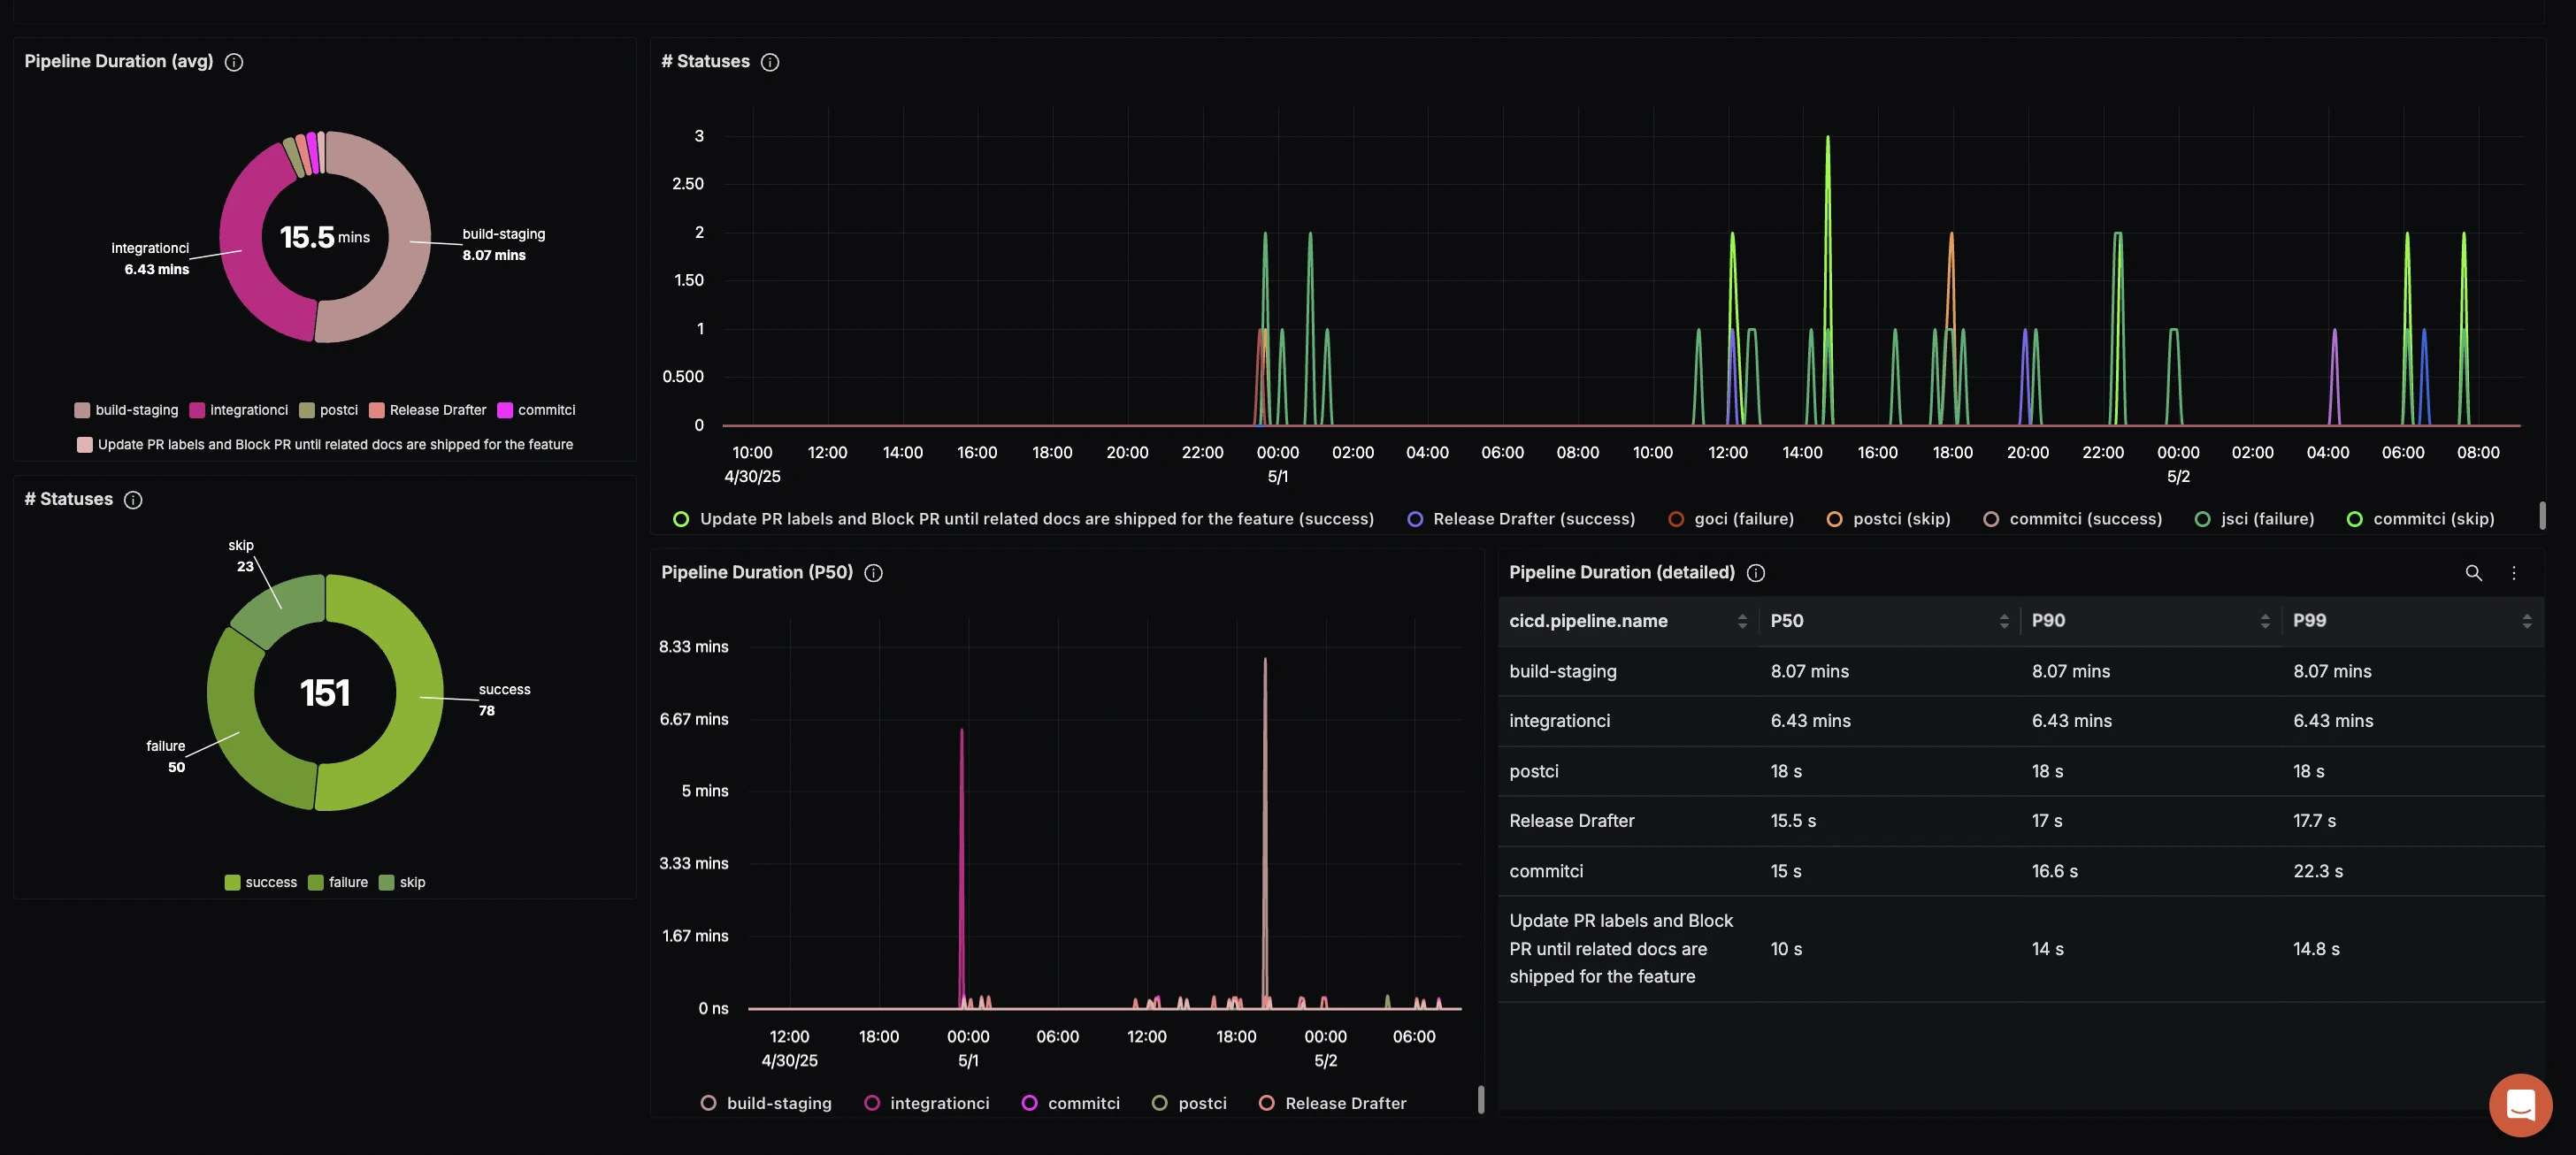
High Failure Rate Alert: 50 of 151 pipeline runs failed, indicating potential issues with test reliability or configuration.

Visualization of pipeline failures and alerts Performance Hotspots: The
build-stagingpipeline consistently took around 8 minutes, while theintegrationcipipeline required 6 minutes—both potential targets for optimization.Flakiness Identification: We detected a pattern of failures immediately followed by successes in the
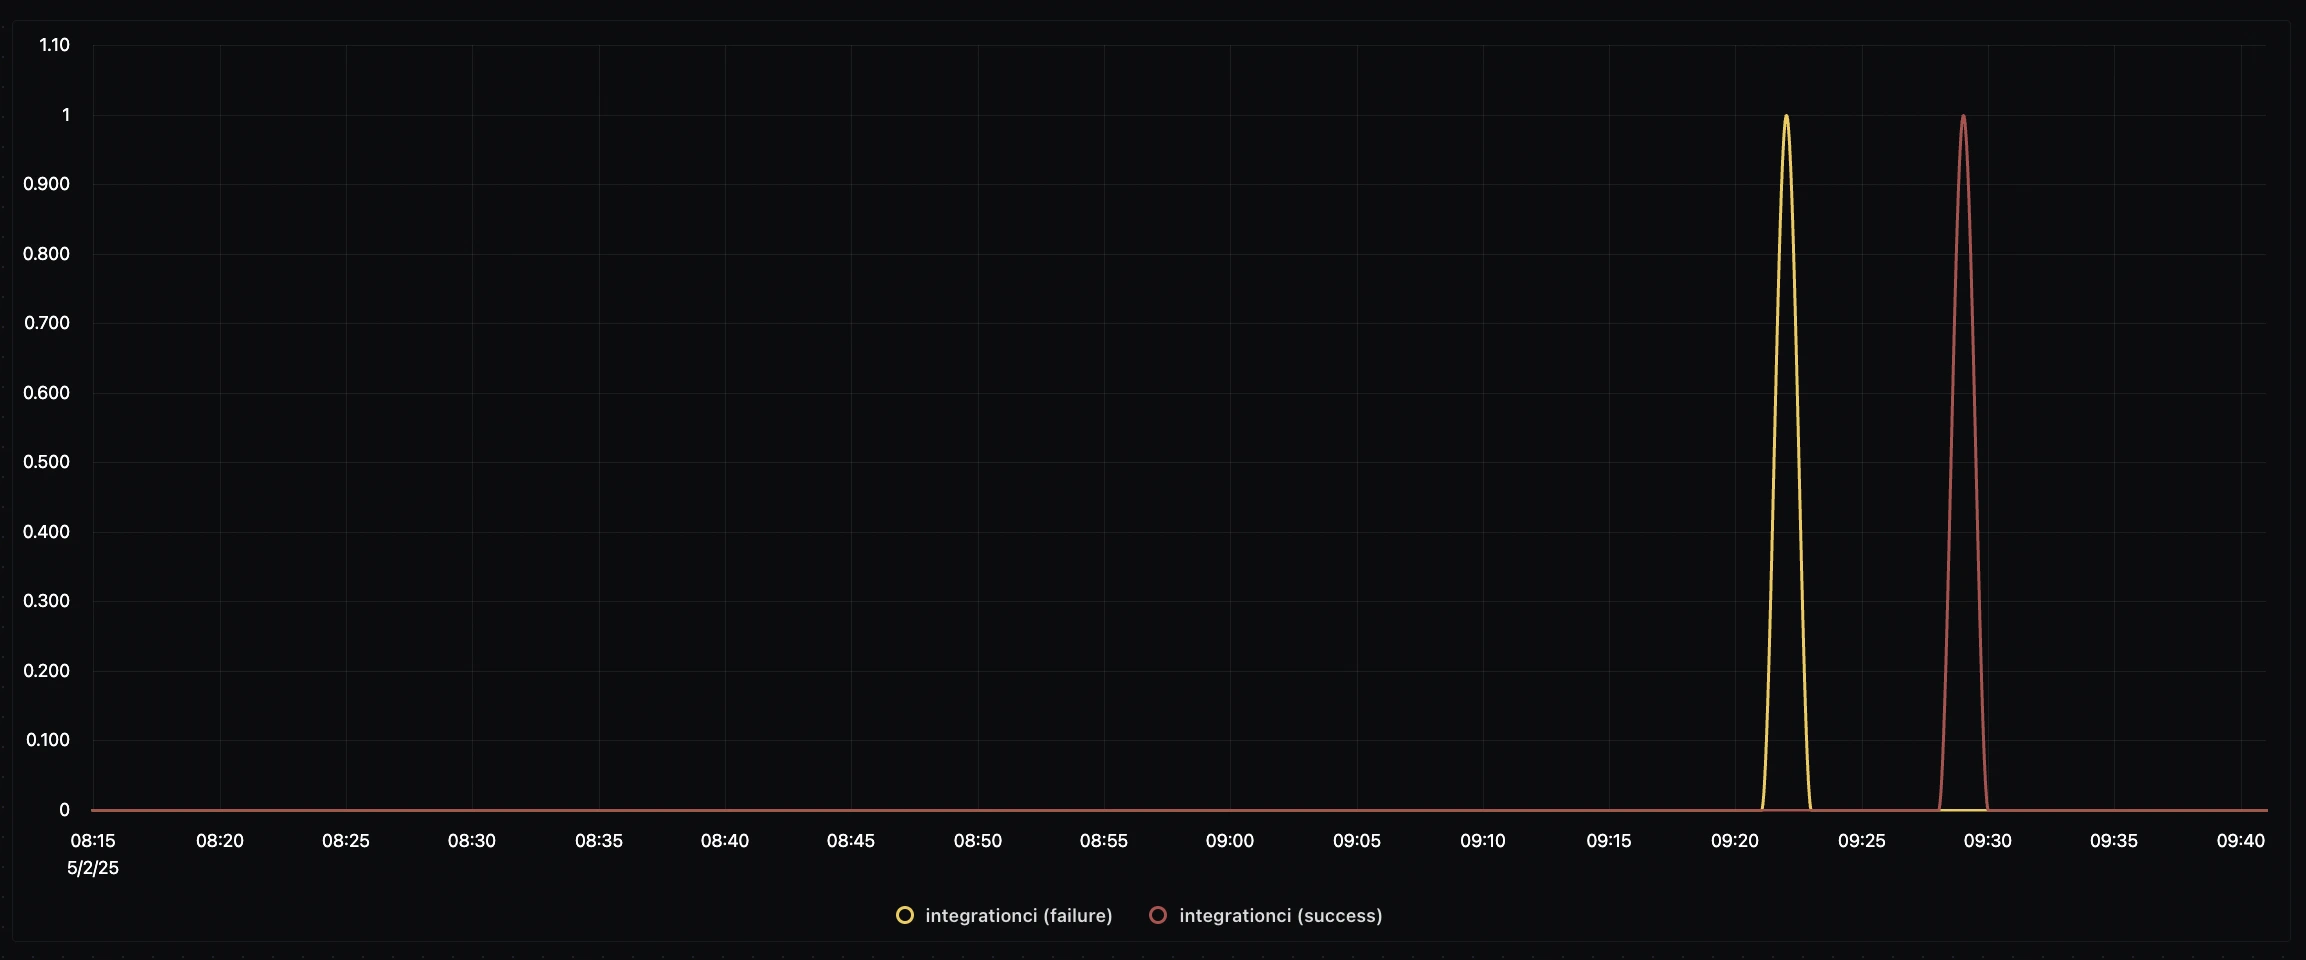
integrationcipipeline, a classic indicator of test flakiness that needed addressing.
Example of Flakiness Identification
The Future of CI/CD is Observable
As software delivery continues to accelerate, teams can no longer afford to treat CI/CD pipelines as mysterious black boxes. The combination of OpenTelemetry's standardized telemetry collection and SigNoz's powerful visualization capabilities provides a comprehensive solution to this challenge.
Implementing this observability stack grants unprecedented visibility into delivery pipelines and lays the groundwork for continuous improvement. 
Join the SigNoz community on Slack or GitHub, share your experience, and help us shape the future of observability. Your feedback directly drives what we build next.
Launch Week 4.0
Check out all updates of Launch Week 4.0.
