Bringing Observability to Claude Code: OpenTelemetry in Action
AI coding assistants like Claude Code are becoming core parts of modern development workflows. But as with any powerful tool, the question quickly arises: how do we measure and monitor its usage? Without proper visibility, it's hard to understand adoption, performance, and the real value Claude brings to engineering teams. For leaders and platform engineers, that lack of observability can mean flying blind when it comes to understanding ROI, productivity gains, or system reliability.
That's where observability comes in. By leveraging OpenTelemetry and SigNoz, we built an observability pipeline that makes Claude Code usage measurable and actionable. From request volumes to latency metrics, everything flows into SigNoz dashboards, giving us clarity on how Claude is shaping developer workflows and helping us spot issues before they snowball.
In this post, we'll walk through how we connected Claude Code's monitoring hooks with OpenTelemetry and exported everything into SigNoz. The result: a streamlined, data-driven way to shine a light on how developers actually interact with Claude Code and to help teams make smarter, evidence-backed decisions about scaling AI-assisted coding.
Monitor Claude Code token usage, costs, and performance with OpenTelemetry and SigNoz — pre-built dashboards, no custom instrumentation needed.
Get Started - Free
Why Monitor Claude Code?
Claude Code is powerful, but like any tool that slips seamlessly into a developer's workflow, it can quickly turn into a black box. You know people are using it, but how much, how effectively, and at what cost? Without telemetry, you're left guessing whether Claude is driving real impact or just lurking quietly in the background.
That's why monitoring matters. With the right observability pipeline, Claude Code stops being an invisible assistant and starts showing its true footprint in your engineering ecosystem. By tracking key logs and metrics in SigNoz dashboards, we can answer questions that directly tie usage to value:
- Total token usage & cost → How much are we spending, and where are those tokens going?
- Sessions, conversations & requests per user → Who's using Claude regularly, and what does “active usage” really look like?
- Quota visibility → How close are we to hitting limits (like the 5-hour quota), and do we need to adjust capacity?
- Performance trends → From command duration over time to request success rate, are developers getting fast, reliable responses?
- Behavior insights → Which terminals are people using (VS Code, Apple Terminal, etc.), how are decisions distributed (accept vs. reject), and what tool types are most popular?
- Model distribution → Which Claude variants (Sonnet, Opus, etc.) are driving the most activity?
Together, this info transforms Claude Code from “just another AI tool” into something measurable, transparent, and optimizable. Monitoring gives you the clarity to not only justify adoption but also to fine-tune how Claude fits into developer workflows.
And that's where the observability stack comes in. OpenTelemetry and SigNoz give us the tools to capture this data, export them cleanly, and turn raw usage into actionable insights. Let's take a closer look at how they fit into the picture.
OpenTelemetry and SigNoz: The Observability Power Duo
What is OpenTelemetry?
OpenTelemetry (OTel) is an open-source observability framework that makes it easy to collect telemetry data—traces, metrics, and logs—from across your stack. It's a CNCF project, widely adopted, and built with flexibility in mind. The key advantage? You instrument once, and your telemetry can flow to any backend you choose. No vendor lock-in and no tangled integrations.
For Claude Code, this means we can capture usage and performance signals at a very granular level. Every request, every session, every token consumed can be traced and exported via OpenTelemetry. Instead of Claude Code being a black box, you now have standardized hooks to surface: how long requests take, how often they succeed, and which models or terminals are driving activity.
What is SigNoz?
SigNoz is an all-in-one observability platform that pairs perfectly with OpenTelemetry. Think of it as the dashboard and analysis layer. The place where all your Claude Code telemetry comes to life. With SigNoz, you can visualize logs and metrics in real time, slice usage data by user or model, and set alerts when things go wrong.
In our case, that means building dashboards that track:
- Token usage & costs over time
- Requests per user and per terminal type
- Command durations and success rates
- Model distributions (e.g., Sonnet vs Opus)
- User decisions (accept vs reject)
By combining OpenTelemetry's standardized data collection with SigNoz's rich visualization and alerting, you get a complete observability stack for Claude Code. The result is not just raw logs and metrics. It's a full picture of Claude Code in action, right where you need it.
Monitoring Claude Code
As you'll see below, Claude Code exports its telemetry through OTLP, the standard protocol for OpenTelemetry, so it lands in any OTLP backend like SigNoz alongside the rest of your observability data with no proprietary agent required. This is part of a broader 2026 pattern of developer and AI tools emitting OpenTelemetry directly.
Where telemetry covers model interactions, the GenAI semantic conventions (the gen_ai.* attributes for model, token usage, and tool calls) standardize how they are recorded, which you can see in action in our guide to observing LLM applications with OpenTelemetry.
Check out the Claude Code monitoring guide for detailed instructions on setting up OpenTelemetry instrumentation.
Option 1 (VSCode)
Step 1: Launch VSCode with telemetry enabled
CLAUDE_CODE_ENABLE_TELEMETRY=1 \
OTEL_METRICS_EXPORTER=otlp \
OTEL_LOGS_EXPORTER=otlp \
OTEL_EXPORTER_OTLP_PROTOCOL=grpc \
OTEL_EXPORTER_OTLP_ENDPOINT="https://ingest.<region>.signoz.cloud:443" \
OTEL_EXPORTER_OTLP_HEADERS="signoz-ingestion-key=<your-ingestion-key>" \
OTEL_METRIC_EXPORT_INTERVAL=10000 \
OTEL_LOGS_EXPORT_INTERVAL=5000 \
code .
- Set the
<region>to match your SigNoz Cloud region - Replace
<your-ingestion-key>with your SigNoz ingestion key
This will open VSCode with the required environment variables already configured. From here, any Claude Code activity will automatically generate telemetry and export logs to your SigNoz Cloud instance.
For convenience, you can also clone our bash script, update it with your SigNoz endpoint and ingestion key, and run it directly.
Option 2 (Terminal)
Step 1: Launch Claude Code with telemetry enabled
CLAUDE_CODE_ENABLE_TELEMETRY=1 \
OTEL_METRICS_EXPORTER=otlp \
OTEL_LOGS_EXPORTER=otlp \
OTEL_EXPORTER_OTLP_PROTOCOL=grpc \
OTEL_EXPORTER_OTLP_ENDPOINT="https://ingest.<region>.signoz.cloud:443" \
OTEL_EXPORTER_OTLP_HEADERS="signoz-ingestion-key=<your-ingestion-key>" \
OTEL_METRIC_EXPORT_INTERVAL=10000 \
OTEL_LOGS_EXPORT_INTERVAL=5000 \
claude
- Set the
<region>to match your SigNoz Cloud region - Replace
<your-ingestion-key>with your SigNoz ingestion key
This will launch Claude Code with telemetry enabled. Any Claude Code activity in the terminal session will automatically generate and export logs and metrics to your SigNoz Cloud instance.
For convenience, you can also clone our bash script, update it with your SigNoz endpoint and ingestion key, and run it directly.
Administrator Configuration
Administrators can configure OpenTelemetry settings for all users through the managed settings file. This allows for centralized control of telemetry settings across an organization. See the settings precedence for more information about how settings are applied.
The managed settings file is located at:
- macOS:
/Library/Application Support/ClaudeCode/managed-settings.json - Linux and WSL:
/etc/claude-code/managed-settings.json - Windows:
C:\ProgramData\ClaudeCode\managed-settings.json
Example managed settings configuration:
{
  "env": {
    "CLAUDE_CODE_ENABLE_TELEMETRY": "1",
    "OTEL_METRICS_EXPORTER": "otlp",
    "OTEL_LOGS_EXPORTER": "otlp",
    "OTEL_EXPORTER_OTLP_PROTOCOL": "grpc",
    "OTEL_EXPORTER_OTLP_ENDPOINT": "http://collector.company.com:4317",
    "OTEL_EXPORTER_OTLP_HEADERS": "Authorization=Bearer company-token"
  }
}
Managed settings can be distributed via MDM (Mobile Device Management) or other device management solutions. Environment variables defined in the managed settings file have high precedence and cannot be overridden by users.
Example Configurations
# Console debugging (1-second intervals)
export CLAUDE_CODE_ENABLE_TELEMETRY=1
export OTEL_METRICS_EXPORTER=console
export OTEL_METRIC_EXPORT_INTERVAL=1000

# OTLP/gRPC
export CLAUDE_CODE_ENABLE_TELEMETRY=1
export OTEL_METRICS_EXPORTER=otlp
export OTEL_EXPORTER_OTLP_PROTOCOL=grpc
export OTEL_EXPORTER_OTLP_ENDPOINT=http://localhost:4317

# Prometheus
export CLAUDE_CODE_ENABLE_TELEMETRY=1
export OTEL_METRICS_EXPORTER=prometheus

# Multiple exporters
export CLAUDE_CODE_ENABLE_TELEMETRY=1
export OTEL_METRICS_EXPORTER=console,otlp
export OTEL_EXPORTER_OTLP_PROTOCOL=http/json

# Different endpoints/backends for metrics and logs
export CLAUDE_CODE_ENABLE_TELEMETRY=1
export OTEL_METRICS_EXPORTER=otlp
export OTEL_LOGS_EXPORTER=otlp
export OTEL_EXPORTER_OTLP_METRICS_PROTOCOL=http/protobuf
export OTEL_EXPORTER_OTLP_METRICS_ENDPOINT=http://metrics.company.com:4318
export OTEL_EXPORTER_OTLP_LOGS_PROTOCOL=grpc
export OTEL_EXPORTER_OTLP_LOGS_ENDPOINT=http://logs.company.com:4317

# Metrics only (no events/logs)
export CLAUDE_CODE_ENABLE_TELEMETRY=1
export OTEL_METRICS_EXPORTER=otlp
export OTEL_EXPORTER_OTLP_PROTOCOL=grpc
export OTEL_EXPORTER_OTLP_ENDPOINT=http://localhost:4317

# Events/logs only (no metrics)
export CLAUDE_CODE_ENABLE_TELEMETRY=1
export OTEL_LOGS_EXPORTER=otlp
export OTEL_EXPORTER_OTLP_PROTOCOL=grpc
export OTEL_EXPORTER_OTLP_ENDPOINT=http://localhost:4317
Your Claude Code activity should now automatically emit logs and metrics.
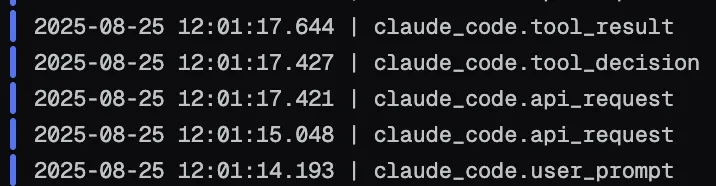
Finally, you should be able to view logs in Signoz Cloud under the logs tab:
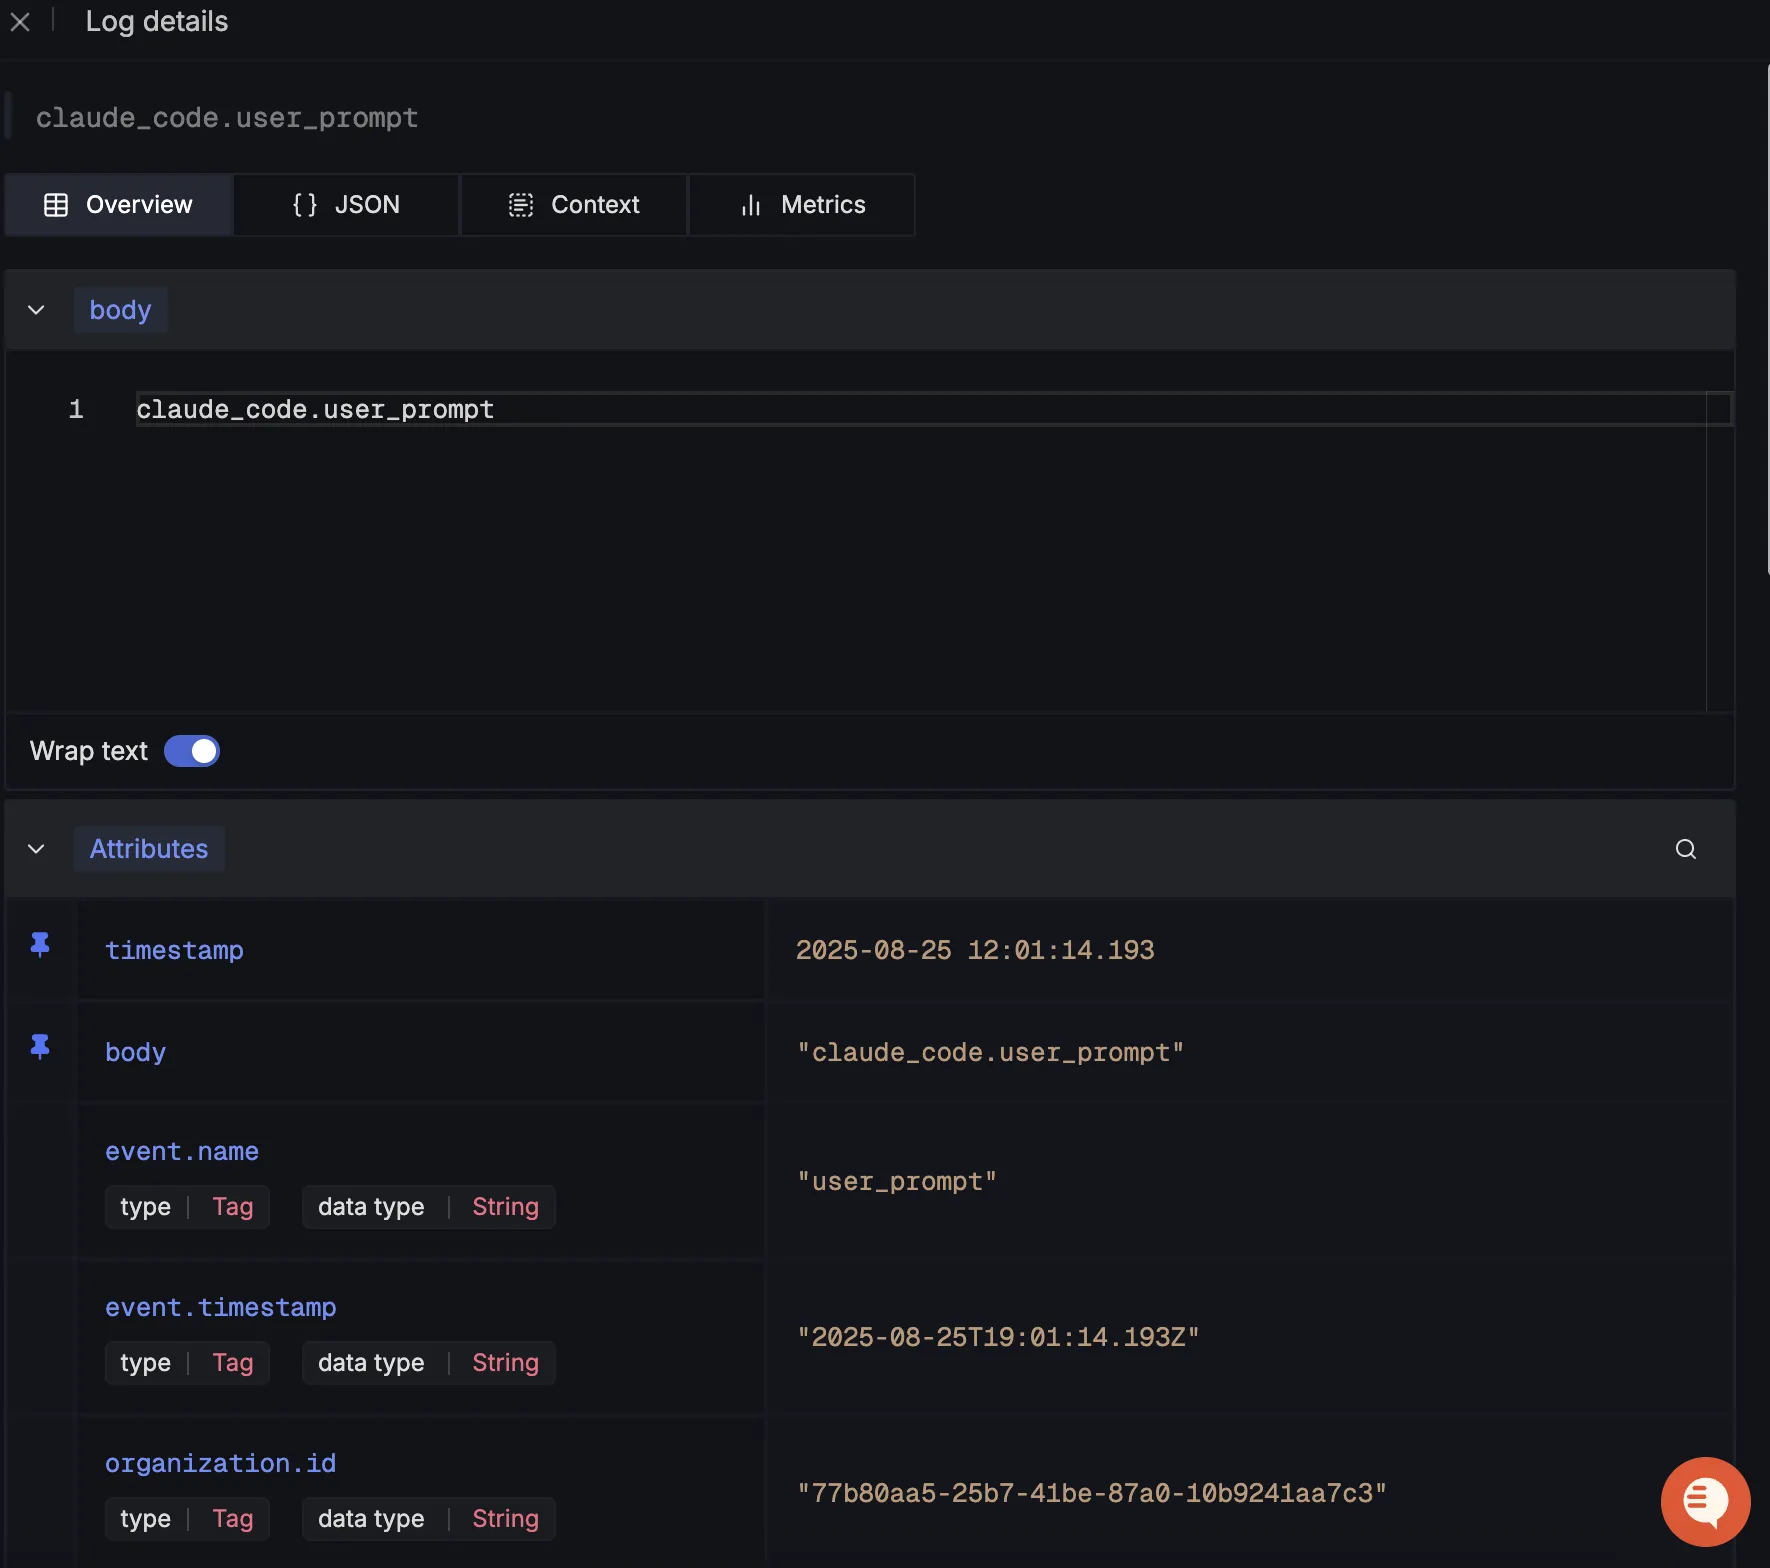
When you click on any of these logs in SigNoz, you'll see a detailed view of the log, including attributes:
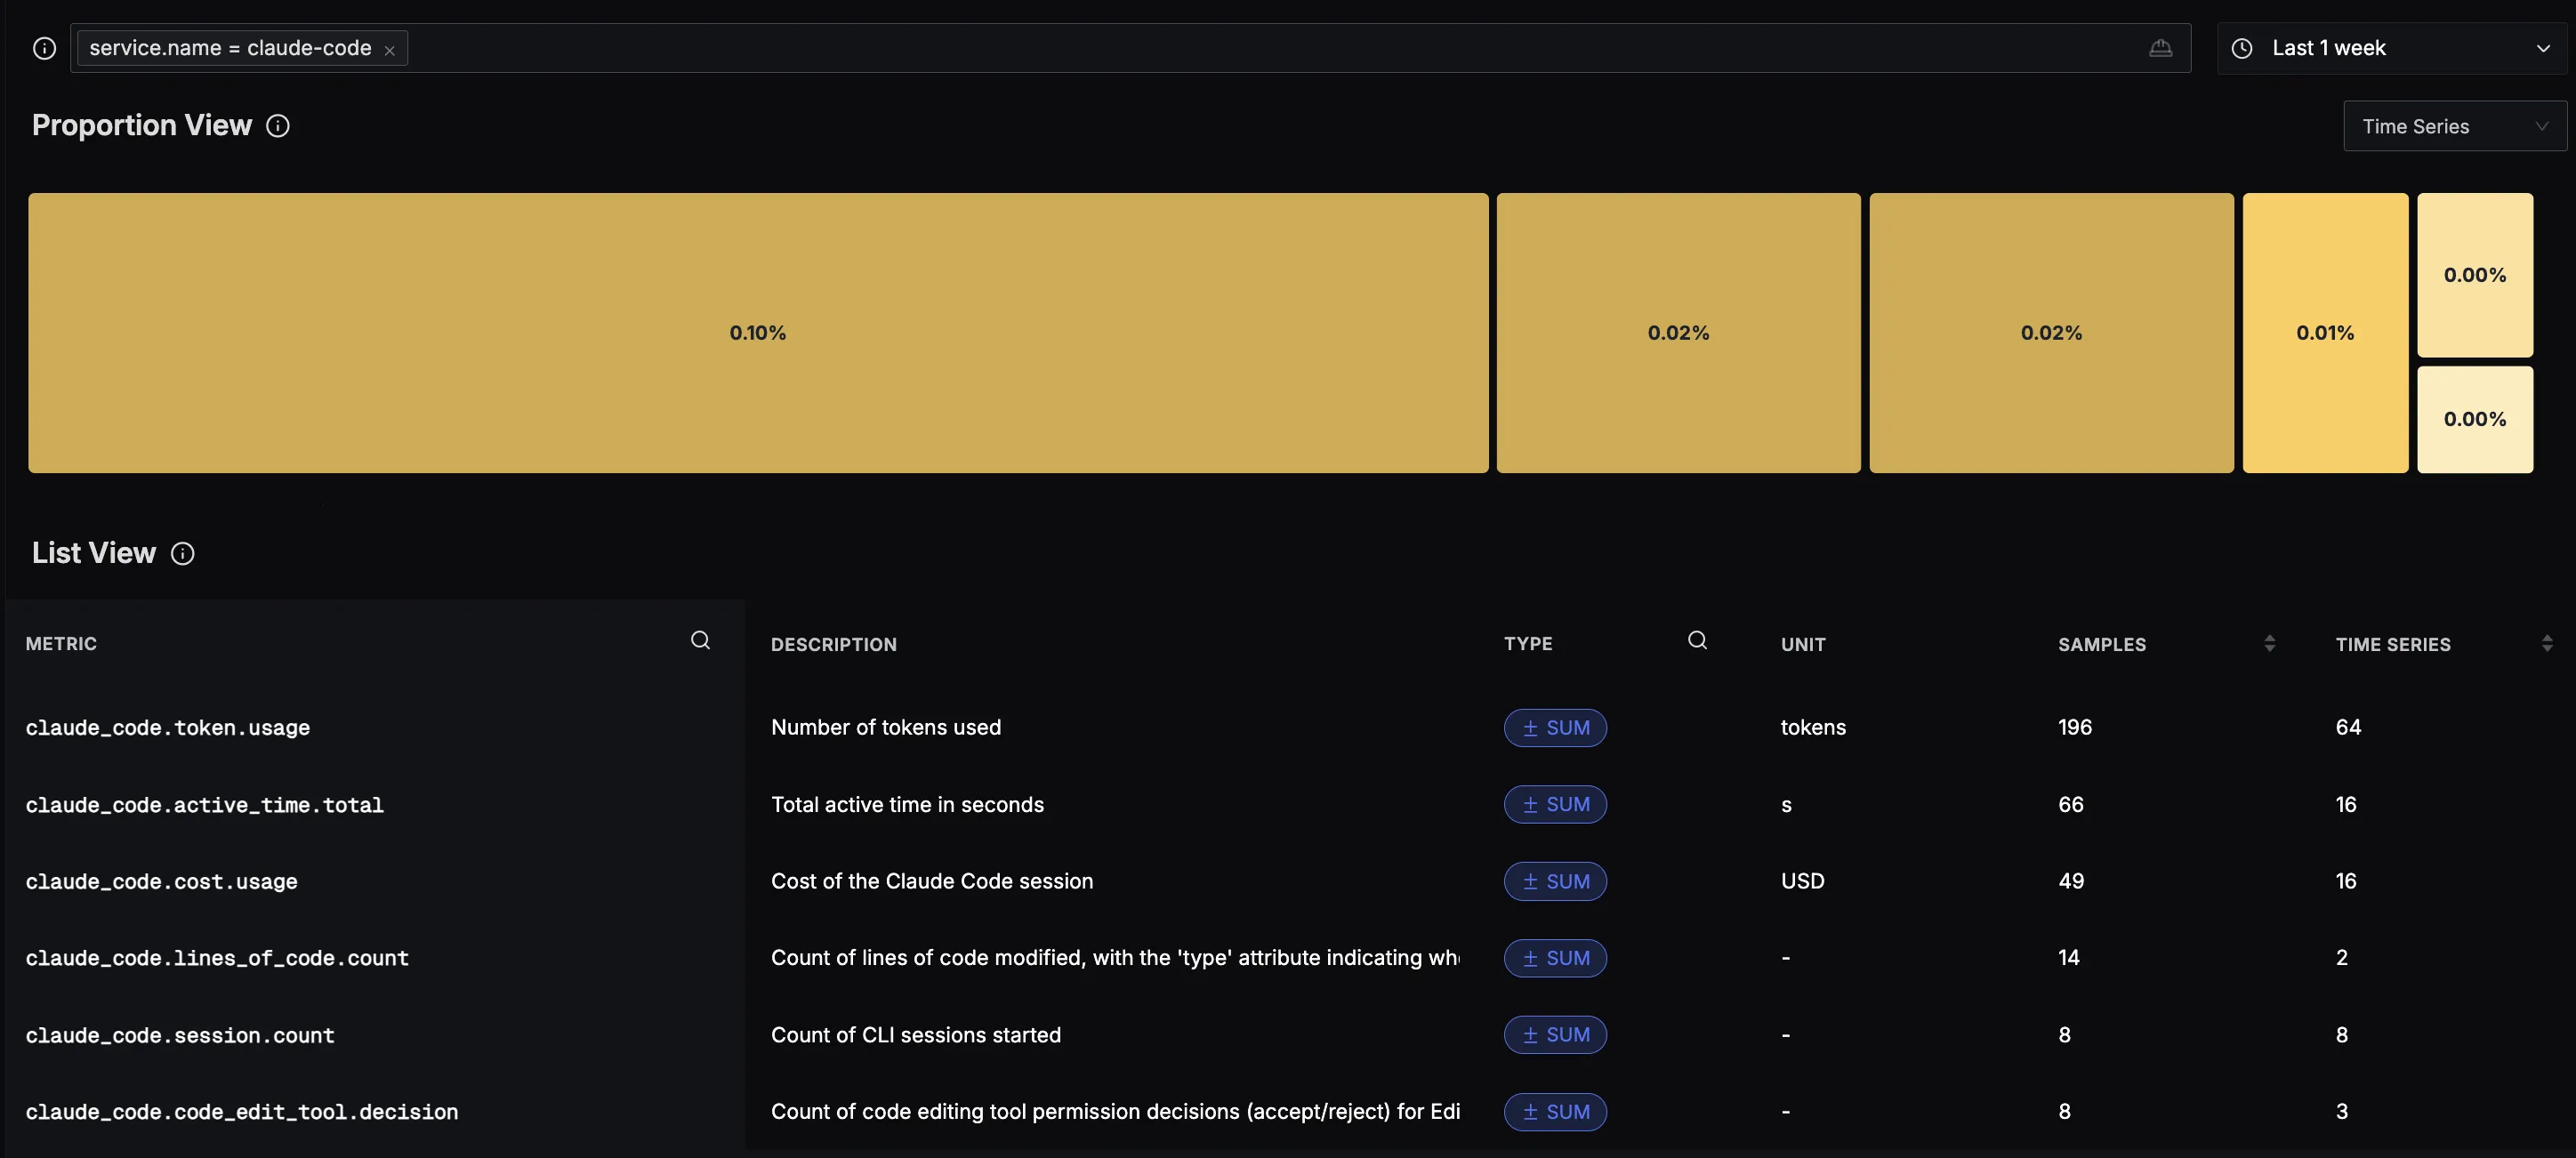
You should be able to see Claude Code related metrics in Signoz Cloud under the metrics tab:
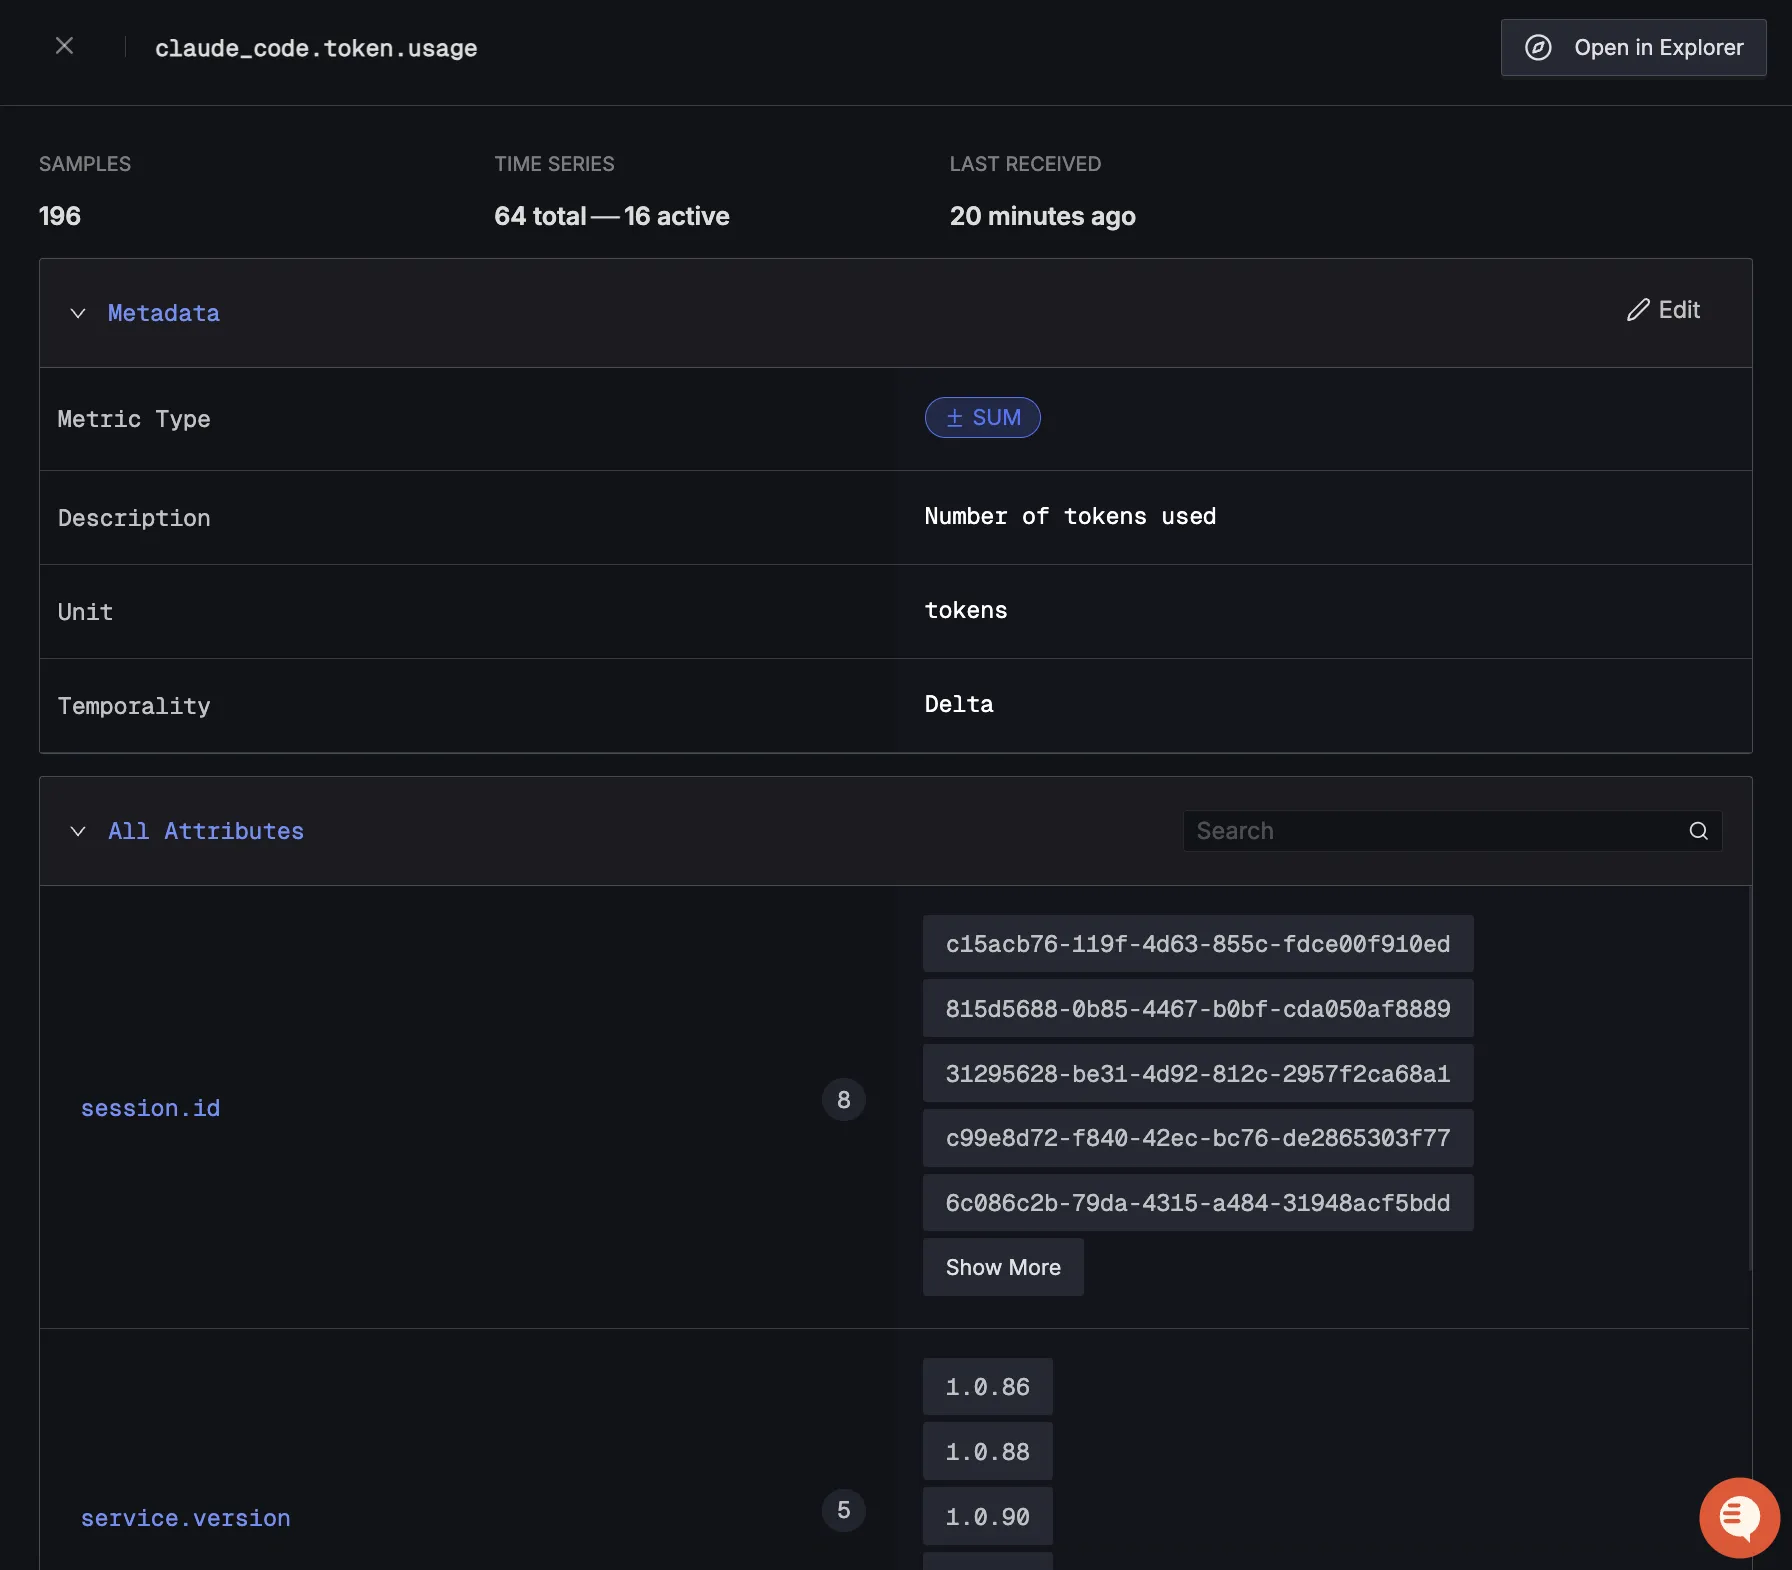
When you click on any of these metrics in SigNoz, you'll see a detailed view of the metric, including attributes:
Making Sense of Your Telemetry Data
Metrics
Once you've wired Claude Code into OpenTelemetry and SigNoz, you'll start to see a rich stream of metrics flowing in. But raw numbers don't mean much until you know what they represent. Let's break down the key metrics Claude Code exports and why they matter for teams looking to understand usage and impact.
claude_code.session.count→ How many CLI sessions are being started? This tells you how frequently developers are reaching for Claude in their day-to-day workflow.claude_code.lines_of_code.count→ Tracks the number of lines of code modified. A simple way to measure how much “hands-on” coding Claude is influencing.claude_code.pull_request.count→ Keeps count of pull requests created. Helpful for seeing if Claude is actually contributing to shipped code rather than just local tinkering.claude_code.commit.count→ Monitors the number of Git commits tied to Claude-assisted sessions. Great for measuring real integration into development cycles.claude_code.cost.usage→ Shows the cost of each session in USD. This is key for keeping budgets in check and spotting whether usage is spiking unexpectedly.claude_code.token.usage→ Tracks the number of tokens consumed. Useful for understanding scale, model efficiency, and forecasting spend.claude_code.code_edit_tool.decision→ Captures developer decisions when Claude suggests edits (accept vs. reject). Over time, this paints a picture of trust and adoption.claude_code.active_time.total→ The total active time (in seconds) a session runs. Think of this as a measure of “engagement depth”—longer active times often signal serious coding assistance.
With these metrics visualized in SigNoz, you move from raw telemetry to stories about usage: how often developers lean on Claude, how much code it influences, and whether it's paying off in commits, pull requests, and team efficiency.
Logs
Metrics give you the what and how much, but logs tell the story behind the numbers. Claude Code exports a variety of rich logs through OpenTelemetry that let you dig into the details of how developers interact with the assistant in real time. Here's a breakdown of the key event types and what they mean:
-
User Prompt Event (
claude_code.user_prompt)Logged whenever a developer submits a prompt. Attributes include timestamp, prompt length, and (optionally) the prompt itself if you've enabled
OTEL_LOG_USER_PROMPTS=1. This is your front-row seat into what kinds of requests developers are making and how frequently. -
Tool Result Event (
claude_code.tool_result)Captures the outcome of a tool execution. You'll see the tool name, whether it succeeded or failed, execution time, errors (if any), and the developer's decision (accept or reject). With this, you can measure not just tool usage but also trust and reliability.
-
API Request Event (
claude_code.api_request)Fired on every API call to Claude. Attributes include model name, cost, duration, token counts (input/output/cache), and more. This is where you connect usage directly to cost efficiency and performance.
-
API Error Event (
claude_code.api_error)Logged when an API request fails. You'll see error messages, HTTP status codes, duration, and retry attempts. These events are critical for debugging reliability issues and spotting patterns like repeated failures on specific models or endpoints.
-
Tool Decision Event (
claude_code.tool_decision)Records when a tool permission decision is made—whether developers accept or reject a suggested action, and the source of that decision (config, user override, abort, etc.). Over time, this shows how much developers trust Claude's automated suggestions versus stepping in manually.
By streaming these events into SigNoz, you don't just know that “Claude Code was used X times.” You can see the full lifecycle of interactions from a prompt being entered, to tools executing, to API calls completing (or failing), all the way to whether a developer accepted the outcome. It's observability not just at the system level, but at the human + AI collaboration level.
From Data to Dashboards: Bringing Claude Code Logs & Metrics to Life
Once you've got Claude Code's telemetry flowing into SigNoz, you can build dashboards to monitor critical metrics like total token usage, request patterns, and performance bottlenecks. You can check out our Claude Code dashboard template here.
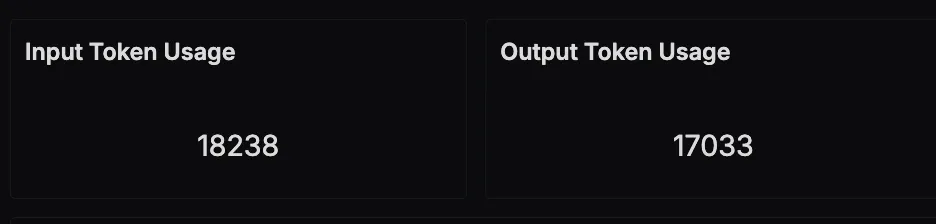
Total Token Usage (Input & Output)
Tokens are the currency of AI coding assistants. By splitting input tokens (developer prompts) and output tokens (Claude's responses), this panel shows exactly how much work Claude is doing. Over time, you can see whether usage is ramping up, stable, or dropping off—and keep an eye on efficiency.
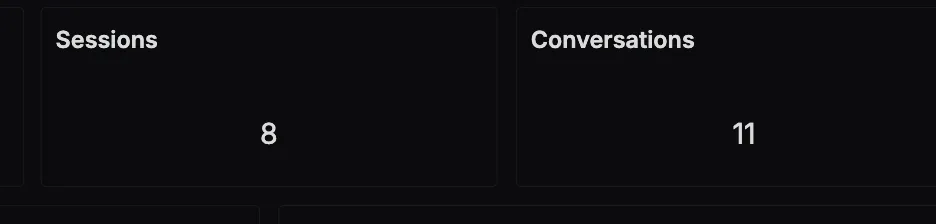
Sessions and Conversations
This panel tracks how many CLI sessions and conversations are happening. Sessions show how often developers are turning to Claude, while conversations capture depth of interaction. Together, they reveal adoption and engagement.
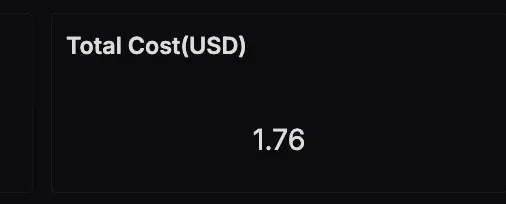
Total Cost (USD)
Claude Code usage comes with a cost. This panel translates token consumption into actual dollars spent. It's a quick way to validate ROI, spot runaway usage early, and ensure your AI assistant remains a cost-effective part of the toolchain.
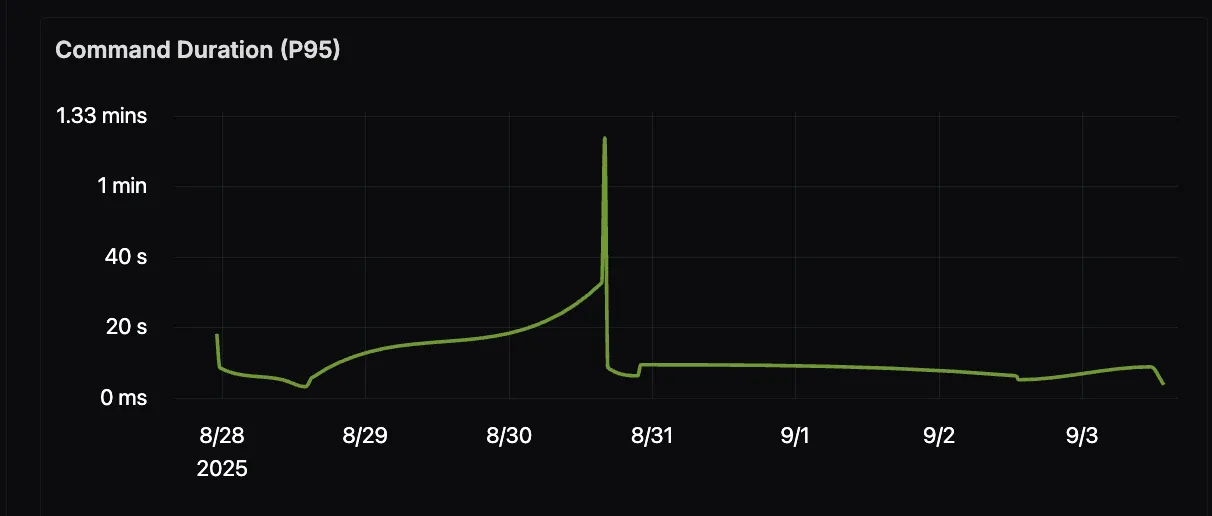
Command Duration (P95)
How long do Claude-assisted commands actually take? This chart tracks the 95th percentile duration, helping you catch slowdowns, spikes, or performance regressions. Developers want Claude to be fast—this view keeps latency in check.
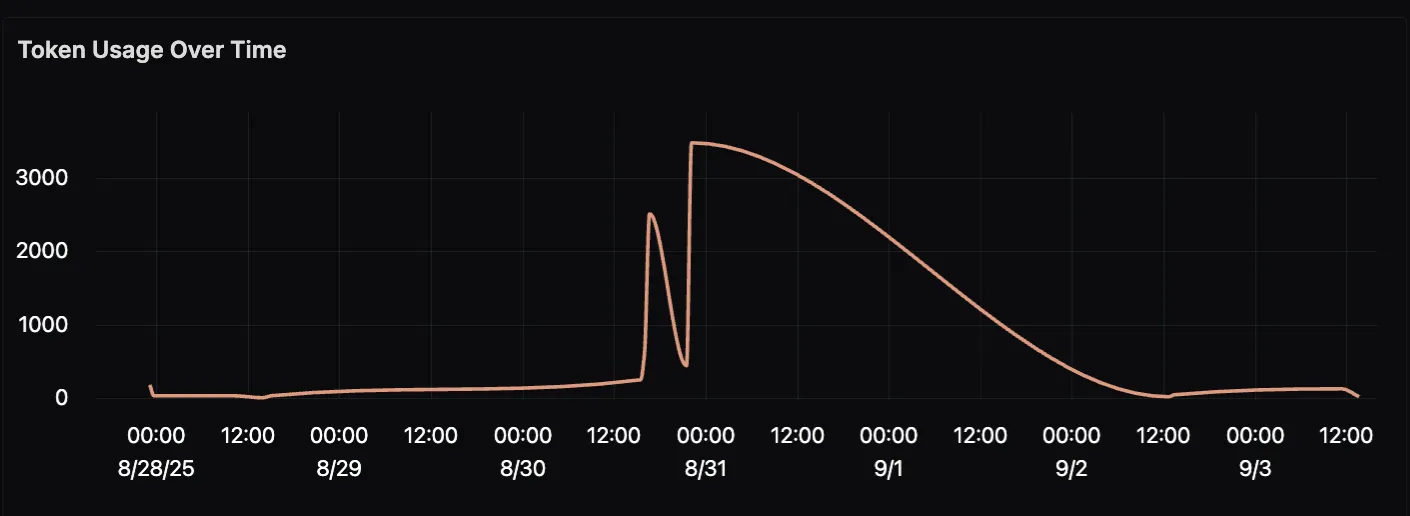
Token Usage Over Time
Instead of looking at total tokens in a snapshot, this time series shows usage trends. Are developers spiking usage during sprints? Is there a steady upward adoption curve? This view is perfect for spotting both growth and anomalies.
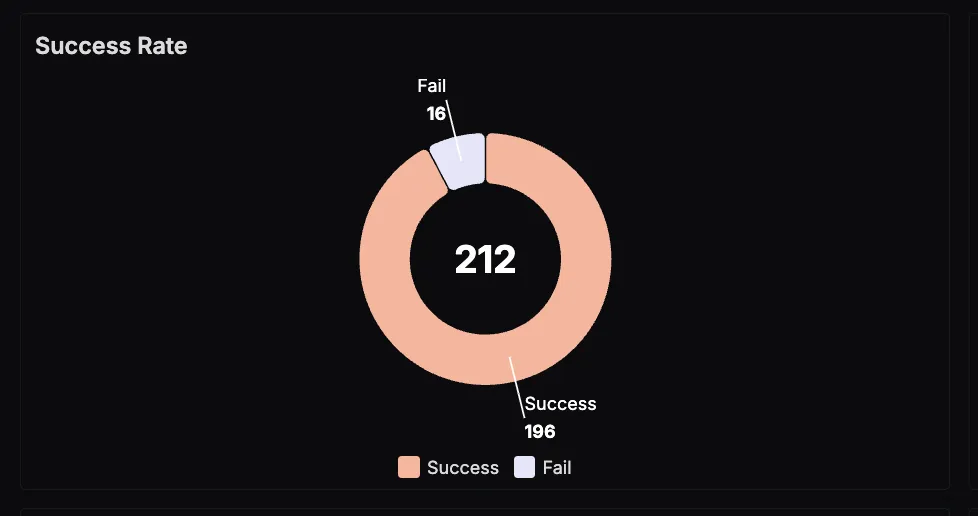
Success Rate of Requests
Not every request to Claude is successful. This panel highlights how often requests succeed vs. fail, helping you spot reliability issues—whether from the model, connectivity, or developer inputs. A healthy success rate means smooth workflows.
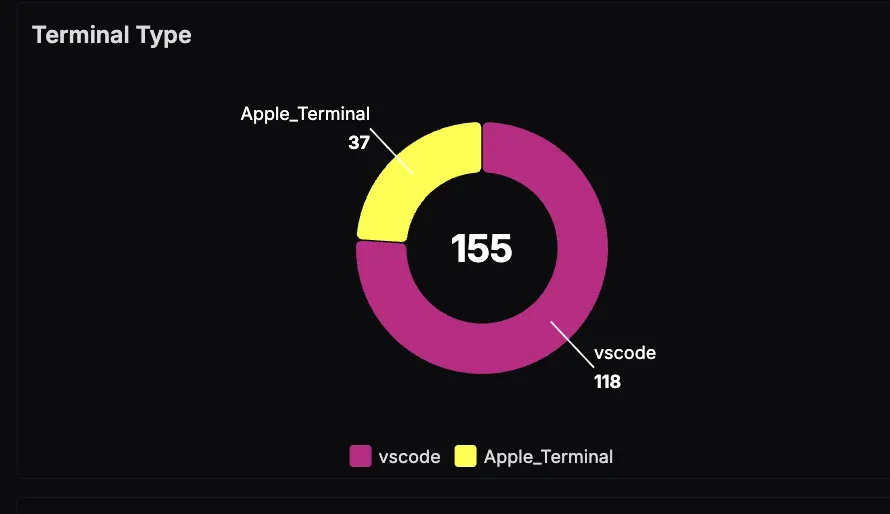
Terminal Type
Claude Code is flexible, but developers use it differently depending on environment. This pie chart shows where developers are working—VS Code, Apple Terminal, or elsewhere. Great for understanding adoption across dev setups.
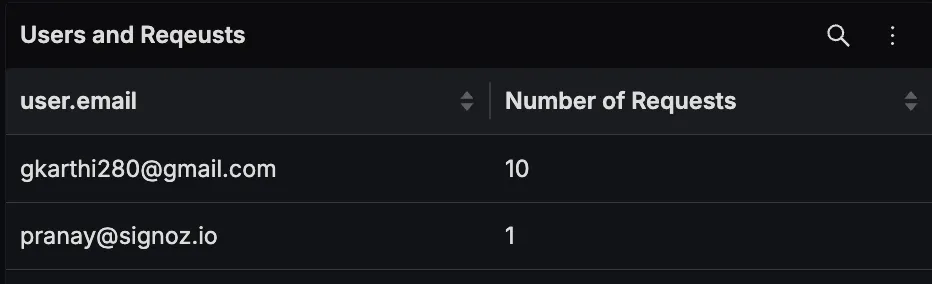
Requests per User
Usage isn't always evenly distributed. This table breaks down requests by user, making it clear who's leaning on Claude heavily and who's barely touching it. Perfect for identifying champions, training needs, or power users.
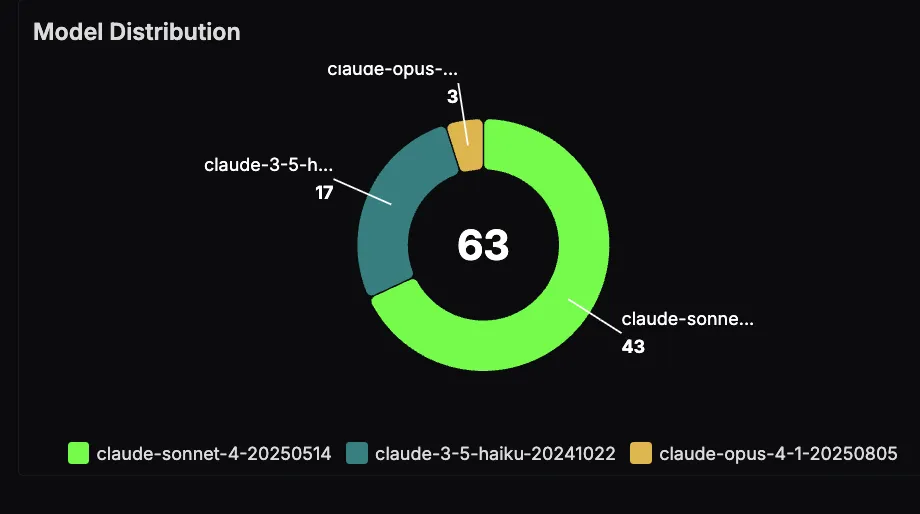
Model Distribution
Claude ships with multiple models, and not all usage is equal. This panel shows which models developers are actually calling. It's a handy way to track preferences and see if newer models are gaining traction.
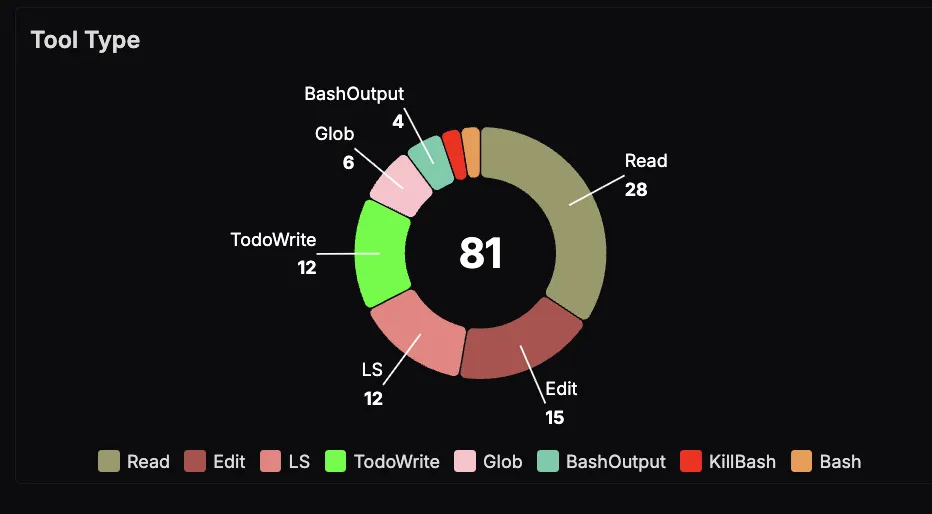
Tool Types
Claude can call on different tools—like Read, Edit, LS, TodoWrite, Bash, and more. This breakdown shows which tools are most frequently used, shining a light on the kinds of coding tasks developers are trusting Claude with.
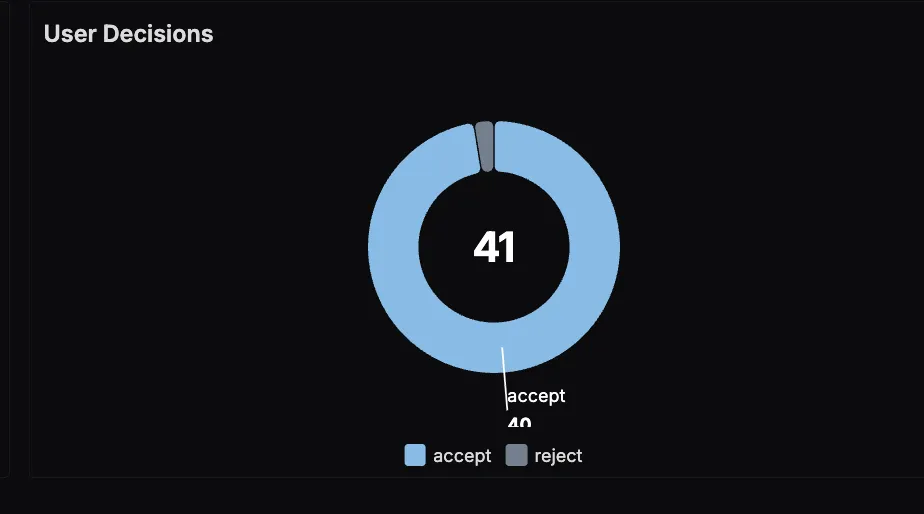
User Decisions
AI suggestions only matter if developers use them. This panel tracks accept vs. reject decisions, showing how much developers trust Claude's output. High acceptance is a sign of quality; high rejection is a signal to dig deeper.
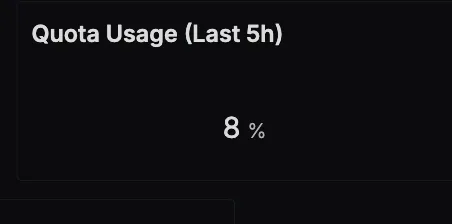
Quota Usage (5-Hour Rolling Window)
Claude Code subscriptions often come with rolling quotas that reset every 5 hours. This panel tracks how much of that rolling limit has been used based on your specific subscription plan, giving you an early warning system before developers hit hard caps. Instead of being caught off guard by usage rejections, teams can proactively manage consumption and adjust workflows as they approach the threshold.
Taken together, these panels create more than just a pretty dashboard. They form a control center for Claude Code observability. You can see usage patterns unfold in real time, tie costs back to activity, and build trust in Claude's role as part of the development workflow. Whether you're keeping budgets in check, tracking adoption, or optimizing performance, dashboards give you the clarity to manage AI-assisted coding at scale.
Access Observability Inside Your Coding Agents
You've now instrumented Claude Code and verified that logs and metrics are flowing into SigNoz. As a next step, you can connect the SigNoz MCP Server to Claude Code and query this telemetry in natural language from your coding workflow. For an overview of how this fits into SigNoz's broader approach, see Agent Native Observability.
Wrapping It Up
As AI coding assistants like Claude Code become part of daily developer workflows, observability isn't optional—it's essential. By combining Claude Code's built-in monitoring hooks with OpenTelemetry and SigNoz, you can transform raw telemetry into a living, breathing picture of usage, performance, and cost.
From tracking tokens and costs, to understanding which tools and models developers actually rely on, to surfacing adoption trends and decision patterns, observability gives you the power to manage Claude Code with the same rigor you bring to any other critical piece of infrastructure. Dashboards then tie it all together, turning streams of data into a real-time pulse of how Claude Code powers development.
The result? Teams gain the confidence to scale Claude Code usage responsibly, optimize for performance and spend, and most importantly, make evidence-backed decisions about how AI fits into their engineering culture. With visibility comes clarity and with clarity, Claude Code becomes not just an assistant, but a measurable driver of developer productivity.
To go deeper, see how SigNoz compares to dedicated LLM observability tools and what to look for when model monitoring AI workloads in production. If you're folding Claude Code telemetry into a wider stack, our guides on APM tools, distributed tracing, and the APM metrics that matter give you the foundations, while single pane of glass monitoring shows how to bring it all into one view. And if you're weighing your instrumentation approach, OpenTelemetry vs APM lays out the trade-offs.
