Client logging | Best practices and examples
Client logging refers to the practice of collecting and storing log messages generated by client software, such as a web browser or mobile application. These log messages can provide valuable information about the behavior and performance of the client software, as well as any errors or issues that may have occurred.
Client logging is often used by developers to troubleshoot and debug software issues, as well as to gather data for analysis and performance optimization. It can also be used to monitor the usage and behavior of client software by end users.
What is client logging?
In modern applications, a lot happens on the client or browser. Client-side applications are also more complex than ever. In matters of milliseconds, you can lose your customers to competitors if the client-side application is not performing well. Hence, it is of utmost importance to understand how your client-side applications are performing.
Client logging can help developers get a clear picture of what is happening on the client side. The first step to client logging involves identifying the types of log messages that are most important for your purpose. Some examples of client logs are error messages, performance metrics, usage data, security events, or network events.
Types of Client Logs
Client logs can be a different types depending on your use-case. Here are some common examples of client logs:
-
Error Messages
These logs might be generated when the client software encounters an error or exception. These logs can help developers identify the source of the issue and take steps to fix it. -
Performance Metrics
Client logs might include information about the performance of the software, such as how long certain operations take to complete or how much memory the software is using. This can help developers optimize the software's performance. -
Usage data
Client logs might record information about how the software is being used by end users, such as which features are being accessed most frequently or which parts of the user interface are being interacted with the most. This can be useful for understanding user behavior and improving the user experience. -
Security Events
Client logs might include information about security-related events, such as attempted logins or access to sensitive data. This can help organizations monitor for potential security threats and respond appropriately. -
Network Events
Client logs might record information about network activity, such as the status of connections to servers or the transfer of data between the client and server. This can help developers troubleshoot connectivity issues and optimize network performance.
How are client logs collected?
Client logs can be collected and stored in a variety of ways, such as writing to a local file on the client device, sending messages to a remote server, or storing log data in a centralized logging platform. The specific approach will depend on the needs and requirements of the client software and the team responsible for managing it.
-
Writing to a local file
One option is to have the client software write log messages to a file stored on the client's device. This approach is relatively simple and can be useful for collecting logs from standalone client applications or gathering log data from devices that are not always connected to a network. -
Sending log messages to a remote server
Another option is to have the client software send log messages to a remote server, either as part of a request-response cycle or via a separate log-forwarding mechanism. This can be useful for centralizing log data from multiple client devices and for allowing logs to be analyzed and searched in real time. -
Using a centralized logging platform
A centralized logging platform is a specialized system for collecting, storing, and managing log data from multiple sources. These platforms can offer features such as real-time searching, alerting, and visualization, which can make it easier to manage and analyze log data at scale.
The specific approach that is used will depend on the needs and requirements of the client software and the team responsible for managing it.
Client Logging with OpenTelemetry
OpenTelemetry can be used to collect client-side logs, metrics, and traces. OpenTelemetry is an open-source collection of tools, APIs, and SDKs that aims to standardize how we generate and collect telemetry data.
Using OpenTelemetry client libraries in various languages, you can generate and collect a lot of useful information with telemetry signals. For browser instrumentation, OpenTelemetry provides client libraries in Javascript to instrument your broswer.
You can read more about implementing OpenTelemetry browser instrumentation here.
Once the logs are collected, you will ideally need a log management tool to store, query and analyze your logs. SigNoz, an open source APM can help you to store and analyze your client logs.
Analyze your client logs with SigNoz
SigNoz is a full-stack open-source APM that can be used as a log management tool. SigNoz uses a columnar database ClickHouse to store logs, which is very efficient at ingesting and storing logs data. Columnar databases like ClickHouse are very effective in storing log data and making it available for analysis.
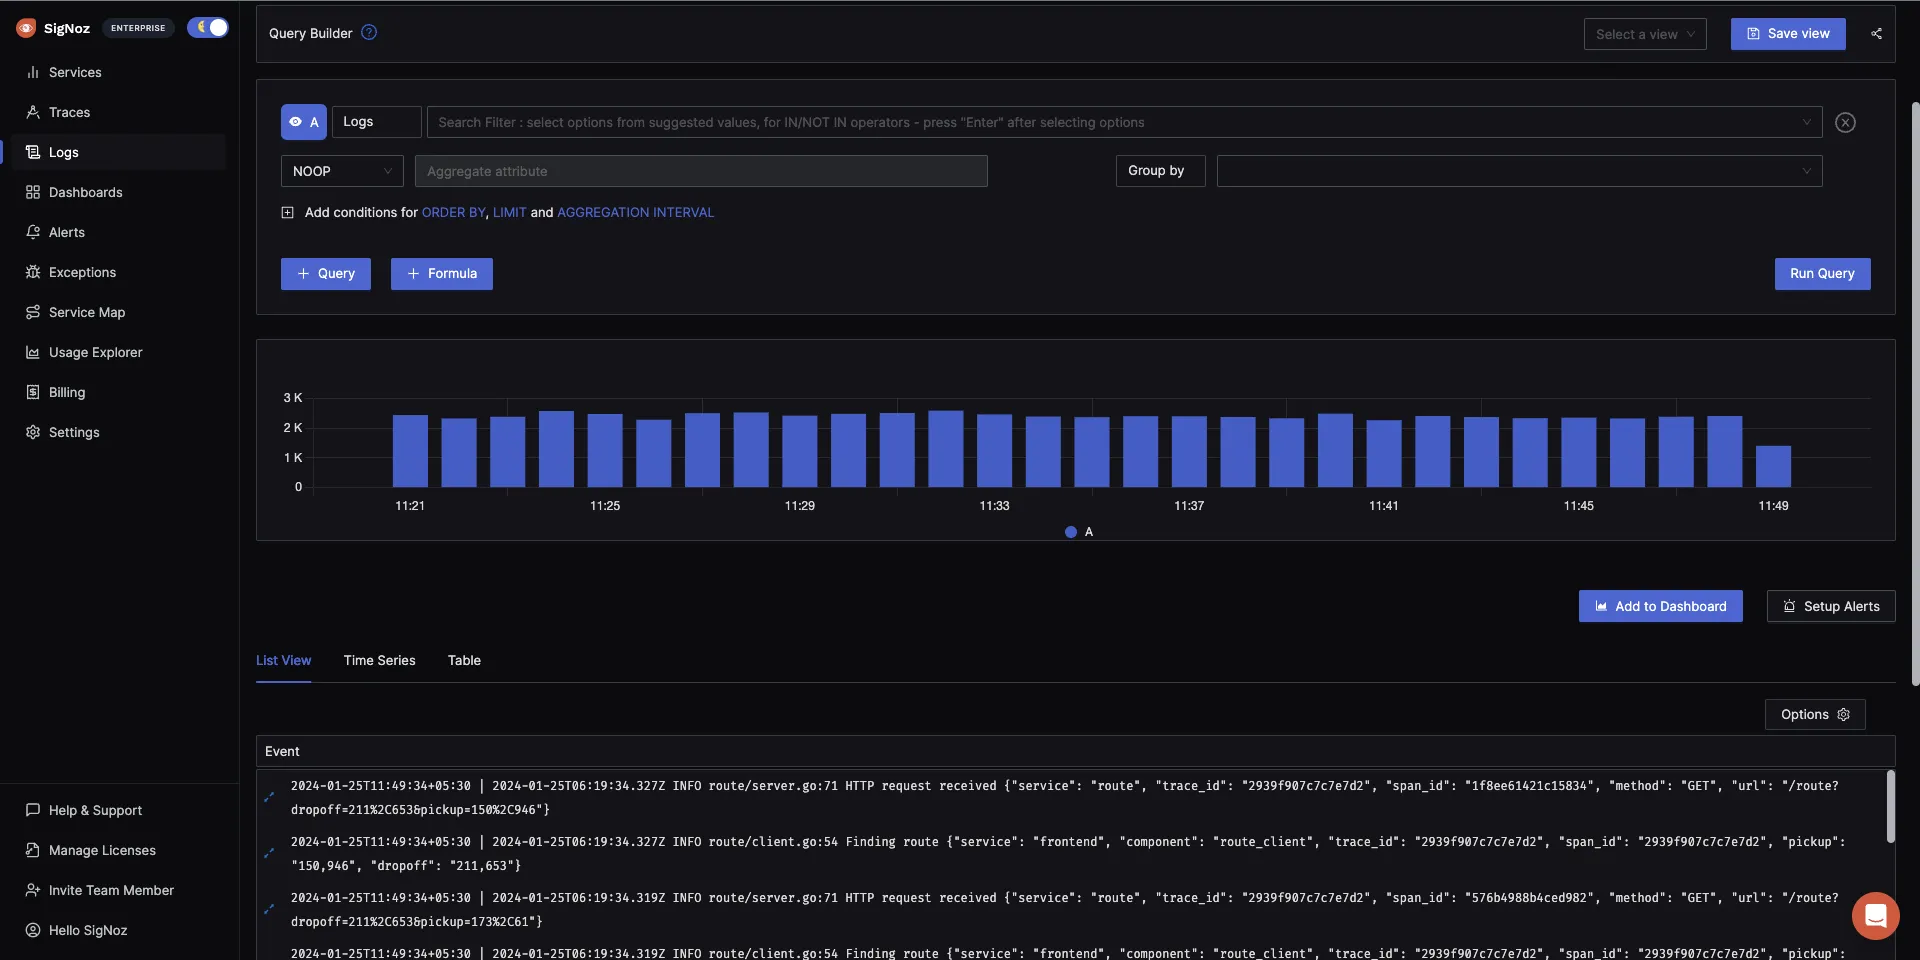
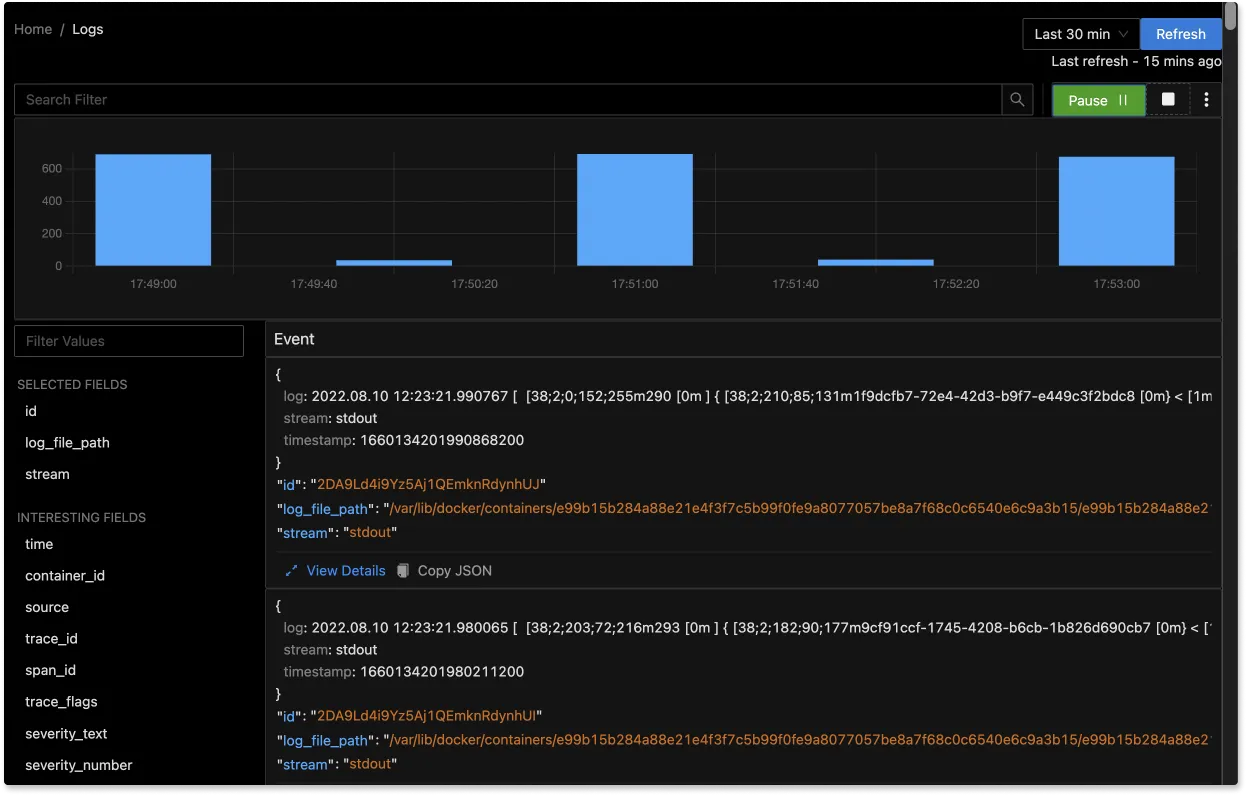
The logs tab in SigNoz has advanced features like a log query builder, search across multiple fields, structured table view, JSON view, etc.
You can also view logs in real time with live tail logging.
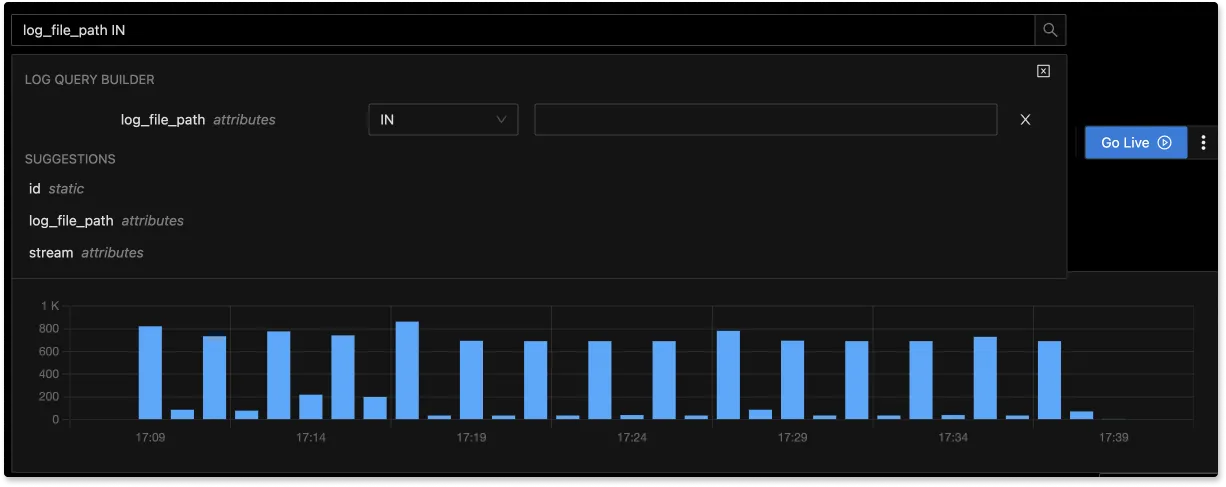
With advanced Log Query Builder, you can filter out logs quickly with a mix and match of fields.
Getting started with SigNoz
SigNoz Cloud is the easiest way to run SigNoz. Sign up for a free account and get 30 days of unlimited access to all features.

You can also install and self-host SigNoz yourself since it is open-source. With 24,000+ GitHub stars, open-source SigNoz is loved by developers. Find the instructions to self-host SigNoz.
Related Content
