Logs UI | An intuitive UI for Log Management
A logs UI is a user interface for displaying log data. Logs are records of events that happen on a computer system, such as messages indicating that a particular operation has been performed or an error has occurred.
A logs UI typically allows a user to view and search through log data and may also provide features such as filtering and highlighting to help the user find specific log entries of interest.
Some logs UI may also allow the user to perform actions based on the log data, such as acknowledging an error or restarting a service. System administrators and developers often use logs UIs to troubleshoot issues and monitor the health and performance of a system.
Important aspects of Logs UI
Logs play a critical role in a developer’s workflow. Logs help you debug and troubleshoot your applications. They are also useful for other purposes like auditing and compliance, performance monitoring, and security.
Most organizations choose a log management tool based on their requirements. The user interface that the log management tool provides, plays an important role in how fast you can debug your applications.
Some of the key aspects that you should check before choosing a Logs UI:
-
Ease of use
The log management tool should be easy for users to understand and use, with a clear and intuitive interface. -
Search and filter
The UI should allow users to search and filter log data to quickly find specific log entries of interest. -
Visualization
The UI should provide clear and informative visualizations of log data, such as graphs and charts, to help users understand and analyze the data. -
Alerts and notifications
The UI should allow users to set up alerts and notifications for specific log events, such as errors or warnings. -
Customization
The UI should allow users to customize the display and layout of the log data to meet their specific needs and preferences. -
Access control
The UI should provide secure access to log data, with appropriate permissions and controls to ensure that only authorized users have access to the data. -
Performance
The UI should be fast and responsive, with the ability to handle large amounts of log data efficiently. -
Integration
The UI should integrate seamlessly with other tools and systems, such as monitoring and analytics platforms, to provide a comprehensive view of the system.
Logs UI by Open Source APM - SigNoz
SigNoz is full-stack open source Application Performance Monitoring tool that you can use for monitoring logs, metrics, and traces. Having all the important telemetry signals under a single dashboard leads to less operational overhead. Users can also access telemetry data with richer context by correlating these signals.
Let us look at some of the key features of SigNoz as a log analytics tool.
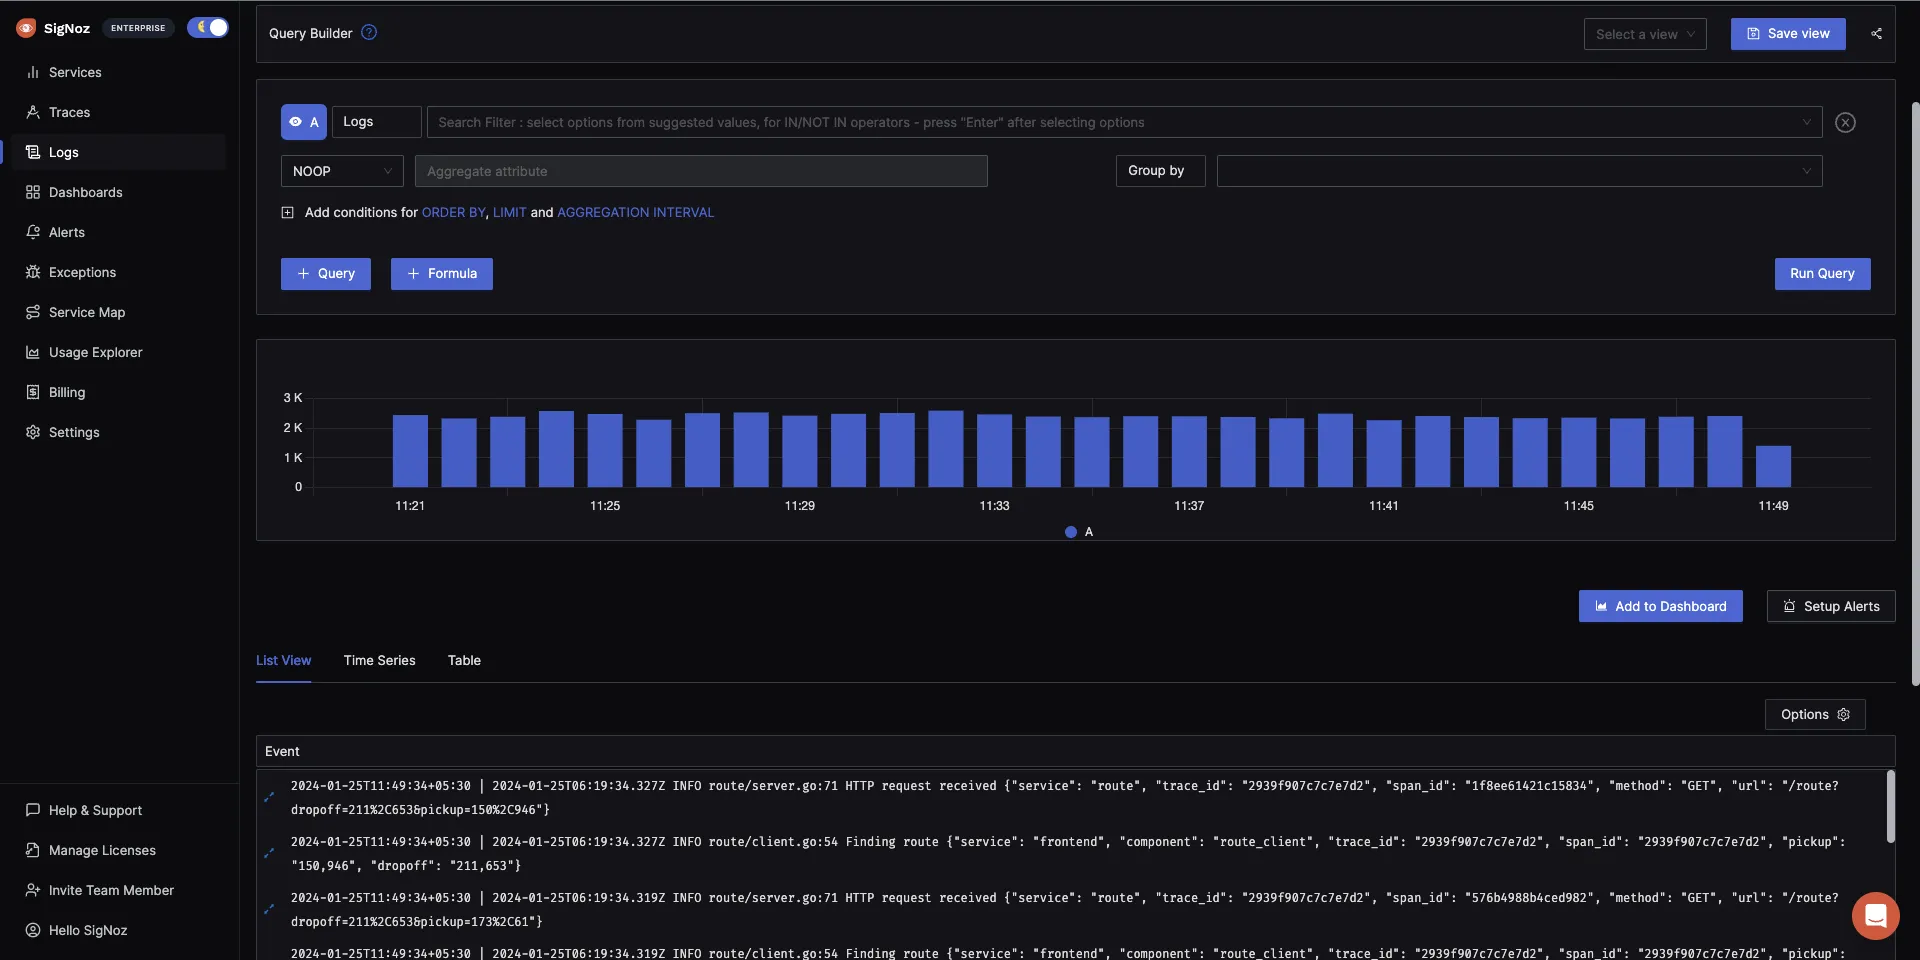
Out-of-box intuitive UI for Logs management
SigNoz provides an intuitive UI to see your logs data with the ability to see logs volume, logs data, and important fields at a glance.
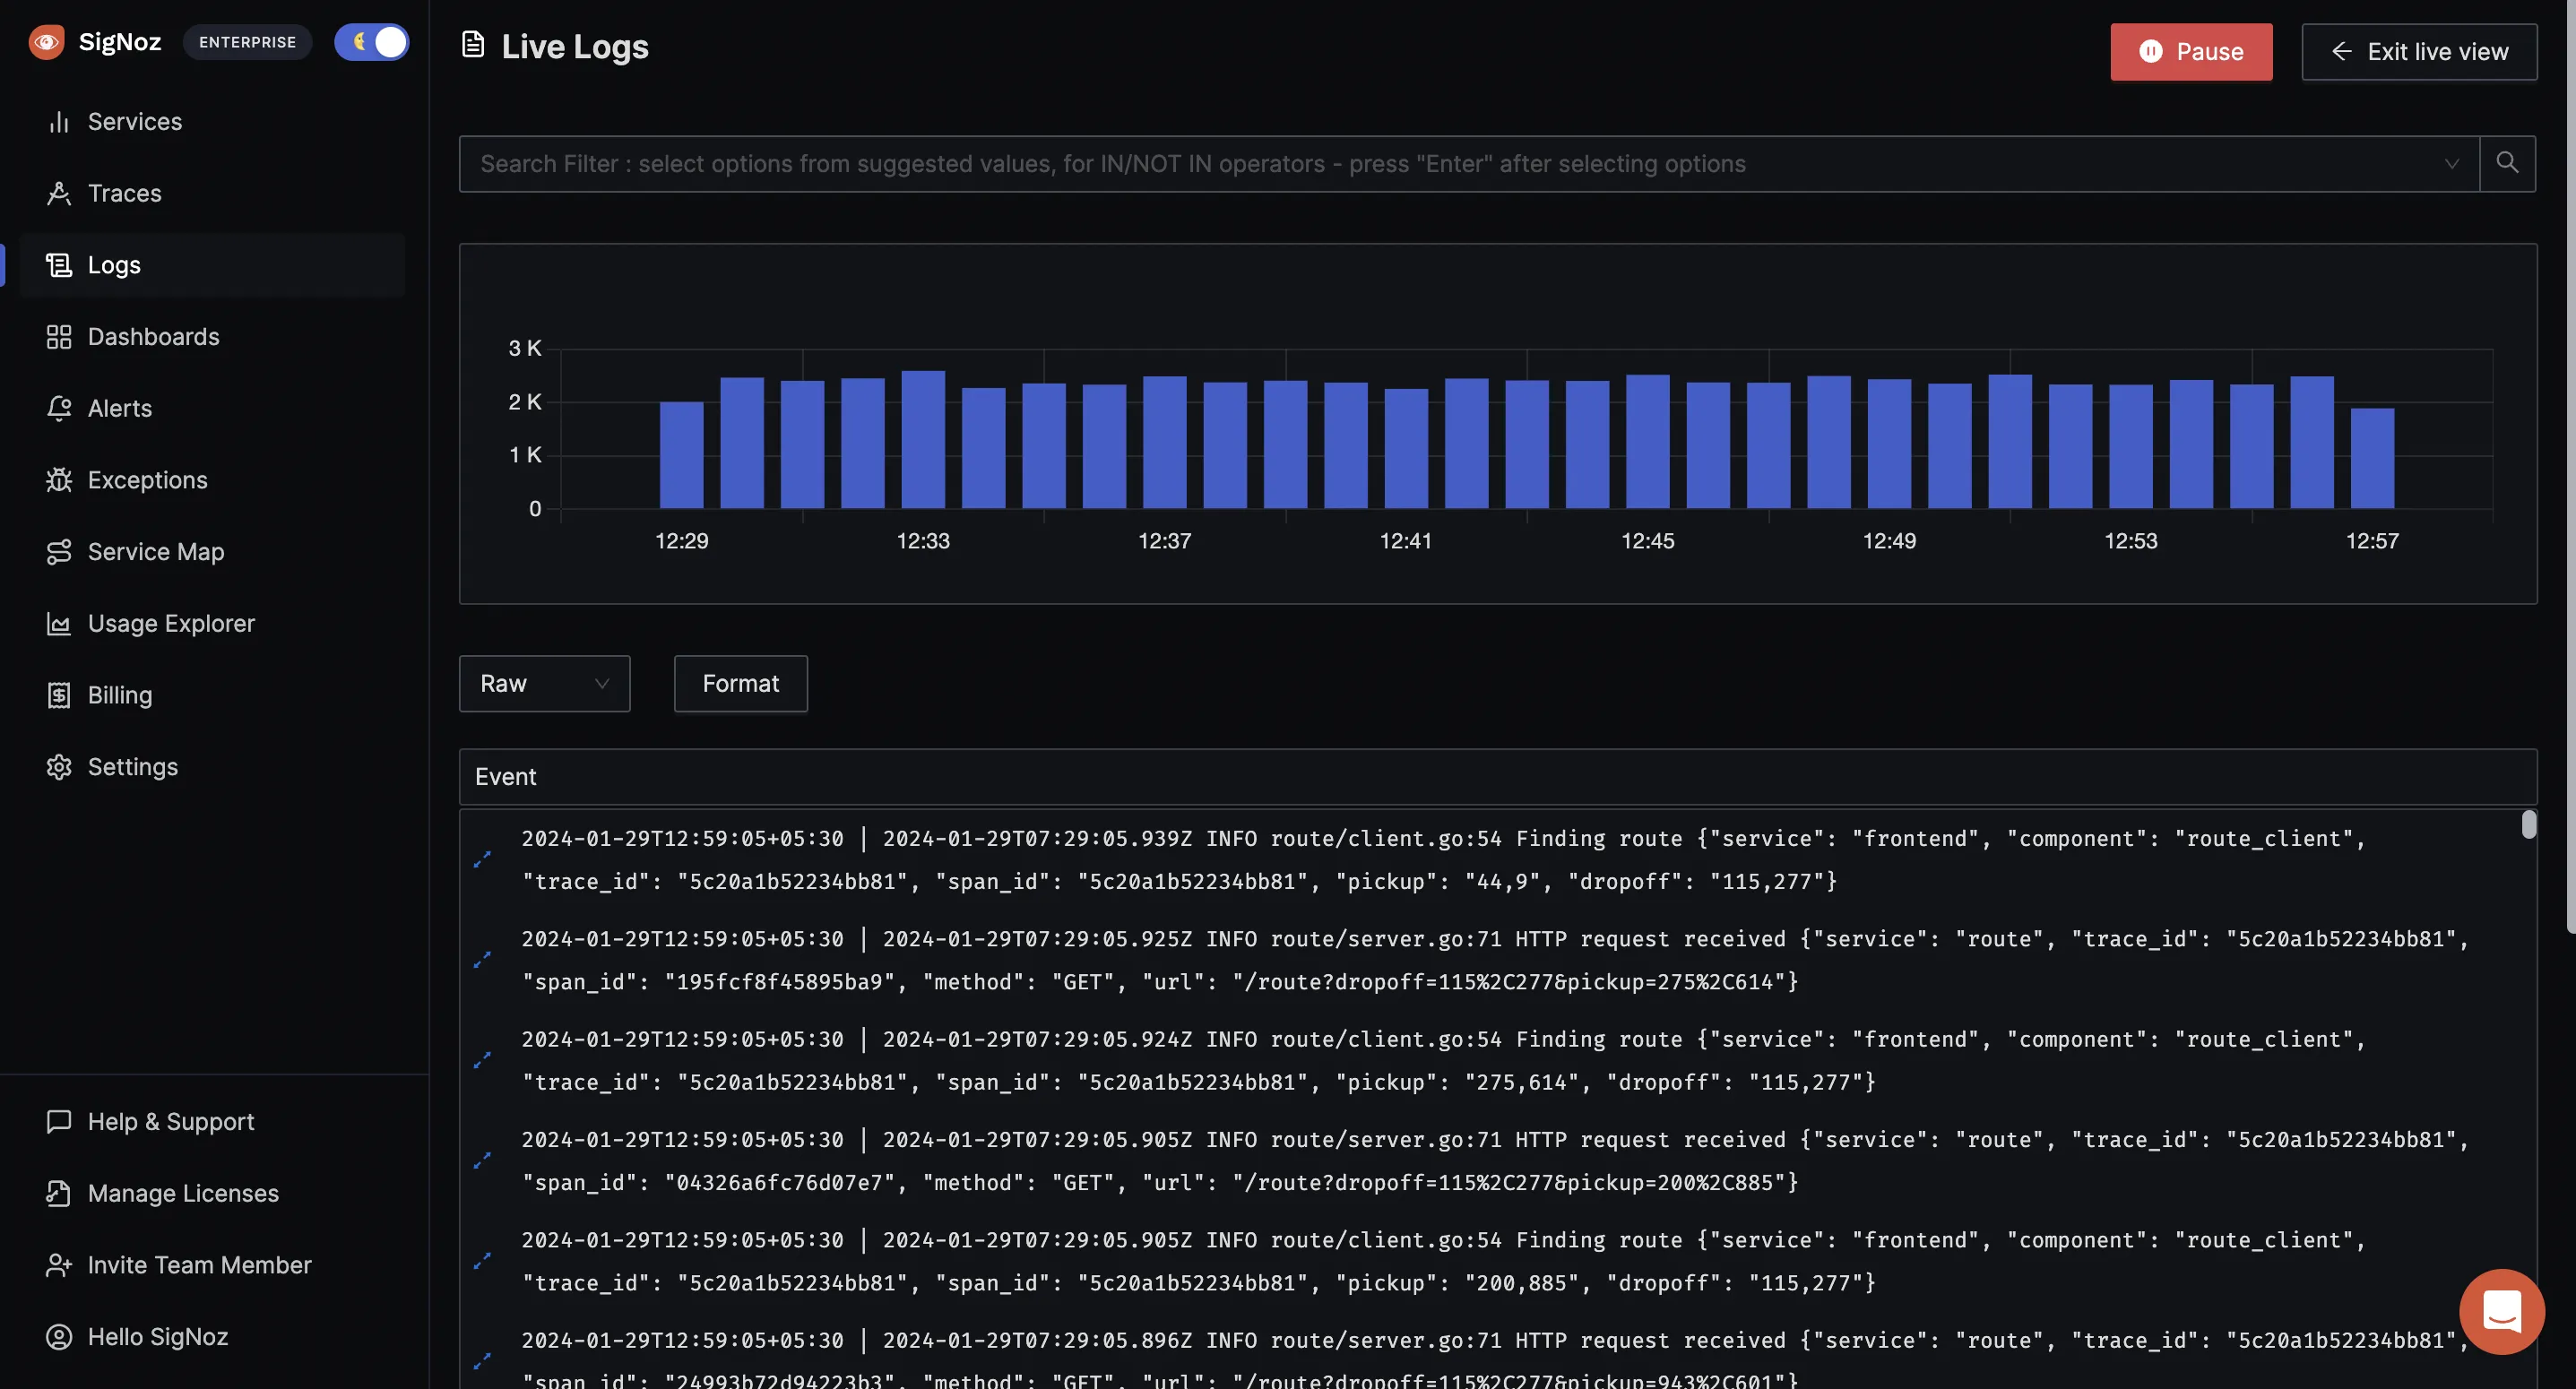
Live Tail Logging
You can also view logs in real-time with live tail logging.
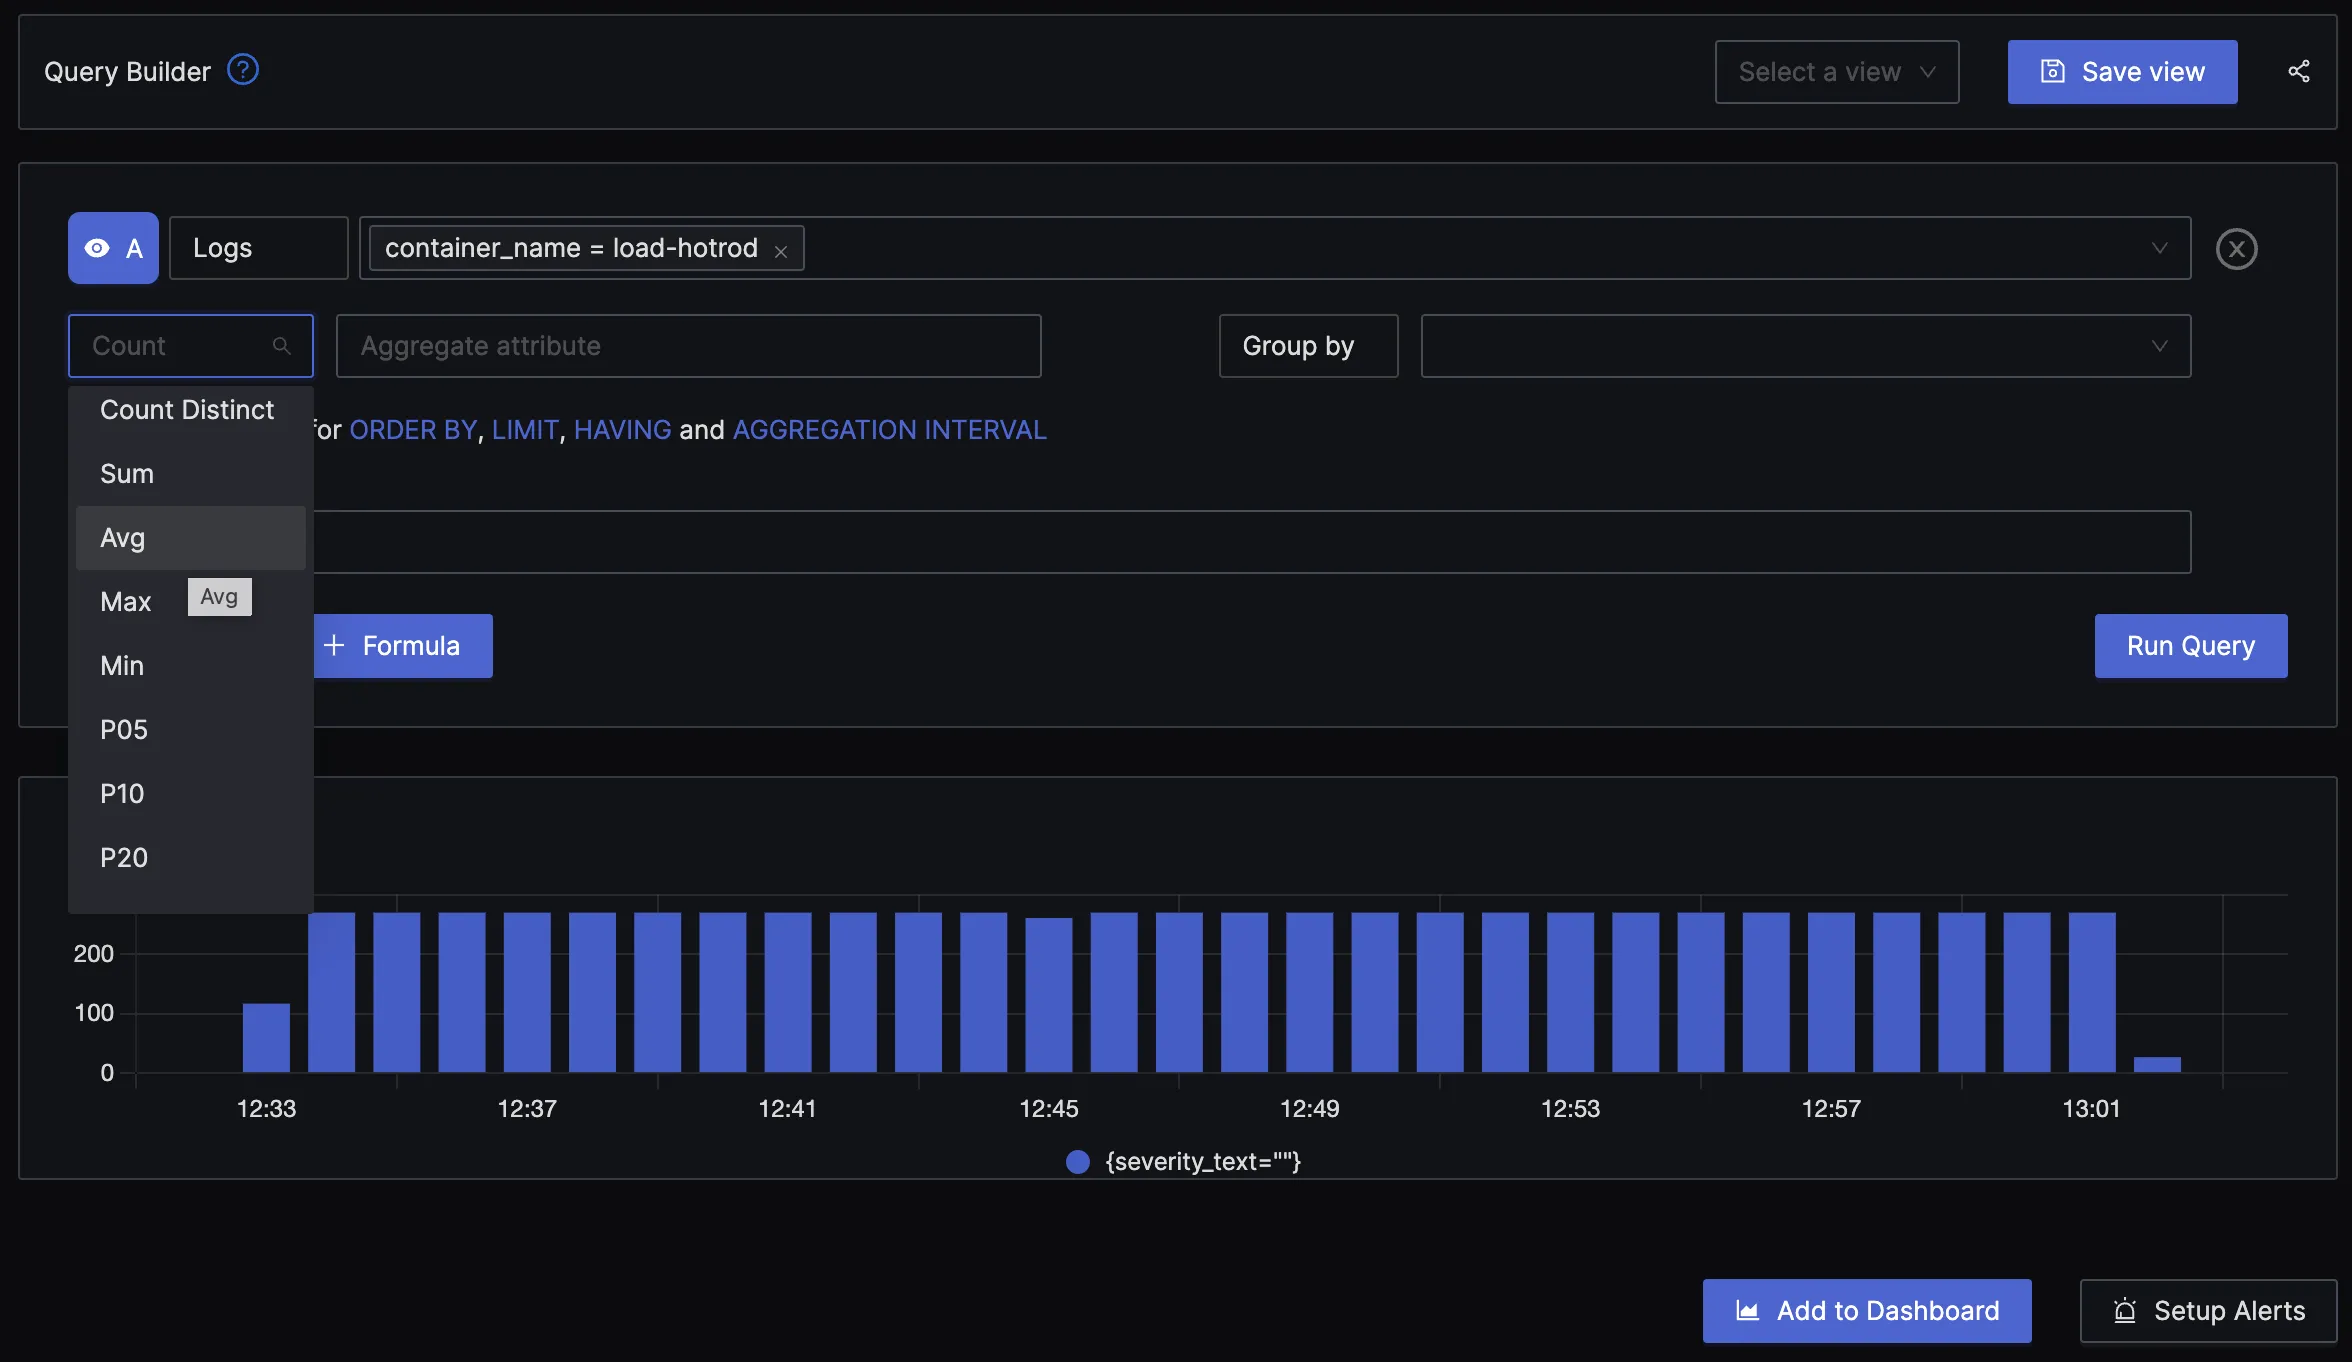
Advanced Logs Query Builder
Log data is often vast, and developers need to check and see the logs they are interested in quickly. With an advanced Log Query Builder, you can filter out logs quickly with a mix-and-match of fields.
Correlating Logs with other Observability signals
As SigNoz uses OpenTelemetry to collect and parse logs, you can use it to correlate logs with other observability signals like traces and metrics. Correlating logs with other observability signals can enrich your logs data and help debug applications faster.
Seamless transition from your existing logging pipelines
Shifting your logs pipeline to SigNoz is easy and simple. If you are using FluentBit, FluentD, or Logstash to collect logs, you can easily shift your logs pipeline to SigNoz. Check out the instructions here.
Getting started with SigNoz
SigNoz Cloud is the easiest way to run SigNoz. Sign up for a free account and get 30 days of unlimited access to all features.

You can also install and self-host SigNoz yourself since it is open-source. With 24,000+ GitHub stars, open-source SigNoz is loved by developers. Find the instructions to self-host SigNoz.
Related Content
OpenTelemetry Logs - A Complete Introduction & Implementation
An Open Source OpenTelemetry APM
