Top 9 AWS CloudWatch Alternatives For Centralized Monitoring
Are you tired of the limitations of AWS CloudWatch? Do you need a more comprehensive monitoring solution for your multi-cloud infrastructure? You're not alone. Many DevOps teams and software engineers find themselves searching for CloudWatch alternatives that offer broader integration capabilities, advanced features, and better cost-effectiveness.
CloudWatch, while a solid native monitoring service for AWS, often falls short when it comes to monitoring complex, distributed systems—especially those spanning multiple cloud providers. This is where CloudWatch alternatives come into play, offering enhanced observability and more flexible pricing models.
In this article, you'll discover the top 9 CloudWatch alternatives that can supercharge your monitoring efforts. We'll explore their key features, benefits, and potential drawbacks to help you make an informed decision for your organization's needs.
What is CloudWatch and Why Consider Alternatives?
Amazon CloudWatch is a monitoring and observability service provided by Amazon Web Services (AWS). It allows you to collect, monitor, and analyze data from various AWS resources, applications, and services in real-time.
CloudWatch is a good tool for monitoring AWS, but it gives you limited visibility. You also need a centralized monitoring tool if you're monitoring things outside of AWS.
CloudWatch has several limitations:
- AWS-centric focus: It's primarily designed for AWS services, making it less effective for multi-cloud or hybrid environments. For a breakdown of what CloudWatch actually monitors versus what CloudTrail handles, see our comparison guide.
- Pricing structure: Costs can escalate quickly with increased usage, especially for high-cardinality metrics.
- Limited customization: Advanced visualization and querying capabilities are somewhat restricted compared to specialized monitoring tools.
These limitations have led to a growing need for more comprehensive, multi-cloud monitoring solutions. CloudWatch alternatives often offer:
- Better support for diverse tech stacks
- More advanced analytics and visualization capabilities
- Improved cost-effectiveness for large-scale deployments
- Enhanced features for distributed tracing and APM
Top CloudWatch Alternatives
Below are some of the top CloudWatch alternatives:
SigNoz
SigNoz is a great CloudWatch alternative to take observability and performance monitoring of your applications to the next level. It provides logs, metrics, and traces under a single pane of glass, along with easy-to-use alerting.
SigNoz leverages the power of ClickHouse, a columnar database known for its exceptional efficiency in processing and storing log data. This makes it an ideal choice for robust log management and analysis.
SigNoz also provides both metrics monitoring and distributed tracing. You can correlate application metrics and traces easily with a single click. For example, if your application is having high latency, you can dig into traces at that particular timestamp to understand performance bottlenecks.
You can also create custom dashboards for monitoring your infrastructure.

SigNoz also provides detailed views of tracing data in the form of Flamegraphs and Gantt charts. Gantt charts make it easy to visualize your services and events in a parent-child relationship tree. You can easily figure out which events are causing latency in a request call. All of this comes out of the box with SigNoz.

Prometheus
Prometheus is an open-source monitoring tool that collects and stores metrics data in a time series database. It operates on a pull-based architecture, actively gathering time-series metrics from monitored services, ensuring real-time access to critical information.
Prometheus achieves this by scraping metrics data from HTTP endpoints and subsequently pushing it into a database designed with a multidimensional model, allowing for thorough contextual monitoring. This model is backed by a powerful query language, PromQL, enabling dynamic querying and aggregation of the collected metrics.
Additionally, Prometheus offers robust built-in alerting capabilities, service discovery mechanisms, and seamless integration with visualization tools like Grafana, providing a comprehensive and powerful monitoring solution.
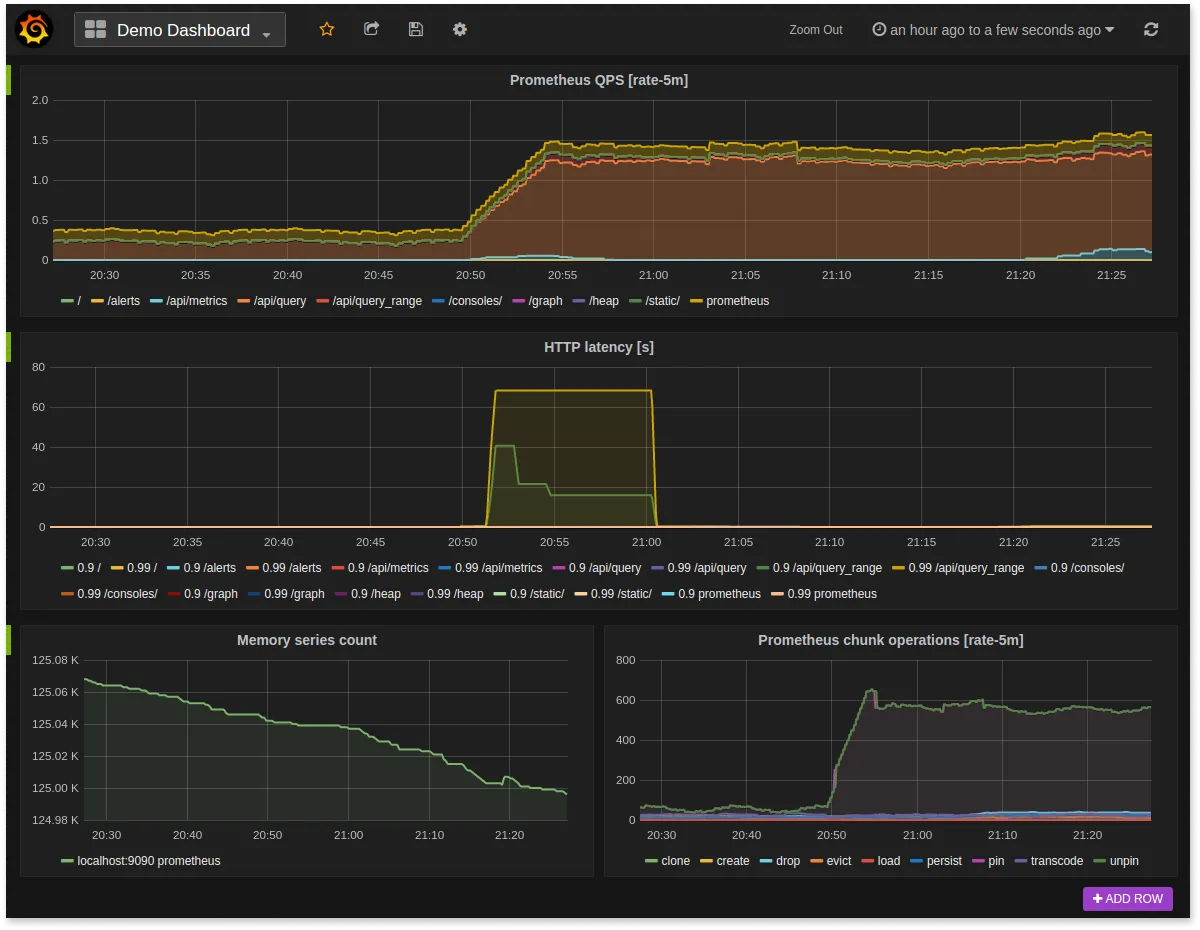
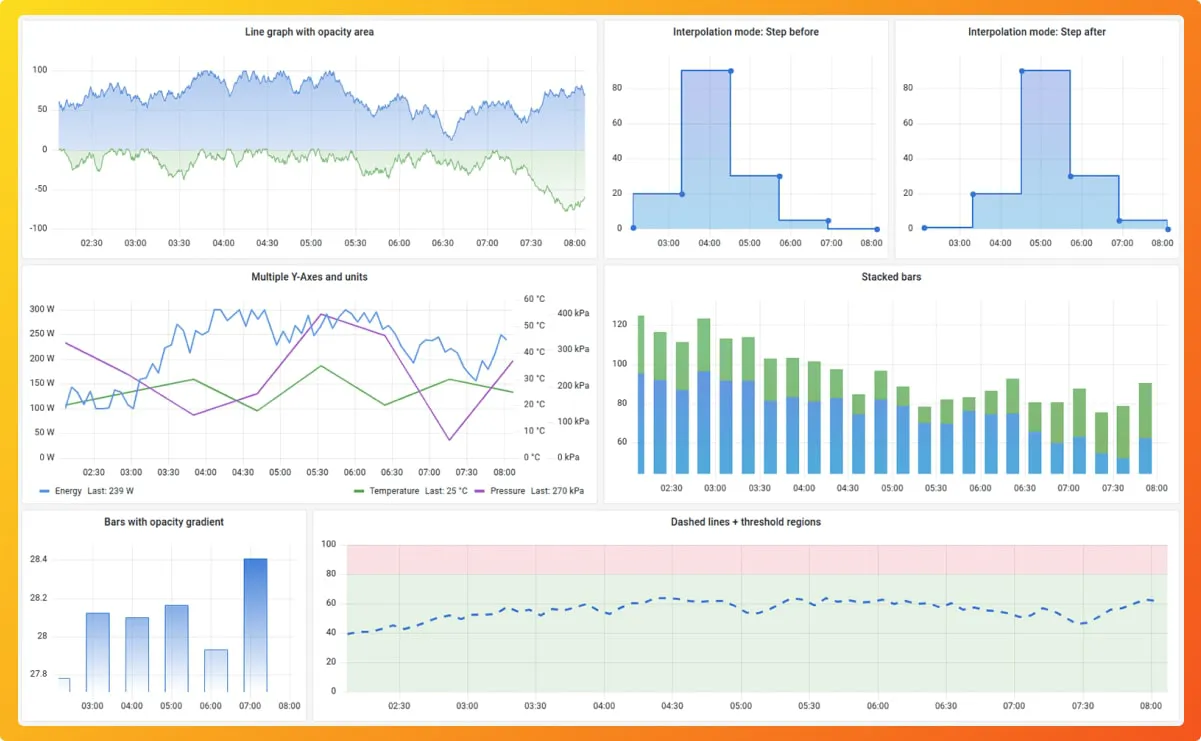
Grafana
Grafana is an open-source dashboard tool. The biggest feature of Grafana is that you can use it to combine different data sources and then visualize data in a central dashboard. It also comes with admin features for effective collaboration with the team.
Some of the key features of Grafana are:
- Flexible dashboards
Grafana provides a lot of panels that can be used for building dashboards. To build dashboards that suit your needs, you can choose from multiple chart types like heatmaps, histograms, pie charts, etc. - Plugins
Grafana provides an extensive set of plugins to extend Grafana capabilities. Some of the plugins that Grafana offers are:- Data Source plugins
- App plugins
- Panel Plugins
- Alerting system
Grafana provides a central UI to set and manage alerts with a central UI.
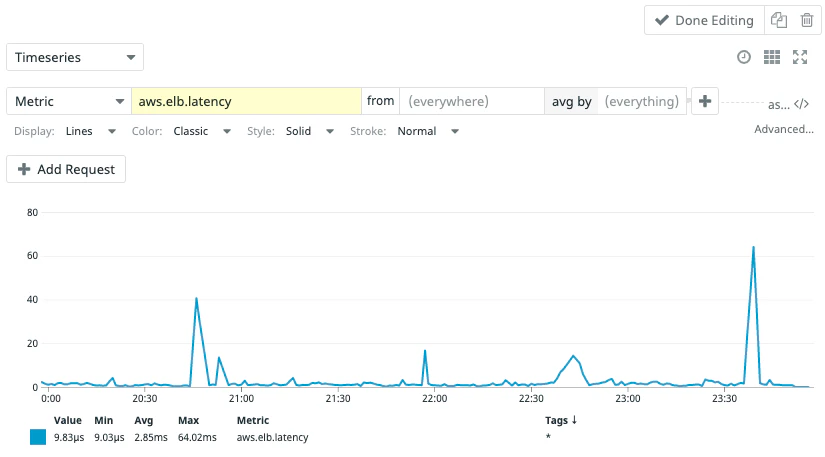
Datadog
Datadog is a cloud-based monitoring and analytics platform known for its capabilities in collecting and analyzing metrics, traces, and logs from a diverse range of services, applications, and cloud providers.
Datadog’s strength lies in delivering unified visibility across an organization's entire technological stack, empowering teams with profound insights and efficient troubleshooting. It supports real-time monitoring, advanced alerting, and customizable dashboards, making it particularly favored among DevOps teams and businesses operating in cloud-native environments.
It seamlessly integrates with various tools and services, ensuring a smooth incorporation into existing workflows. It also has a suite of products encompassing log management, infrastructure monitoring, APM, and security monitoring, catering to the diverse needs of organizations.
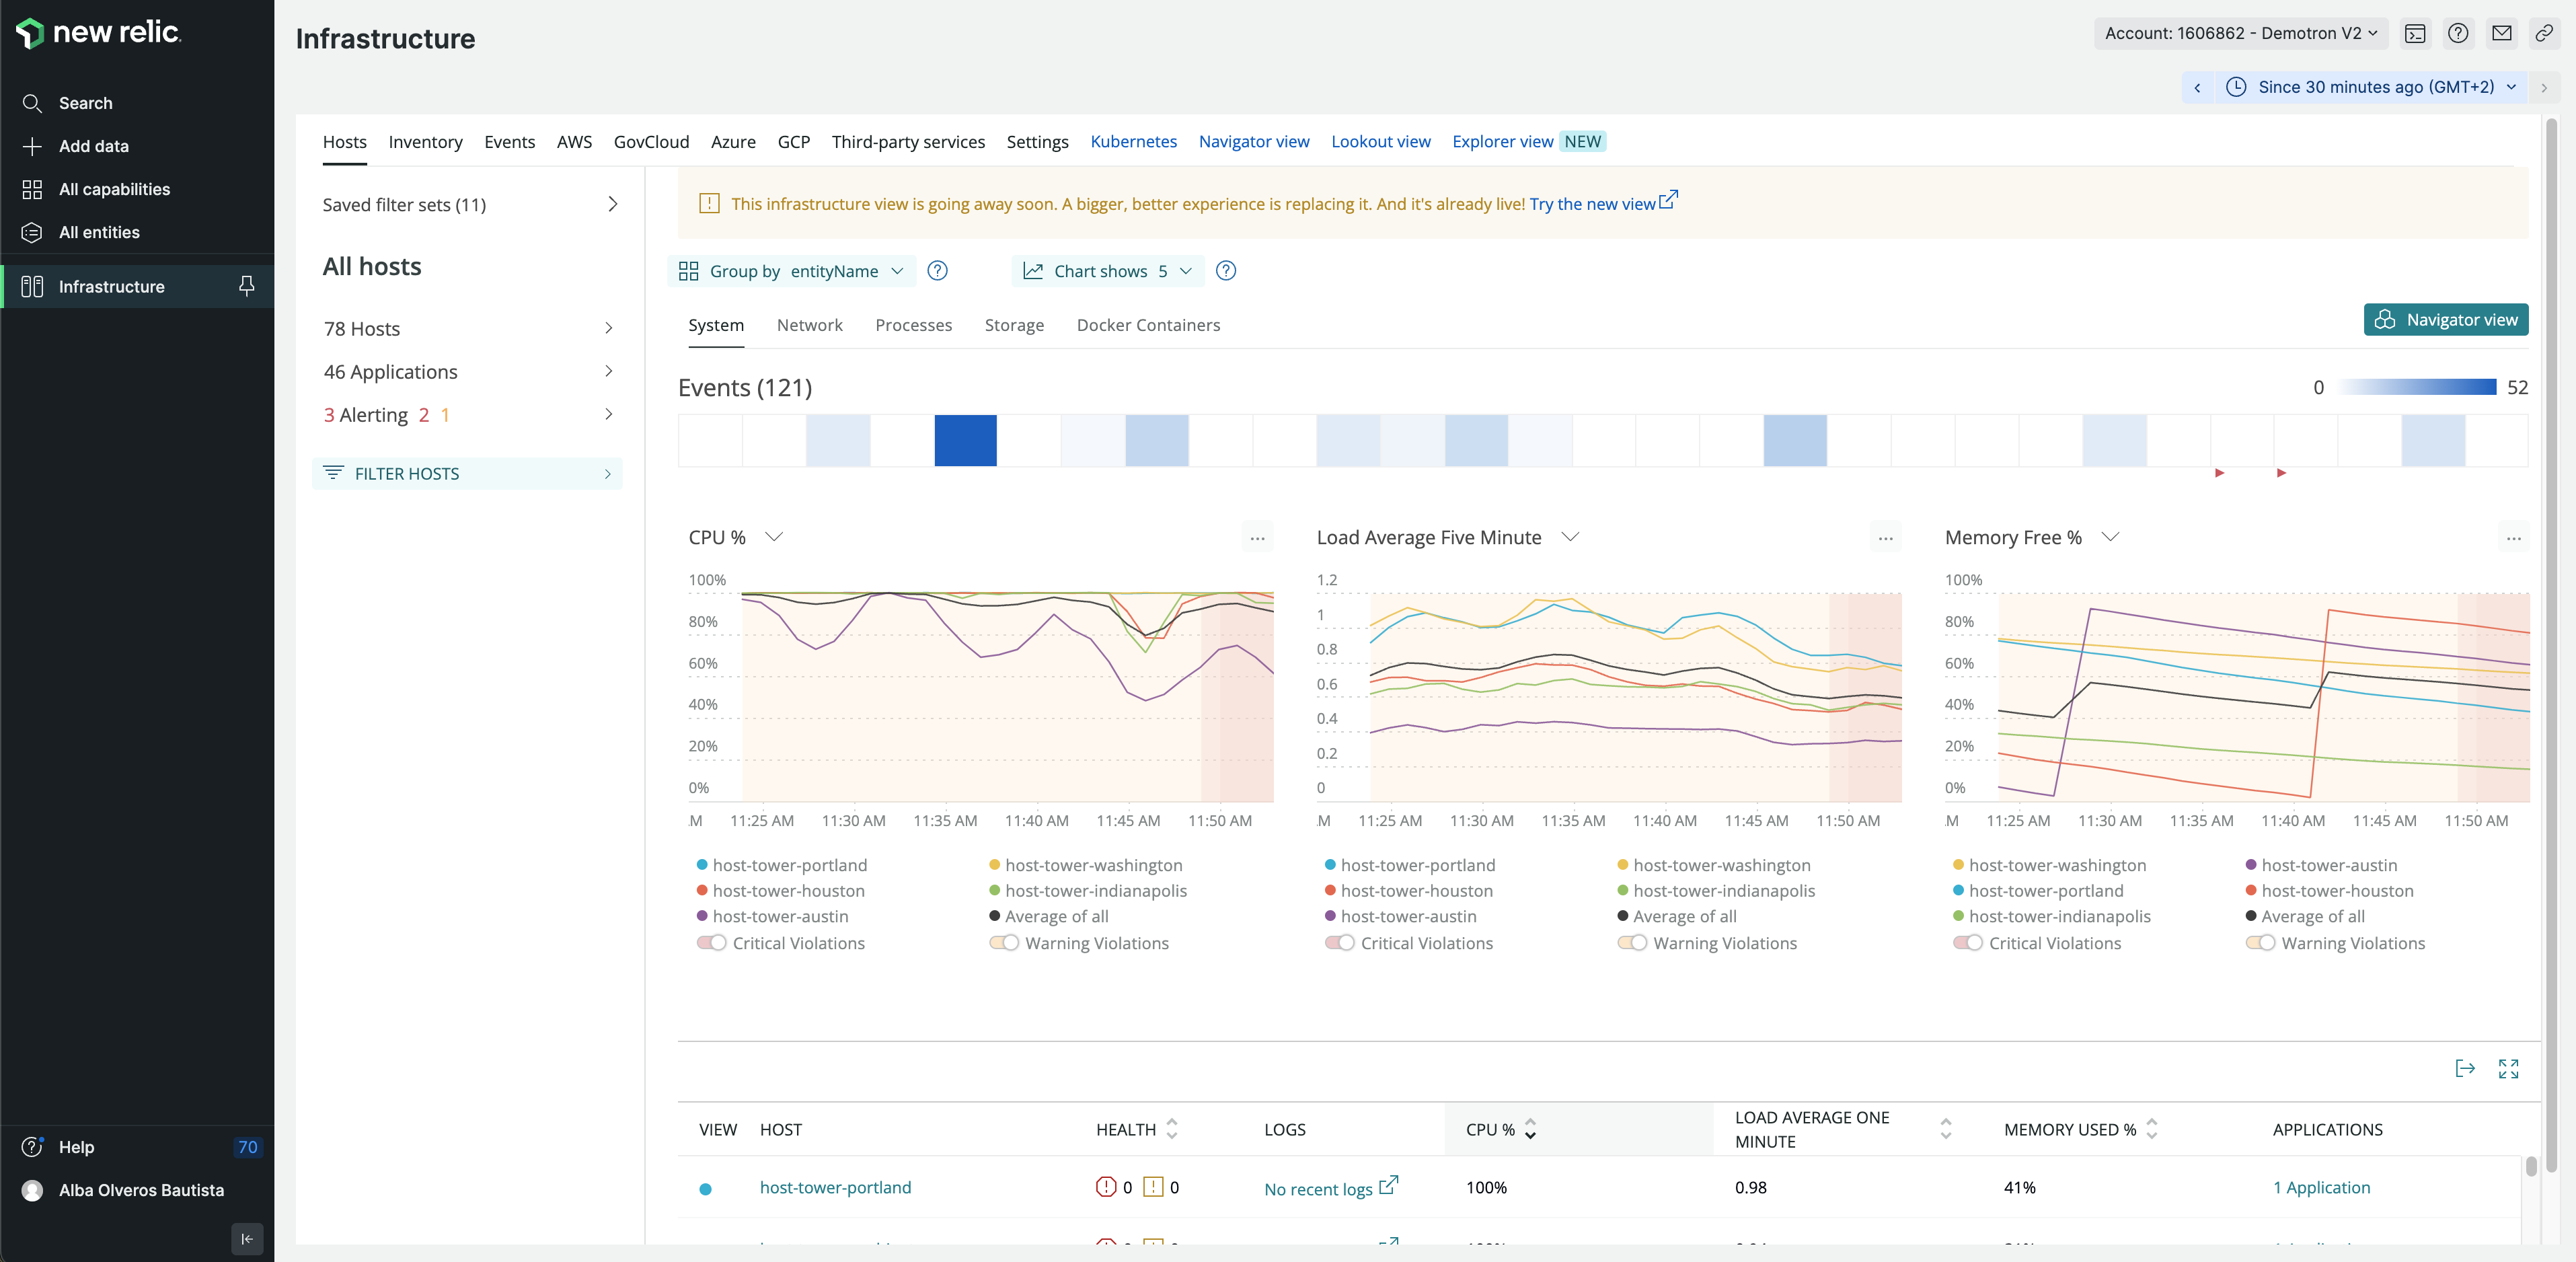
New Relic
New Relic is an observability platform widely known for its comprehensive monitoring and performance management capabilities. It specializes in providing end-to-end visibility into the performance of applications, infrastructure, and user experiences.
New Relic brings all your data together through its agents, integrations, and APIs, allowing for comprehensive data collection across your technology stacks. This data is then accessible through a unified user interface. Users can easily analyze this data to identify the root causes of problems and optimize their systems, whether by creating dashboards and charts or by using New Relic's powerful query language.
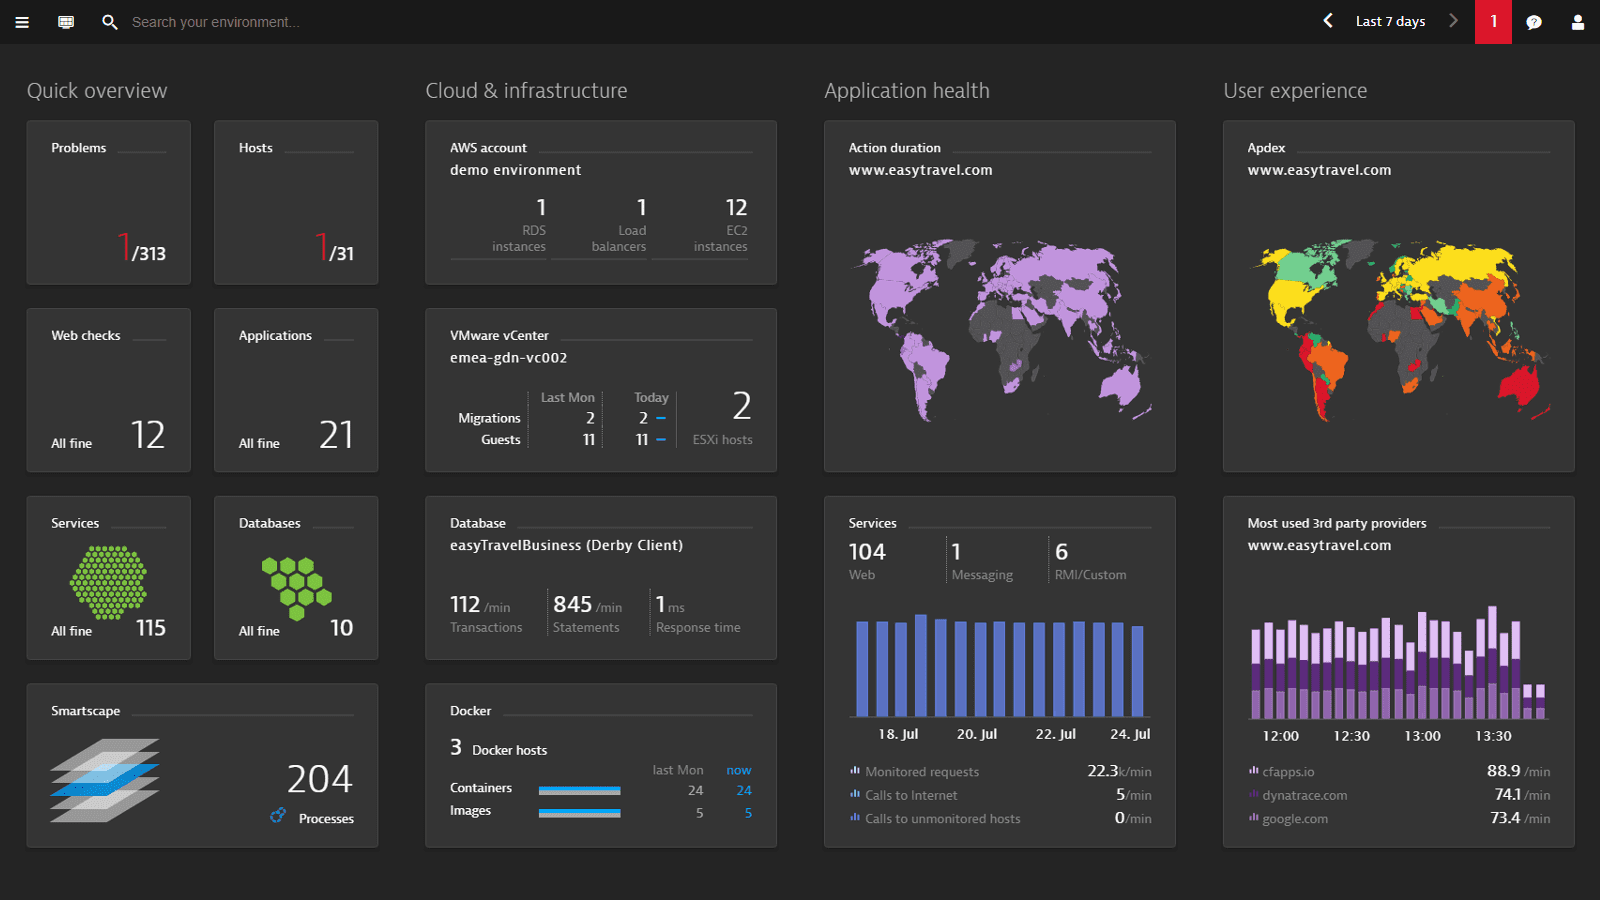
Dynatrace
Dynatrace is an AI-powered observability observability platform that specializes in delivering comprehensive visibility into application performance, infrastructure, and user experience.
With AI-driven insights, it automates issue detection and resolution, excelling in cloud-native environments. Dynatrace offers deep insights into performance and user interactions, along with robust support for various technologies. It consolidates observability, security, analytics, and automation solutions in a user-friendly interface.
The platform is adaptable to diverse use cases and is adept at enhancing organizational operations. It ensures consistent system availability and swiftly addresses performance issues.
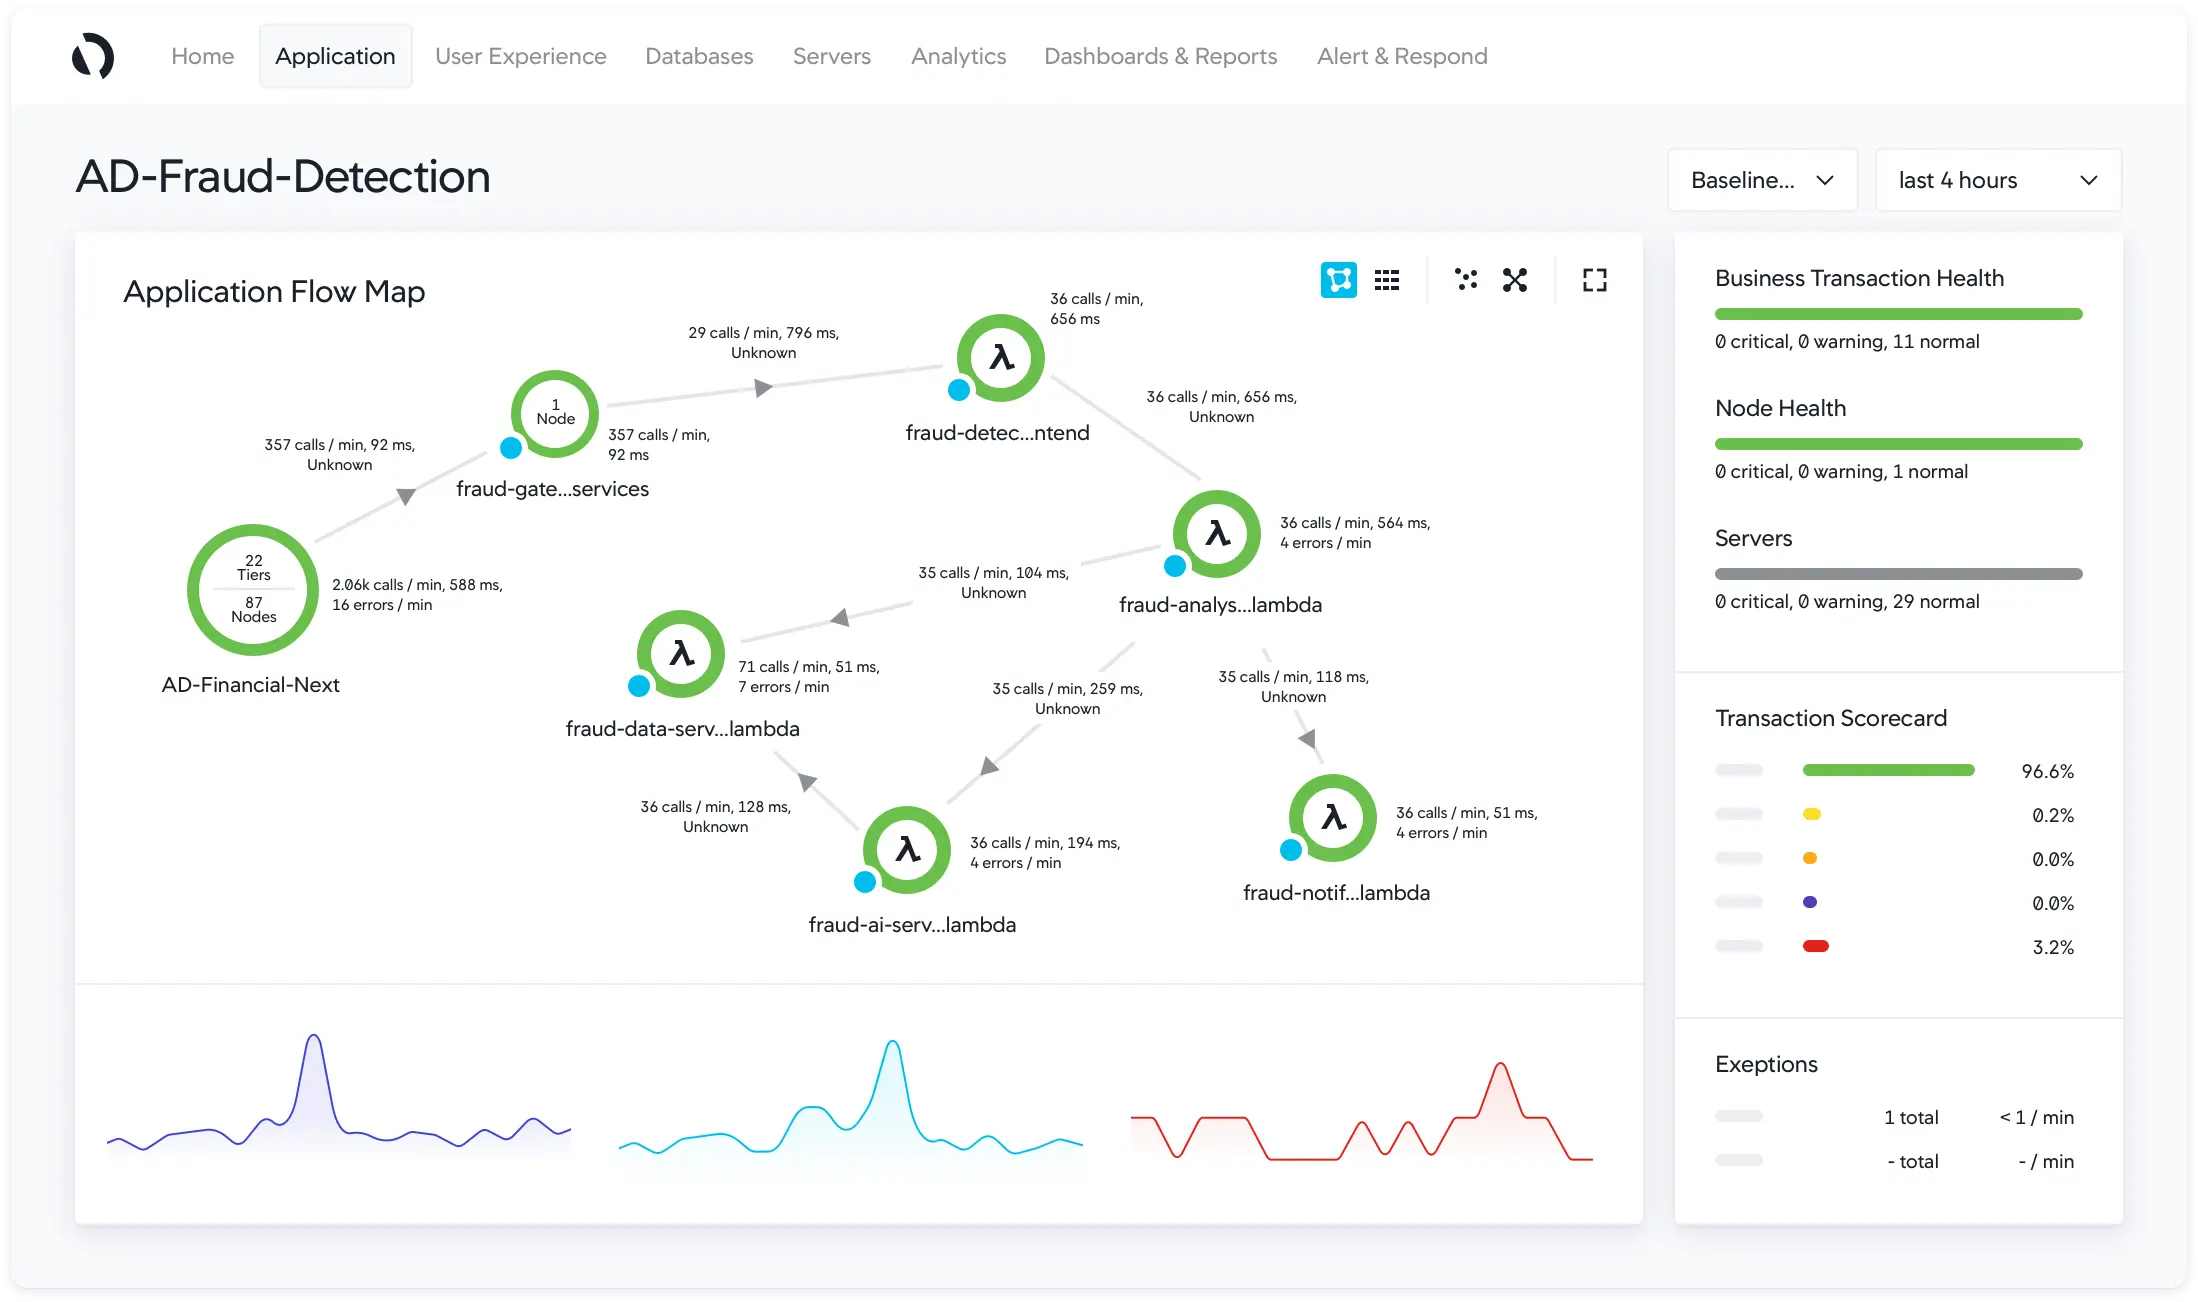
AppDynamics
AppDynamics is an enterprise Application Performance Management (APM) solution known for its comprehensive monitoring capabilities. It provides in-depth visibility into application performance and user experiences, offering code-level diagnostics, transaction tracing, and real-time insights. AppDynamics is now part of Cisco and is marketed as Splunk AppDynamics within Cisco's observability portfolio. You should factor that ownership and roadmap into any long-term evaluation.
AppDynamics is compatible with major technologies and can be deployed on-premise or as a Software-as-a-Service (SaaS) solution. It operates by installing an Agent in the application to collect performance metrics, which are then processed and presented via a web interface.
The platform stands out for its clean and modern UI, featuring heat maps for a clearer overview of metrics.
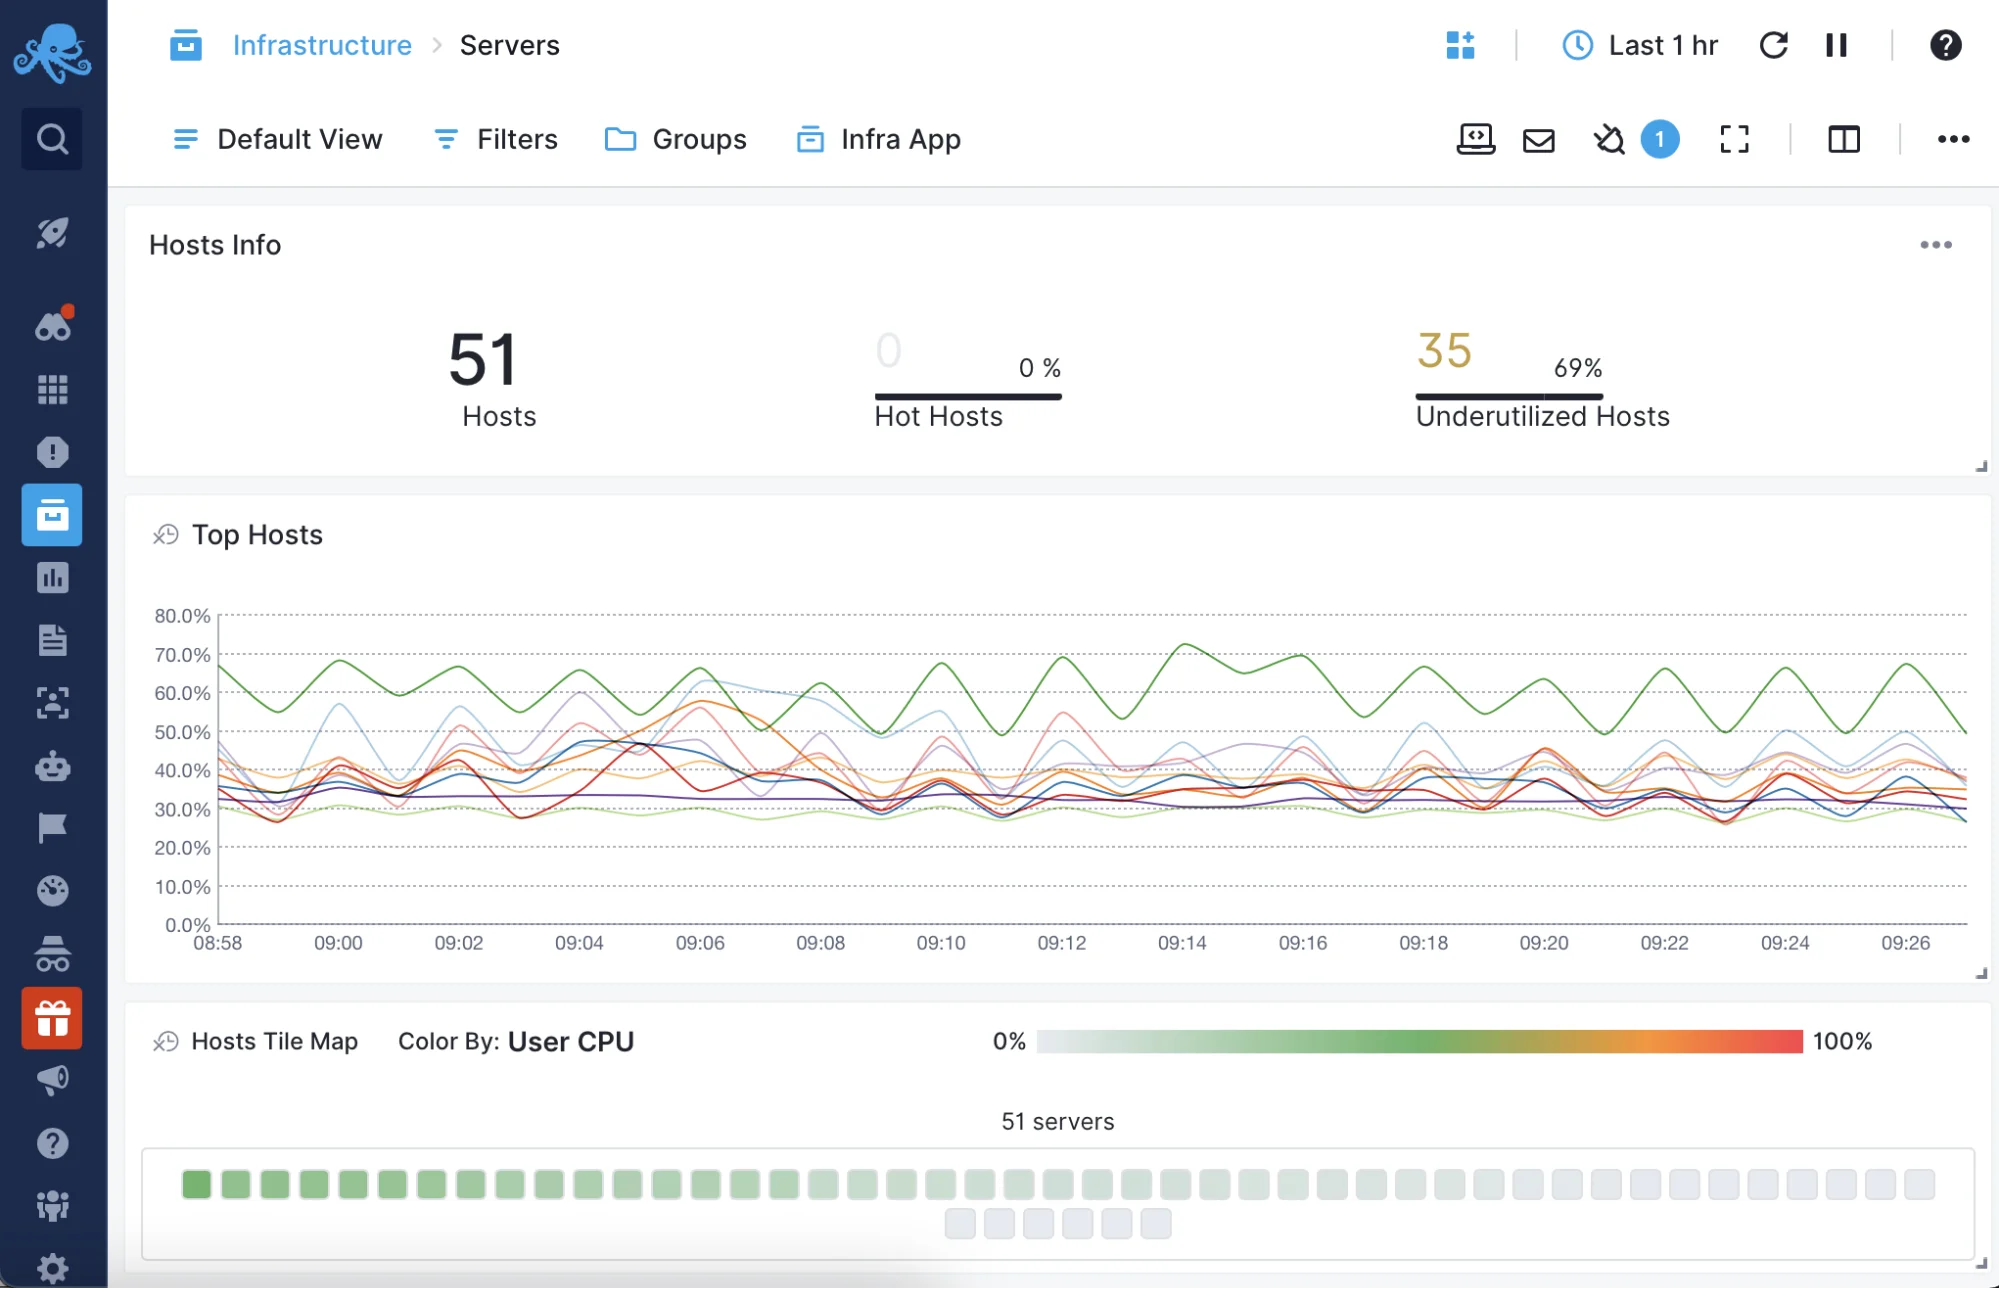
Sematext
Sematext is a comprehensive observability and log management solution that provides a holistic view of applications and infrastructure performance.
It can gather and assess logs and metrics from diverse sources, presenting a unified outlook on system well-being. Sematext also provides functionalities such as anomaly identification, customizable dashboards, and robust alerting systems. With its cloud-native design and compatibility with diverse technologies, it is well-suited for a broad spectrum of environments.
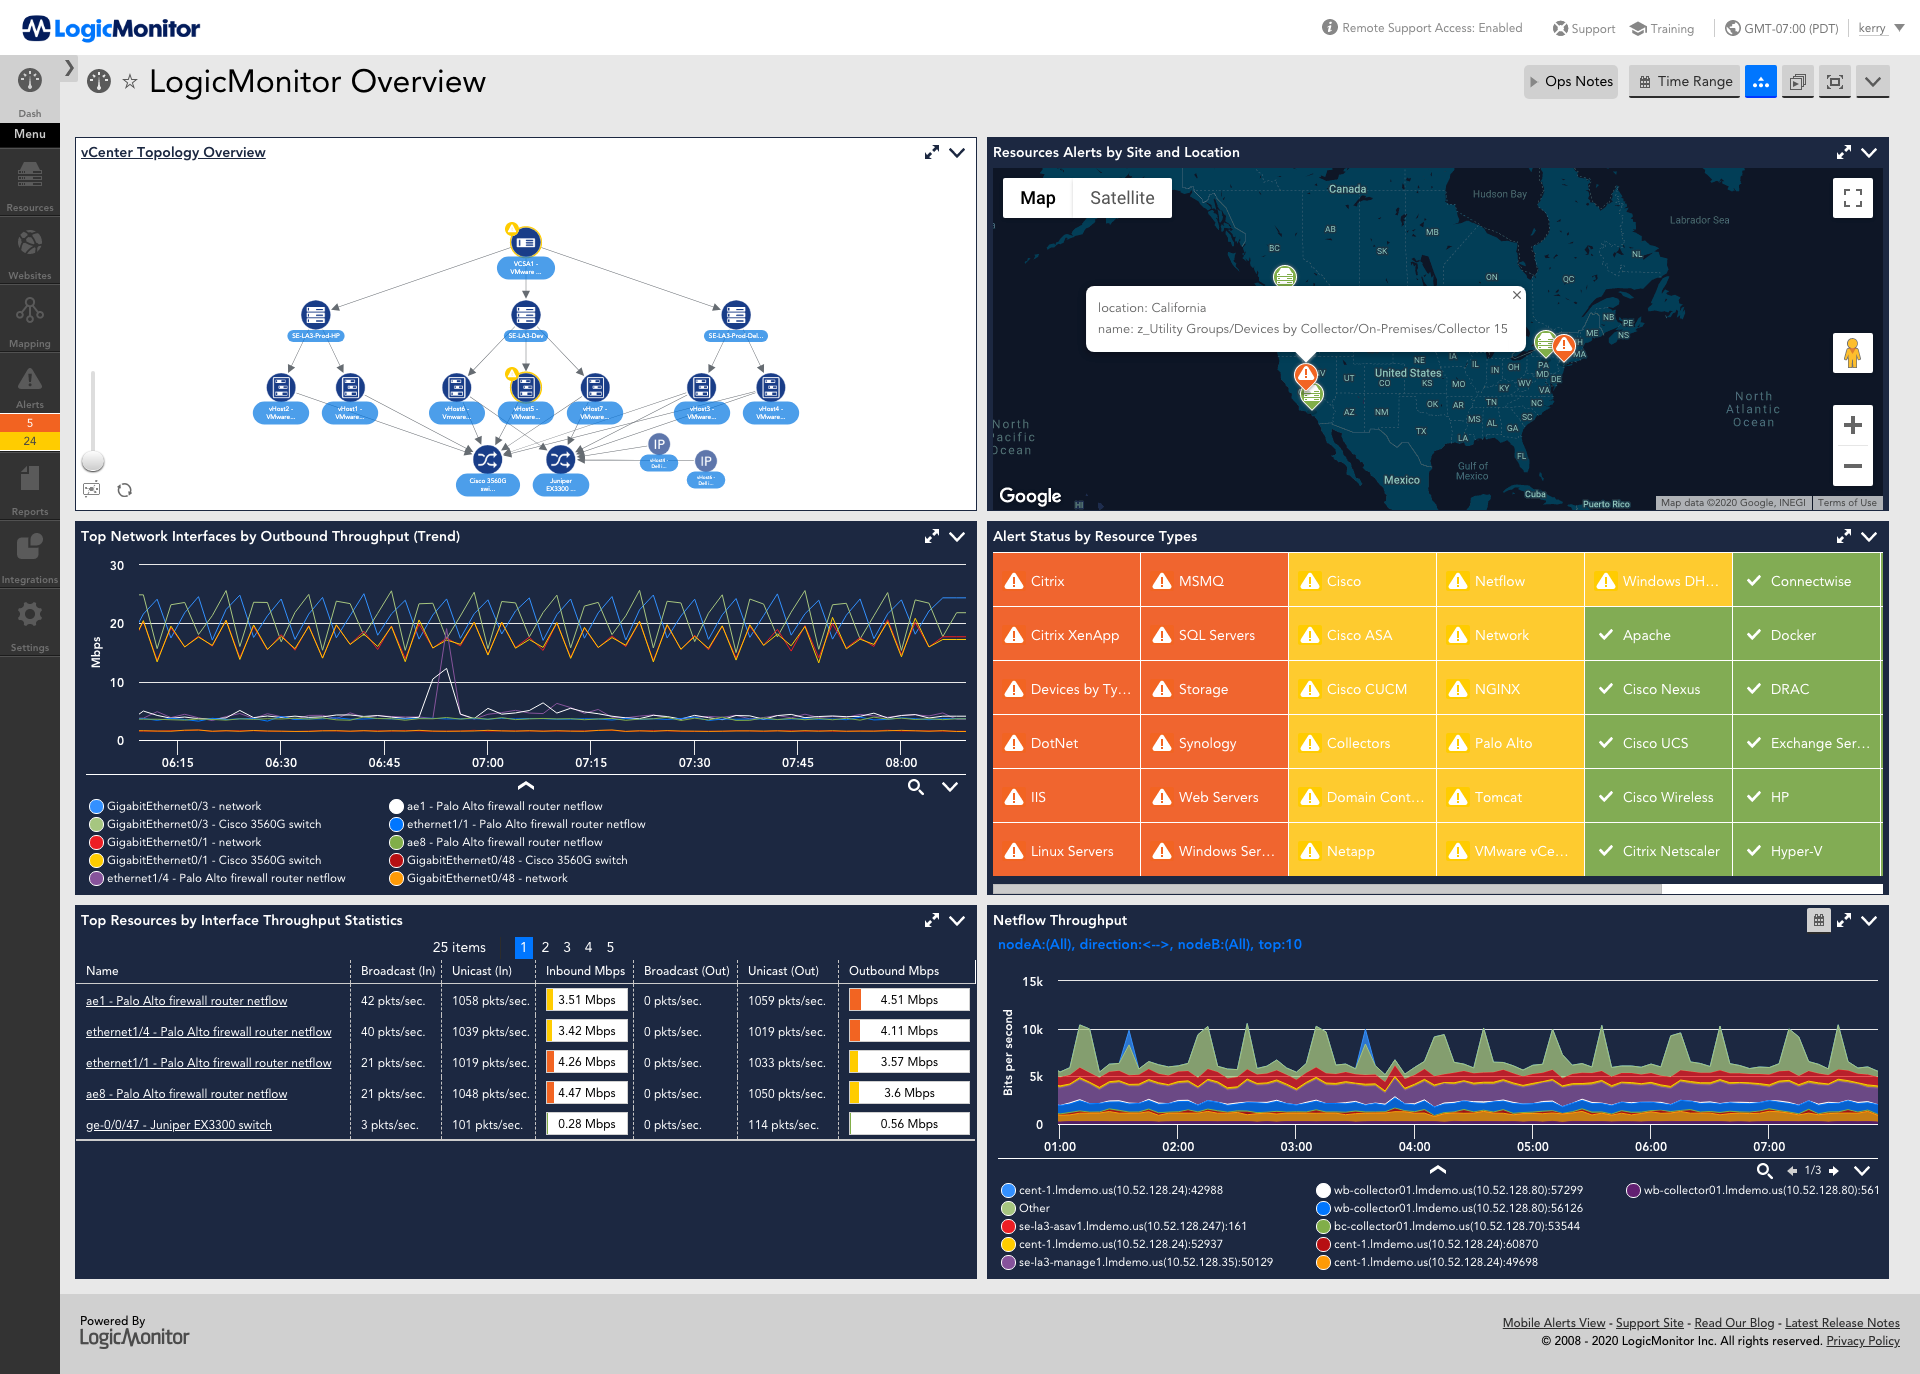
LogicMonitor
LogicMonitor is a full-stack monitoring platform known for its extensive observability capabilities. It offers complete visibility into the performance of applications, infrastructure, and cloud environments.
The platform offers a wide range of pre-configured integrations, making it easy to monitor various technologies and platforms. It provides real-time insights, customizable dashboards, and advanced alerting features for quick issue resolution. It also includes tools like anomaly detection and forecasting to tackle potential problems proactively.
Key Factors to Consider When Choosing a CloudWatch Alternative
When evaluating CloudWatch alternatives, consider these crucial factors:
- Scalability and Performance: Ensure the solution can handle your infrastructure's scale and complexity.
- Integration Capabilities: Look for compatibility with your existing tech stack and future technologies you might adopt.
- Cost Structure: Evaluate the pricing model and potential ROI, considering your specific usage patterns.
- Ease of Use: Consider the learning curve and how well it aligns with your team's skills.
- Multi-cloud Support: If you operate in multiple cloud environments, choose a solution that offers comprehensive coverage.
Why use a centralized monitoring tool instead of CloudWatch?
CloudWatch is a good monitoring solution while starting out in AWS. But as your application grows, you need a robust monitoring tool that gives more visibility into your application performance. A few things you should consider while selecting a monitoring tool to move out of CloudWatch:
- Multi-cloud capabilities
The CloudWatch alternative you choose should be able to monitor services in multi-cloud architecture. It should be a centralized monitoring system that can handle monitoring all components in your tech stack whether it’s a part of AWS or not. - Metrics, logs, and traces
Using a single tool for all your monitoring needs helps consolidate the engineering bandwidth you spend on monitoring. Using a single tool for logs, metrics, and traces also helps to correlate different signals for better insights. - Ease of shifting out
You should use a tool that is easy to get started with. A tool that helps in getting CloudWatch metrics easily will make the process of shifting out easier. - Pricing
Monitoring data is huge, and different vendors bill differently. A tool like Datadog can get costly very soon. You should choose a tool that provides good value for your money.
SigNoz is a great CloudWatch alternative that provides logs, metrics and traces under a single pane of glass. It comes with great out-of-the-box charts for application metrics, database calls, apdex, and much more. The log management in SigNoz is also highly scalable, with an advanced query builder to search and filter logs quickly.
SigNoz: An Open-Source Alternative Worth Considering
While exploring CloudWatch alternatives, it's worth considering SigNoz—an open-source, full-stack observability platform that's gaining traction in the DevOps community.
Key Features of SigNoz:
- Unified dashboard for metrics, traces, and logs
- Built on OpenTelemetry for standardized data collection
- Customizable dashboards and alerts
- Cost-effective, especially for large-scale deployments

SigNoz Cloud is the easiest way to run SigNoz. Sign up for a free account and get 30 days of unlimited access to all features.

You can also install and self-host SigNoz yourself since it is open-source. With 24,000+ GitHub stars, open-source SigNoz is loved by developers. Find the instructions to self-host SigNoz.
Best Practices for Implementing a New Monitoring Solution
When transitioning to a CloudWatch alternative, follow these best practices:
- Define Clear Objectives: Establish specific monitoring goals and KPIs before implementation.
- Plan Data Migration: Develop a strategy for migrating historical data and preserving critical insights.
- Start Small: Begin with non-critical systems to iron out any implementation issues.
- Train Your Team: Invest in training to ensure your team can leverage the new platform effectively.
- Iterate and Optimize: Regularly review and refine your monitoring setup to match evolving needs.
Key Takeaways
- CloudWatch alternatives offer broader integration capabilities and advanced features for comprehensive monitoring.
- Consider factors like scalability, cost, ease of use, and multi-cloud support when choosing an alternative.
- Open-source options like Prometheus and Grafana provide flexibility but may require more setup and management.
- Enterprise solutions like Datadog, New Relic, and Dynatrace offer comprehensive features at a higher price point.
- SigNoz presents an open-source alternative with full-stack observability and cost-effective scaling.
- Implement new monitoring solutions gradually, focusing on clear objectives and team training.
FAQs
What are the main limitations of AWS CloudWatch?
CloudWatch's primary limitations include:
- Limited support for non-AWS services
- Basic visualization capabilities
- Potentially high costs for high-cardinality metrics
- Lack of advanced APM and distributed tracing features
How do CloudWatch alternatives handle multi-cloud environments?
Many CloudWatch alternatives, such as SigNoz, Datadog and Dynatrace, offer native integrations with multiple cloud providers. They provide unified dashboards and consistent monitoring across diverse cloud environments, enabling better visibility and management of multi-cloud infrastructures.
Can I use multiple monitoring tools alongside CloudWatch?
Yes, it's common to use multiple monitoring tools to address different needs. For example, you might use CloudWatch for basic AWS resource monitoring while employing a more specialized tool like SigNoz, New Relic for in-depth application performance monitoring. However, be mindful of potential overlap and added complexity.
What are the cost implications of switching from CloudWatch to an alternative?
Cost implications vary depending on the chosen alternative and your specific use case. While some alternatives may have higher upfront costs, they often provide better cost-efficiency at scale, especially for high-cardinality metrics. Open-source solutions like Prometheus can significantly reduce costs but may require more internal resources for management and maintenance.
What are the key differences between CloudWatch and its alternatives?
CloudWatch is primarily focused on AWS services, while alternatives often offer broader support for multi-cloud environments and non-AWS services. Many alternatives also provide more advanced features for application performance monitoring, distributed tracing, and customizable dashboards.
How do CloudWatch alternatives handle cost management for high-cardinality metrics?
Many CloudWatch alternatives offer more flexible pricing models and optimized data storage for high-cardinality metrics. Some, like SigNoz, provide cost-effective solutions for large-scale deployments, while others may offer tiered pricing based on data volume and retention.
Can CloudWatch alternatives integrate with existing AWS services?
Yes, most CloudWatch alternatives offer integrations with AWS services. They typically provide plugins or agents that can collect data from AWS resources, allowing you to monitor your AWS infrastructure alongside other environments or services.
How do open-source alternatives compare to commercial solutions in terms of features and support?
Open-source alternatives like Prometheus and Grafana often offer comparable features to commercial solutions but may require more setup and maintenance. Commercial solutions typically provide more out-of-the-box integrations, dedicated support, and advanced features like AI-driven insights.
What considerations should be made when transitioning from CloudWatch to an alternative solution?
When transitioning, consider factors such as data migration, learning curve for your team, integration with existing tools, and potential changes to your monitoring workflows. It's often beneficial to run both systems in parallel during the transition to ensure continuity and validate the new solution's effectiveness.
Related Content
