A sleek new trace filter and trace details tab, 50+ contributors in our tribe - SigNal 10
One who moves the hill sets off by taking away the rocks.
This is our 10th monthly update, and looking back at it, I can’t help feeling proud of our consistent efforts. Numerous releases, GitHub issues, sprints, and standups have brought us here. And it’s incredible to see what small teams with purpose can build with a consistent effort.
Without further ado, let’s see what our 10th edition has to offer.
What we shipped?
The major part of our shipping code last month involved our Traces tab. Users can now analyze their tracing data across microservices, endpoints, HTTP methods, status codes, etc.
Latest SigNoz release
v0.7.1
The release also comes with our updated Trace Detail page. Users can use the Trace Detail page to see how a specific event fits into the overall user request with the help of Flamegraphs and Gantt charts. The Trace Detail page makes it very convenient for users to visualize how the requests perform in a microservices-based application.
Let’s give you a brief walkthrough of the pages.
The Traces tab comes with many advanced useful filters now. Some key filters include duration, service name, status, HTTP code, host, and URL. You can utilize these filters to analyze your tracing data.
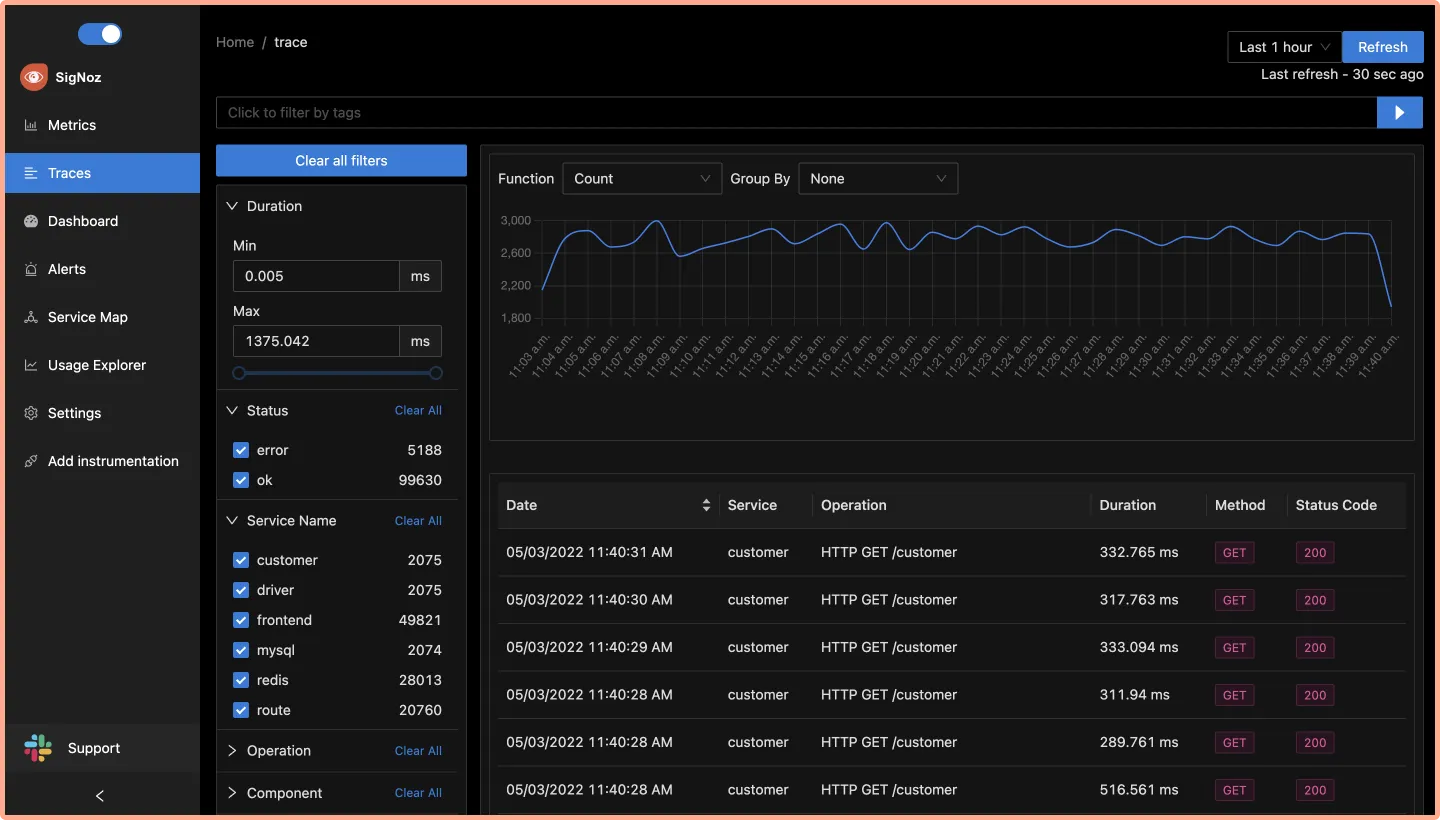
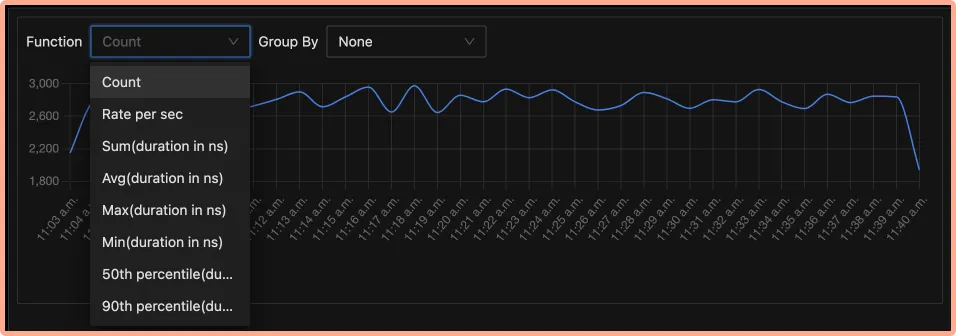
You can then run aggregates on the traces data to figure out bottlenecks.
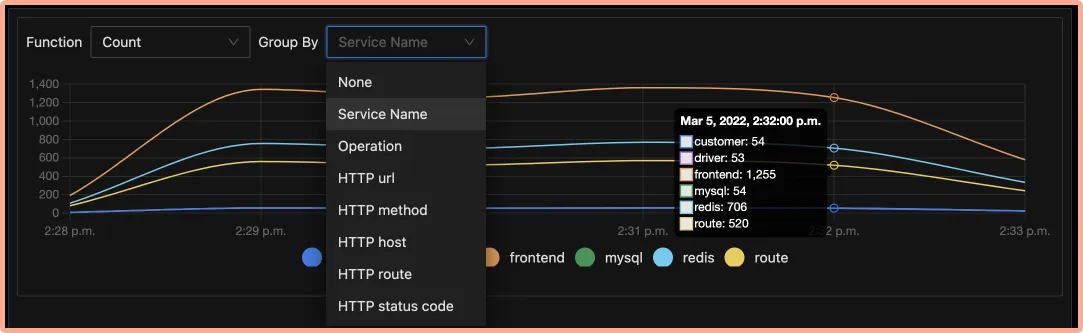
You can also see these aggregates in more granular detail by grouping them by service name, operation, HTTP URL, HTTP method, etc.
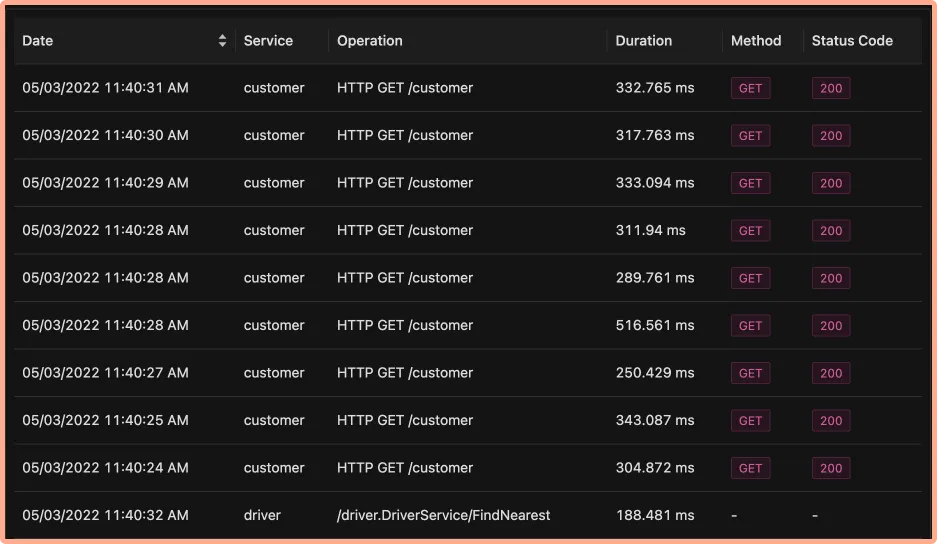
The events table lists out all the events that occurred during a given duration. If you want to drill down and see how a specific event performed as part of an entire request, you can click on it and it will take you to our new Traces Detail page.
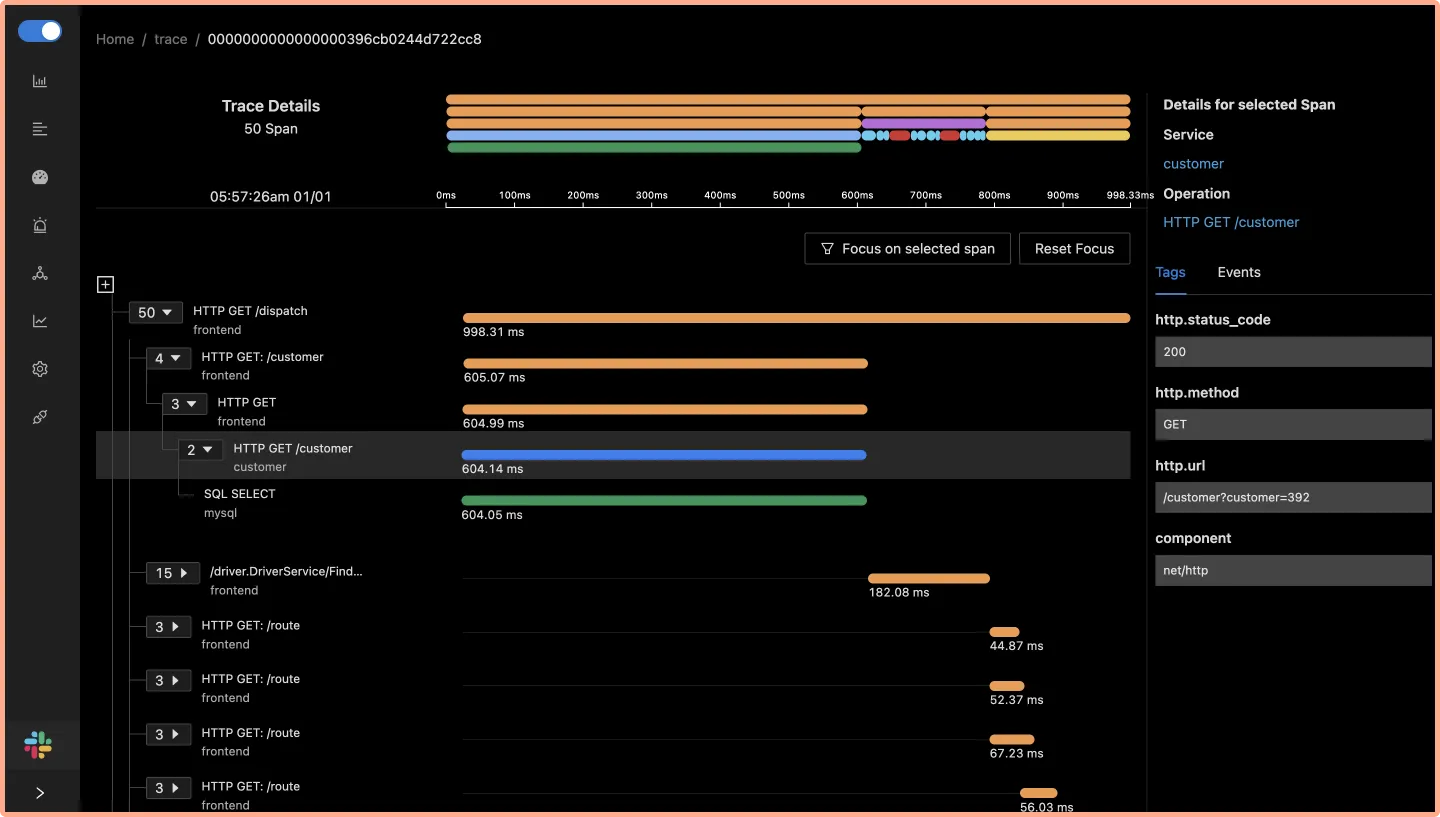
We are most excited about the new Trace Detail page. Using this page, our users can utilize the true power of distributed tracing. You can see how a specific event performed as part of an entire request.
The Flamegraph and the Gantt chart make it easy to deconstruct a trace into its components. Moreover, you can also see contextual data for an event with tags and events in the rightmost panel.
If you wish to check out our newest release, just follow the installation guide from our documentation.
Featured issue
Enable S3 storage for ClickHouse
Monitoring data is often huge, and our users need solutions for long-term data retention. Our team will be working on enabling AWS S3 storage for ClickHouse, our database. This will enable our users to run SigNoz without worrying about disk usage.
If you know about other solutions for data retention or have experience working with S3, feel free to comment on this Github issue.
What's upcoming?
Login, Auth, and Org management
The next important feature in our product roadmap involves user login & authentication and org management. Here are some key features that our team will be working on in the upcoming sprints:
- User login with email authentication
- Invite team members to the same instance of SigNoz
- Login, password setting for team members
- Admin and guest access
This feature has been requested by a lot of our users and it will enable teams to collaborate better with SigNoz. In the long run, we want to make SigNoz a collaborative tool for engineering teams that enables them to take quick actions. And this is the first step in that direction.
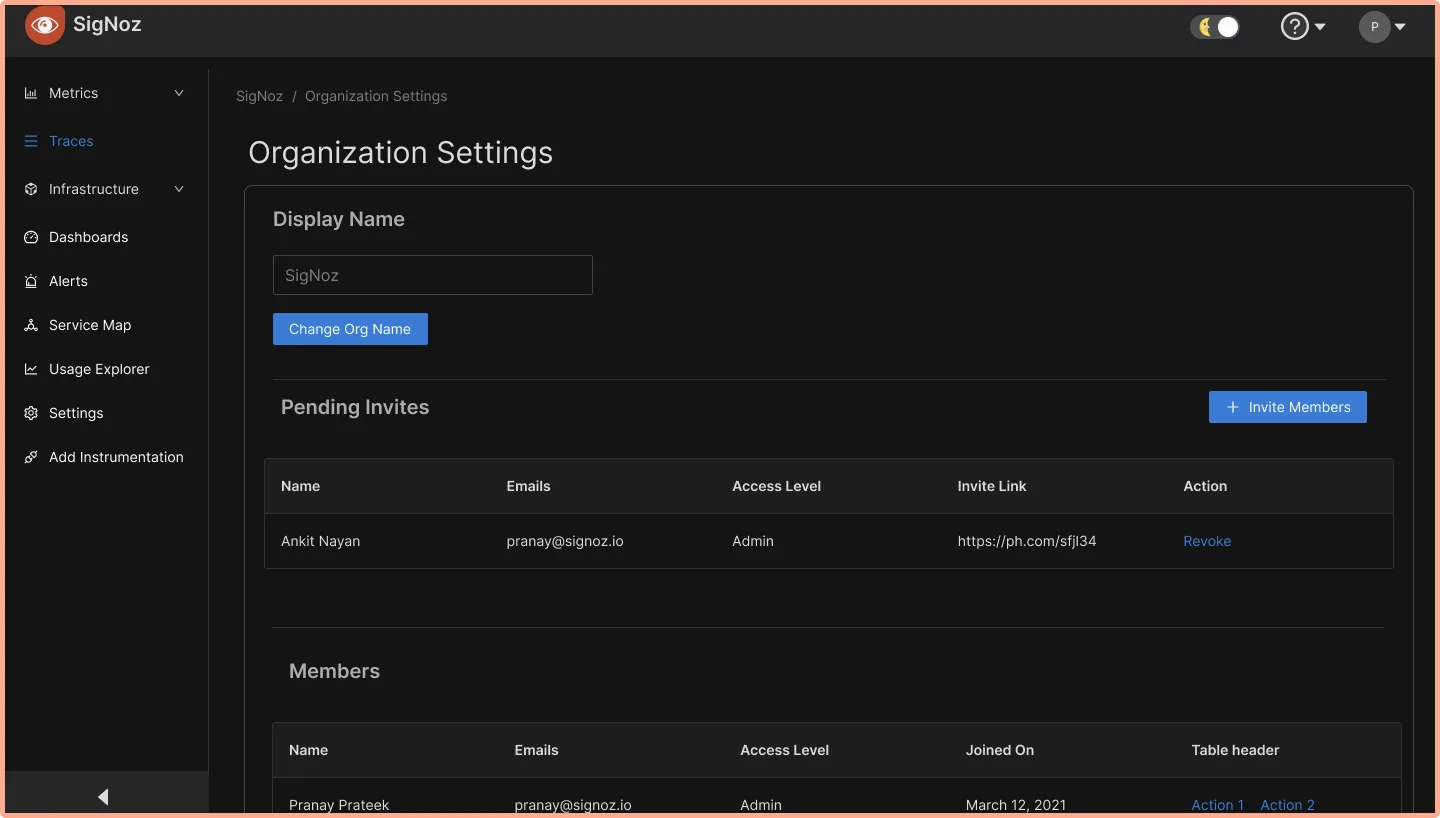
A sneak peek into the design of our org management 👇
SigNoz News
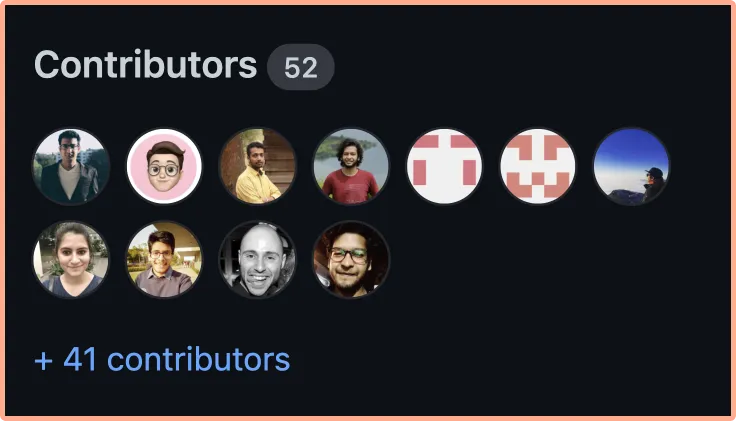
50+ contributors in our contributor's tribe
SigNoz contributor tribe has now more than 50 developers. Devs from all across the world - India, Israel, France, Philippines, Sweden, Germany, and many other countries have made commits to our GitHub repo to make SigNoz better than it was when they found it.
We are thankful to each one of you, and we're very excited about what the future holds for SigNoz in the open-source ecosystem.
Youtube stream with Swyx
Our founder, Pranay did a youtube stream with Swyx on building a community for open-source projects. Swyx is a GitHub star and has worked on developer experience for Netlify, Amazon Web Services, and now Temporal.
Community is core to open-source products, and Swyx shared some amazing insights from his experience of building multiple tech-focused communities. You can check out the entire stream here:
Contributor Spotlight👩🏻💻
A string of new contributors joined us over our last few releases. We want to thank these amazing contributors who made SigNoz better with their contributions. 🤗

SigNoz, ex-Razorpay

India

India

Nice, France

Sweden

India

India

India

India
From our blog
Implementing distributed tracing in a nodejs application
In modern microservices-based applications, it is difficult to understand how requests are performing across multiple services, infrastructure, and protocols. As companies began moving to distributed systems, they realized they needed a way to track requests in their entirety for debugging applications.
Distributed tracing is a technology that was born out of this need. Let’s have a brief overview of distributed tracing. Read how to implement distributed tracing in nodejs application having three microservices👇
Implementing distributed tracing in a nodejs application
Thank you for taking out the time to read this issue :) If you have any feedback or want any changes with the format, please create an issue.
We also have an active slack community. Feel free to join in and say hi! 👋