Ability to import Grafana dashboards (deprecated), Alerts based on ClickHouse queries and more advanced features - SigNal 19
“He who has a why to live for can bear almost any how.” - Friedrich Nietzsche
Welcome back to our monthly product updates - SigNal! Last month, the SigNoz team shipped many advanced features that will help our users take observability to the next level.

With our newly shipped alerts based on ClickHouse queries, users will have the flexibility to set alerts on all three telemetry signals - logs, metrics, and traces. We made two important releases, presented a talk at one of the top DevOps conferences, and made plans for upcoming releases.
Let us see what humans of SigNoz were up to in the month of November 2022!
What we shipped?
Last month, our team shipped some advanced features which would help engineering teams set up more robust monitoring.
Latest Release v0.11.4Support for ClickHouse Queries in Alerts Builder
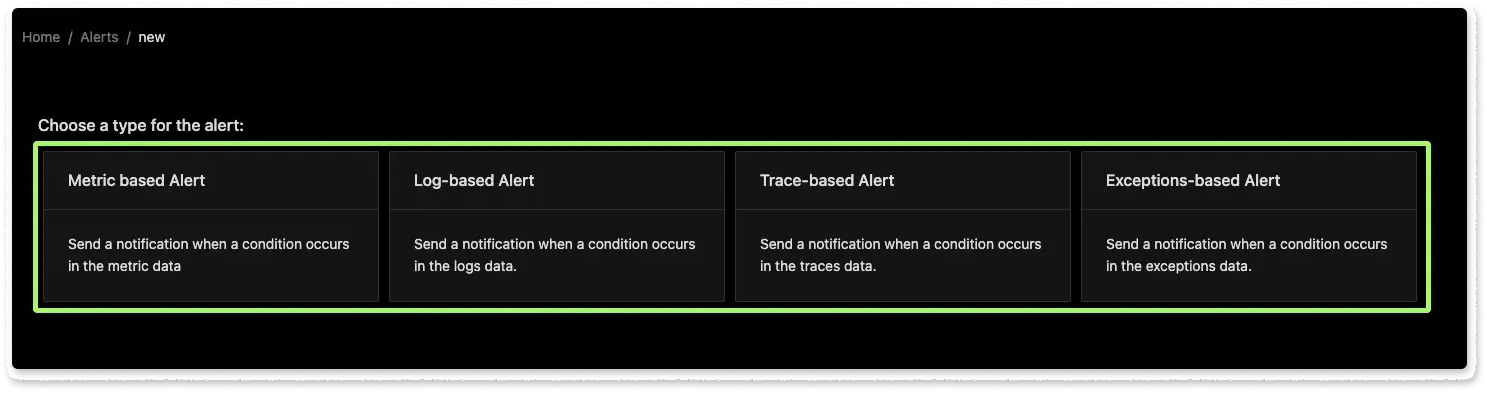
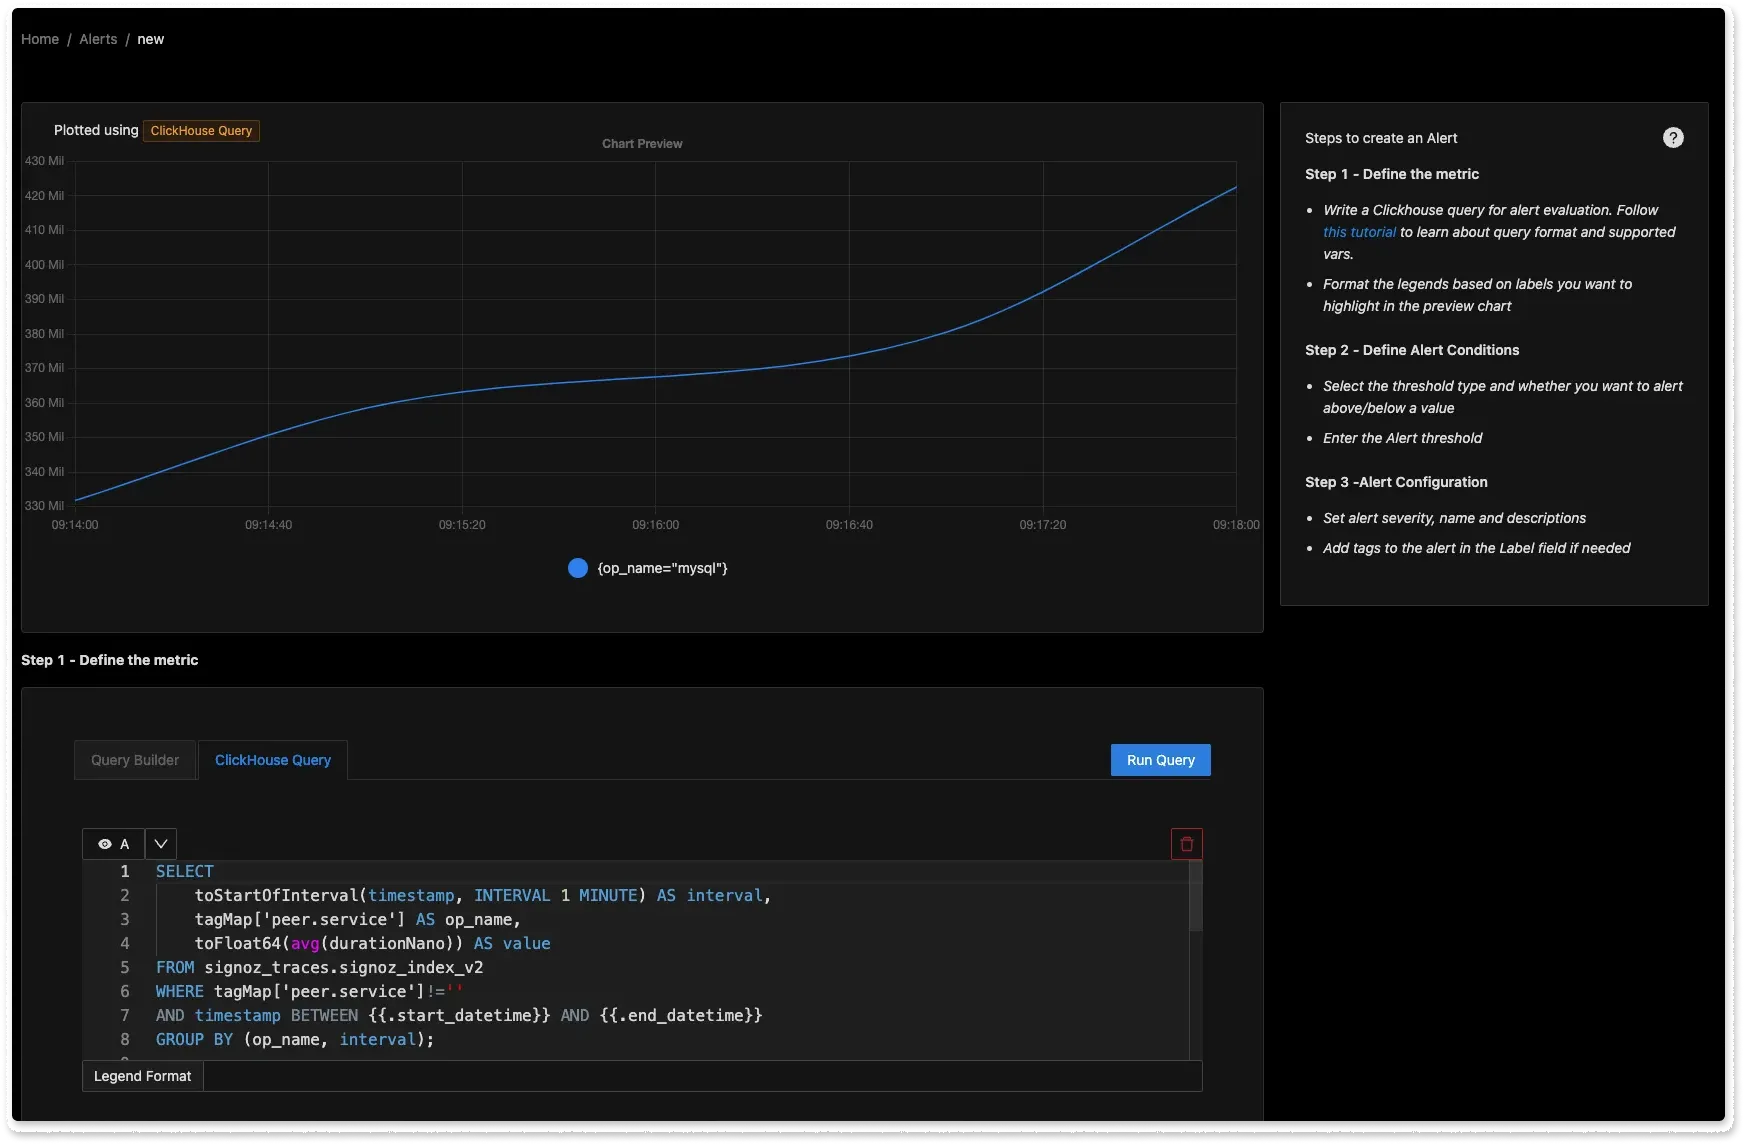
We have enabled ClickHouse queries in the Alerts Builder tab. We have learned from our users that each business can have its own specific needs when it comes to software environments. Our users can now set alerts on specific telemetry signals. When you click on creating a new alert, you will be directed to choose the telemetry signal you want to create an alert on.
And that’s not all. We have also enabled alerts based on exceptions. Now you can stay on top of exceptions taking place in your application.
It is best to provide flexibility to our users on what they want to do with their data, and with native ClickHouse queries in the Alerts builder, you will be able to set alerts on things that matter to you!
Powerful ClickHouse Queries for plotting deeper metrics
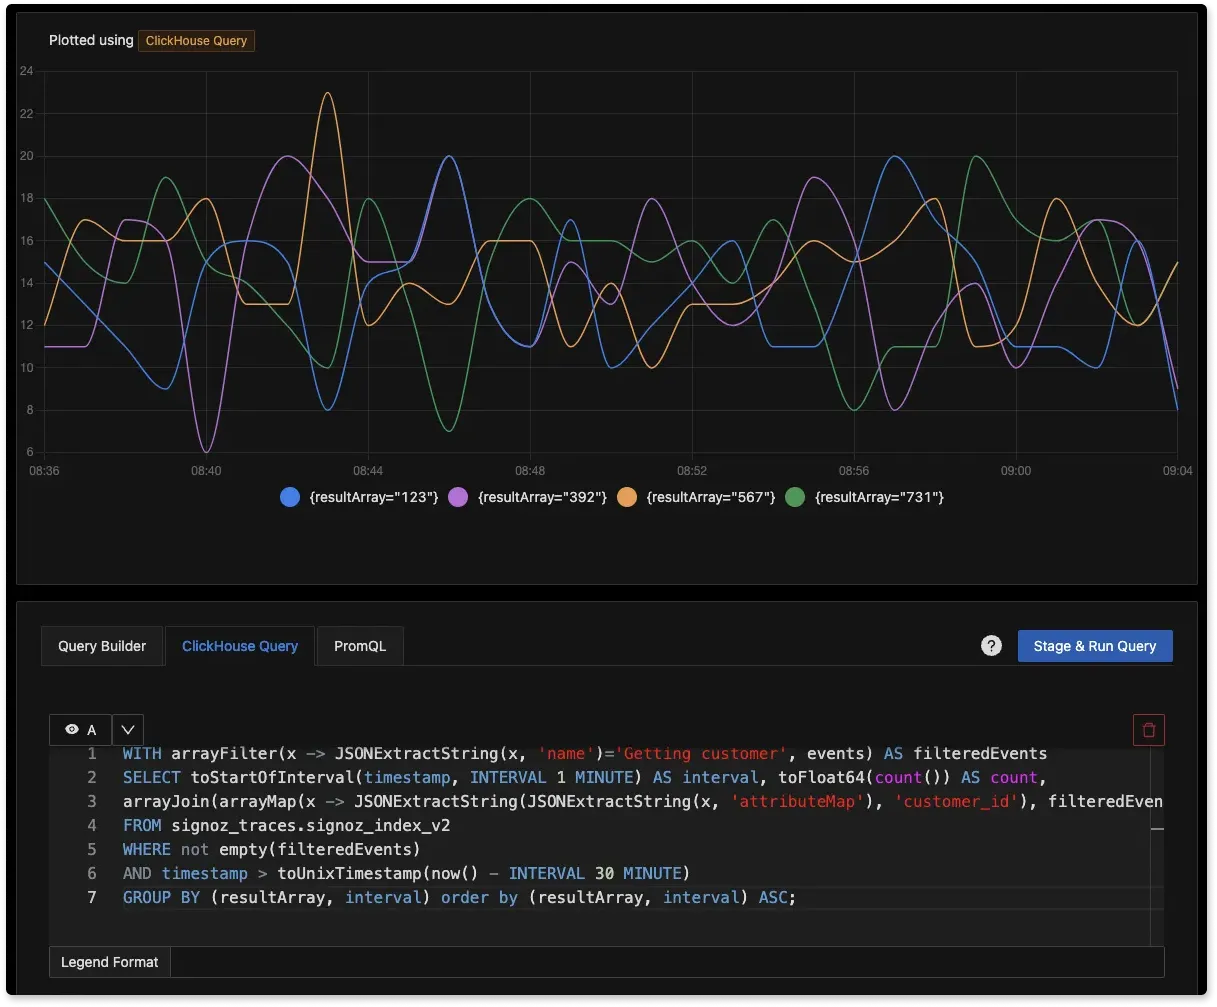
Now, you can write powerful ClickHouse queries to plot useful charts for your application. OpenTelemetry instrumentation lets you capture telemetry data that is rich with context. We have enabled native ClickHouse queries in our Dashboards tab to let you utilize the full potential of this data.
An example of a ClickHouse query:
SELECT toStartOfInterval(timestamp, INTERVAL 1 MINUTE) AS interval,
resource_string_service$$name AS service,
attributes_string['http.method'] AS method,
toFloat64(avg(durationNano)) AS value
FROM signoz_traces.distributed_signoz_index_v3
WHERE resource_string_service$$name!=''
AND timestamp > now() - INTERVAL 30 MINUTE
AND ts_bucket_start >= toUInt64(toUnixTimestamp(now() - toIntervalMinute(30))) - 1800
GROUP BY (service, method, interval) order by (service, method, interval) ASC;
With the above query, you can GroupBy a tag/attribute in distributed tracing data. Read our docs for more sample ClickHouse queries.
Importing Grafana Dashboards
We have enabled importing Grafana dashboards to make it easier for users who want to shift from Grafana to SigNoz. It currently supports importing via JSON and Prometheus as a supported data source.
The Grafana dashboard import feature mentioned in this blog was introduced in version v0.11.4. However, this feature has been deprecated and is no longer supported.
Explore the list of pre-built dashboards here. If you need something specific, you can request a new dashboard.
Feature Flagging
You can now customize the usage of SigNoz to optimize storage space. For example, SigNoz creates a materialized view table to optimize sorting spans/traces by timestamp. This feature is enabled by default, and you can turn it off using the TIMESTAMP_SORT_FEATURE flag to optimize storage space.
UX and UI enhancements
We continuously interact with our users on how to improve our user experience. With user feedback, we have made multiple UI/UX improvements in our recent releases.
We have introduced help tooltips that will guide a user on a production setup. Users can also jump to creating GitHub issues directly from our dashboard.
We have added a search filter on the exceptions page to help our users narrow down the required exceptions quickly.
We urge our users to make GitHub issues of any improvements they identify and want us to take it up.
What’s upcoming?
Our team is working on improving the capabilities of SigNoz as a one-stop observability solution significantly. On that note, our coming sprints will focus on the features mentioned below.
Metrics from Logs
Many users send logs along with tags, and they want to create metrics from them. We want to enable our users to write queries on their log data and generate metrics from them so that they can draw insights quickly.
Correlation between Three Telemetry Signals
We aim to provide the most meaningful interactions between the three telemetry signals - logs, metrics, and traces for our users. We believe observability is not just monitoring telemetry signals but rather having meaningful contextual information at your fingertips.
We would love to learn from you how we can do this better. Feel free to comment on the following GitHub issues.
Featured Issue
Metrics to Logs correlation
We want SigNoz to be the best one-stop open source observability solution. A key part of that mission is to have a robust correlation of telemetry signals. Correlated telemetry signals provide more context to developers while debugging their applications for performance issues.
We are working on correlating application metrics to logs with just a single click. All charts in our application metrics tab will have the functionality to quickly jump to the logs filter page with filters added for services and time stamps.
If you have more ideas or requirements that show up in your workflow, feel free to comment on the GitHub issue.
SigNoz News
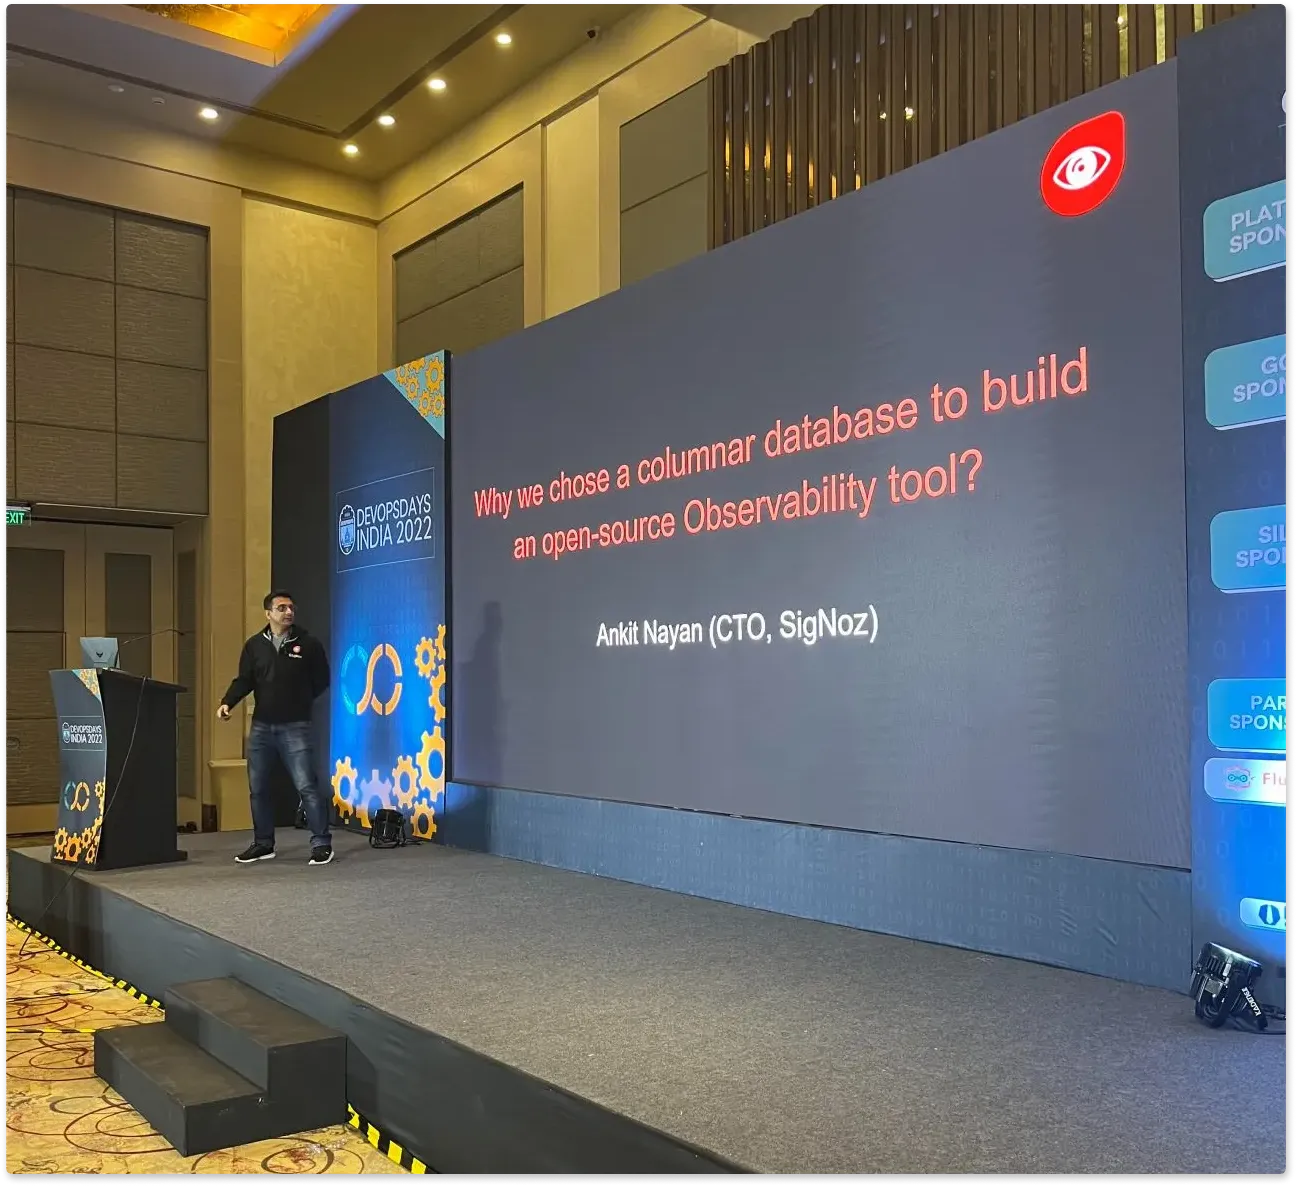
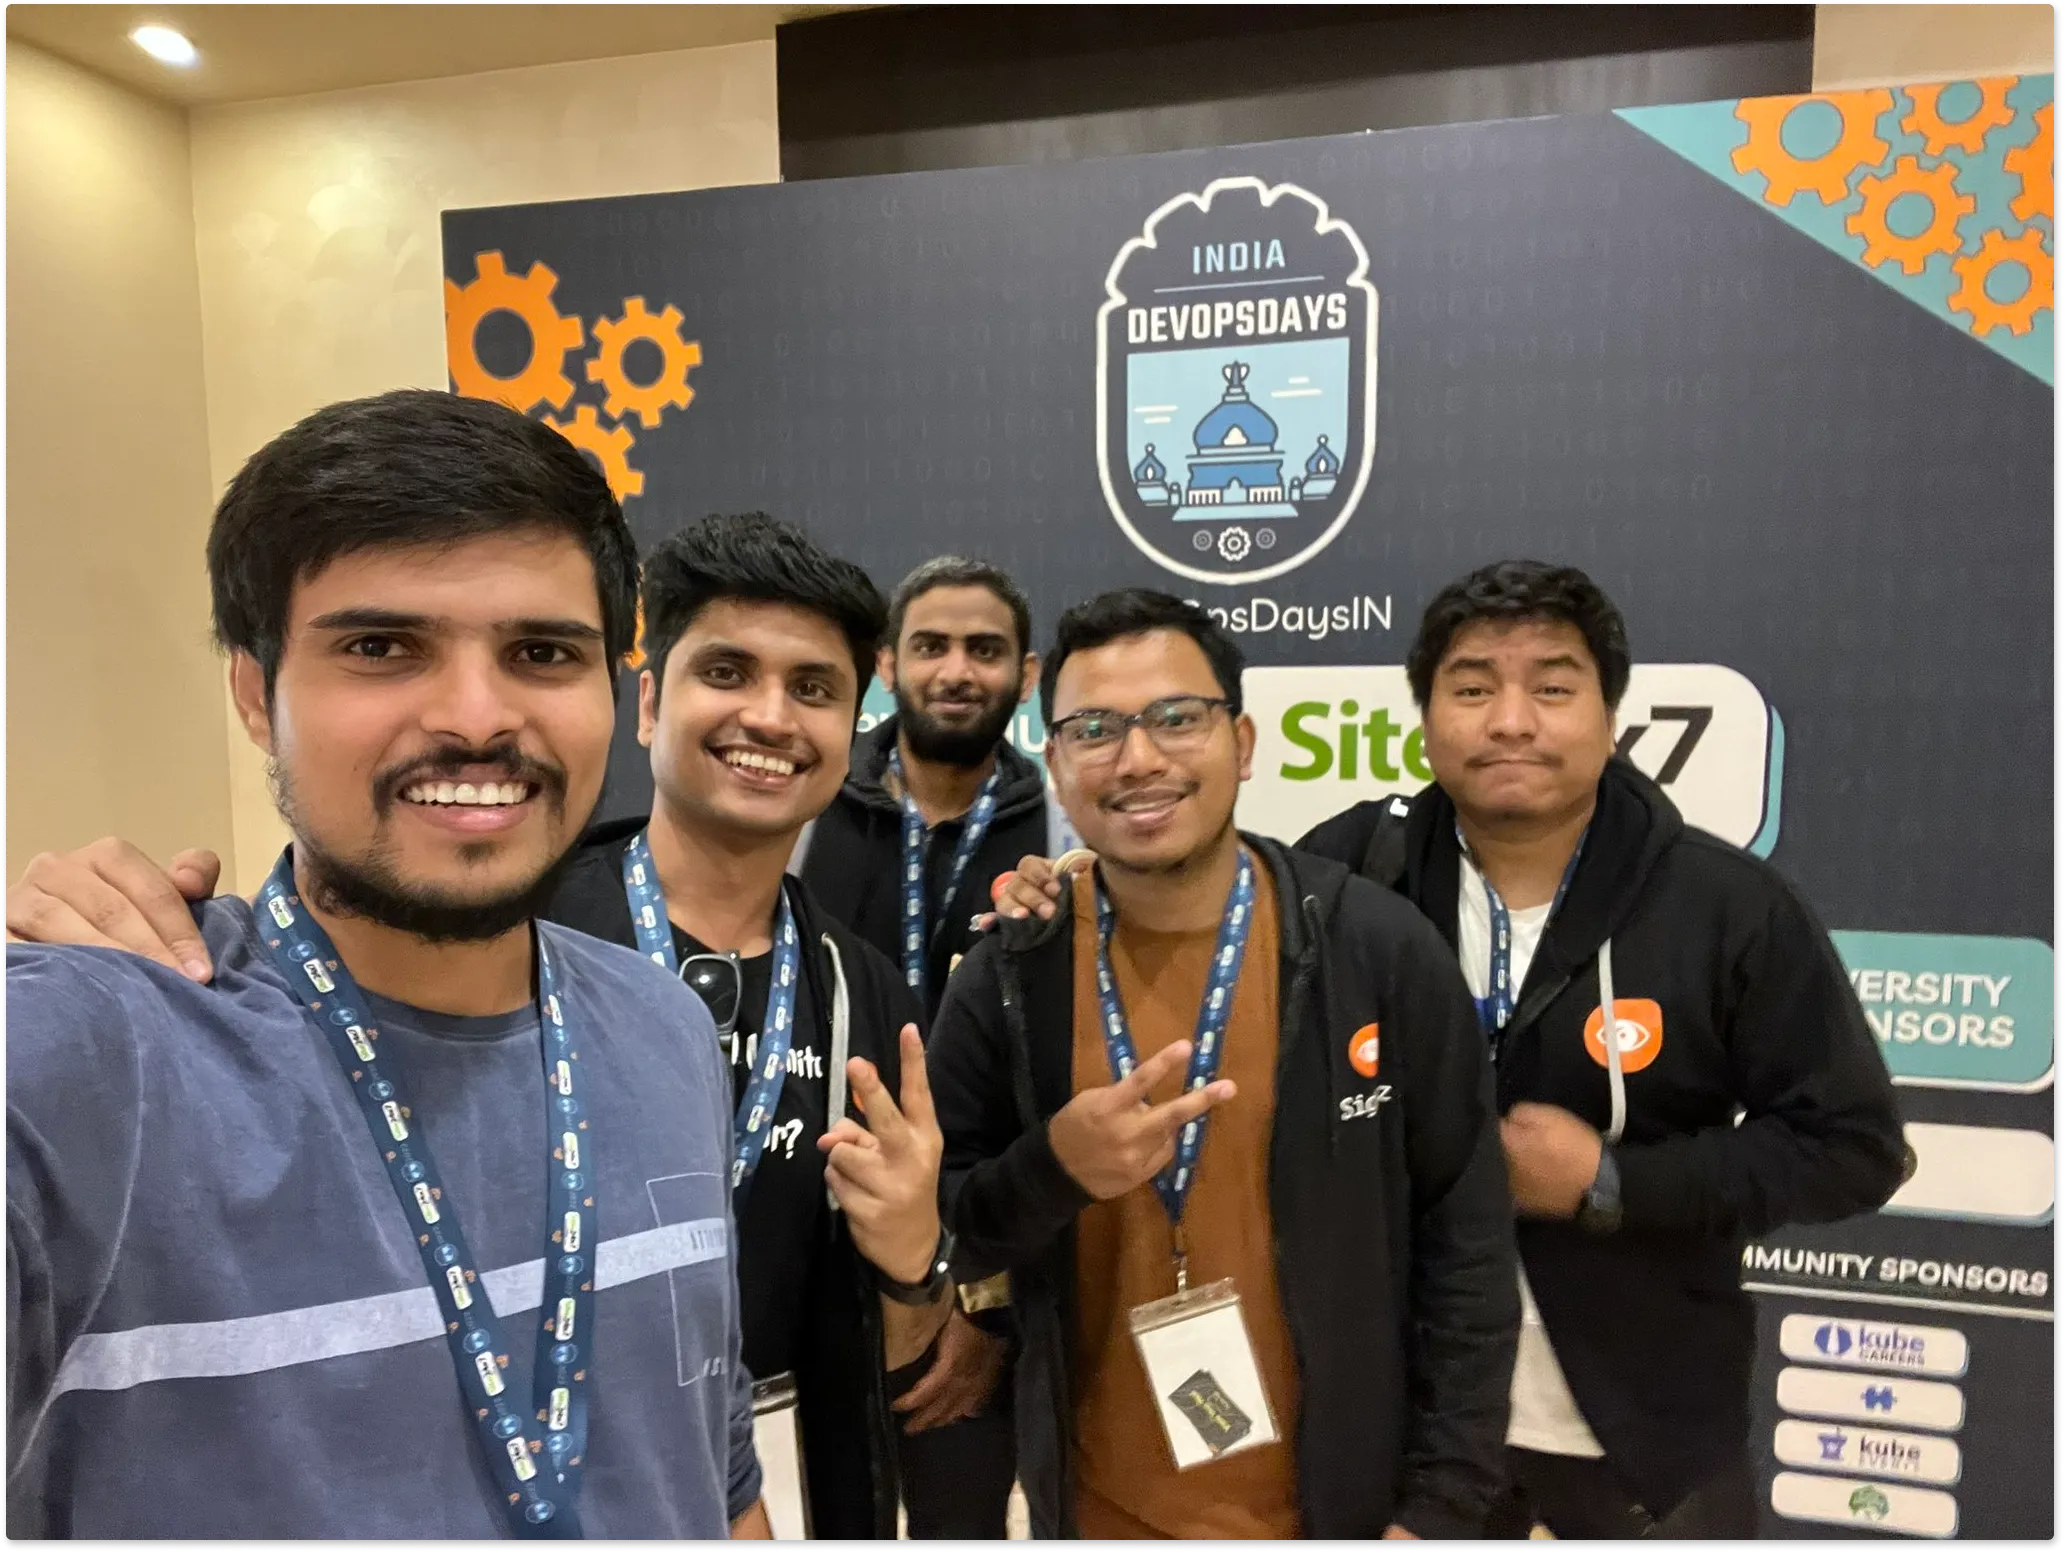
Our team at DevOps Days India, 2022
Our team had a great time interacting with the DevOps community at the annual DevOps Days India, 2022. Ankit Nayan, our CTO and co-founder, also presented a very engaging talk on our choice of data store with performance benchmarking!
It was also a great time for our team members to catch up with each other. As a remote-first team, we cherish every opportunity to hang out with each other and share ideas, banter, and some fun times together.
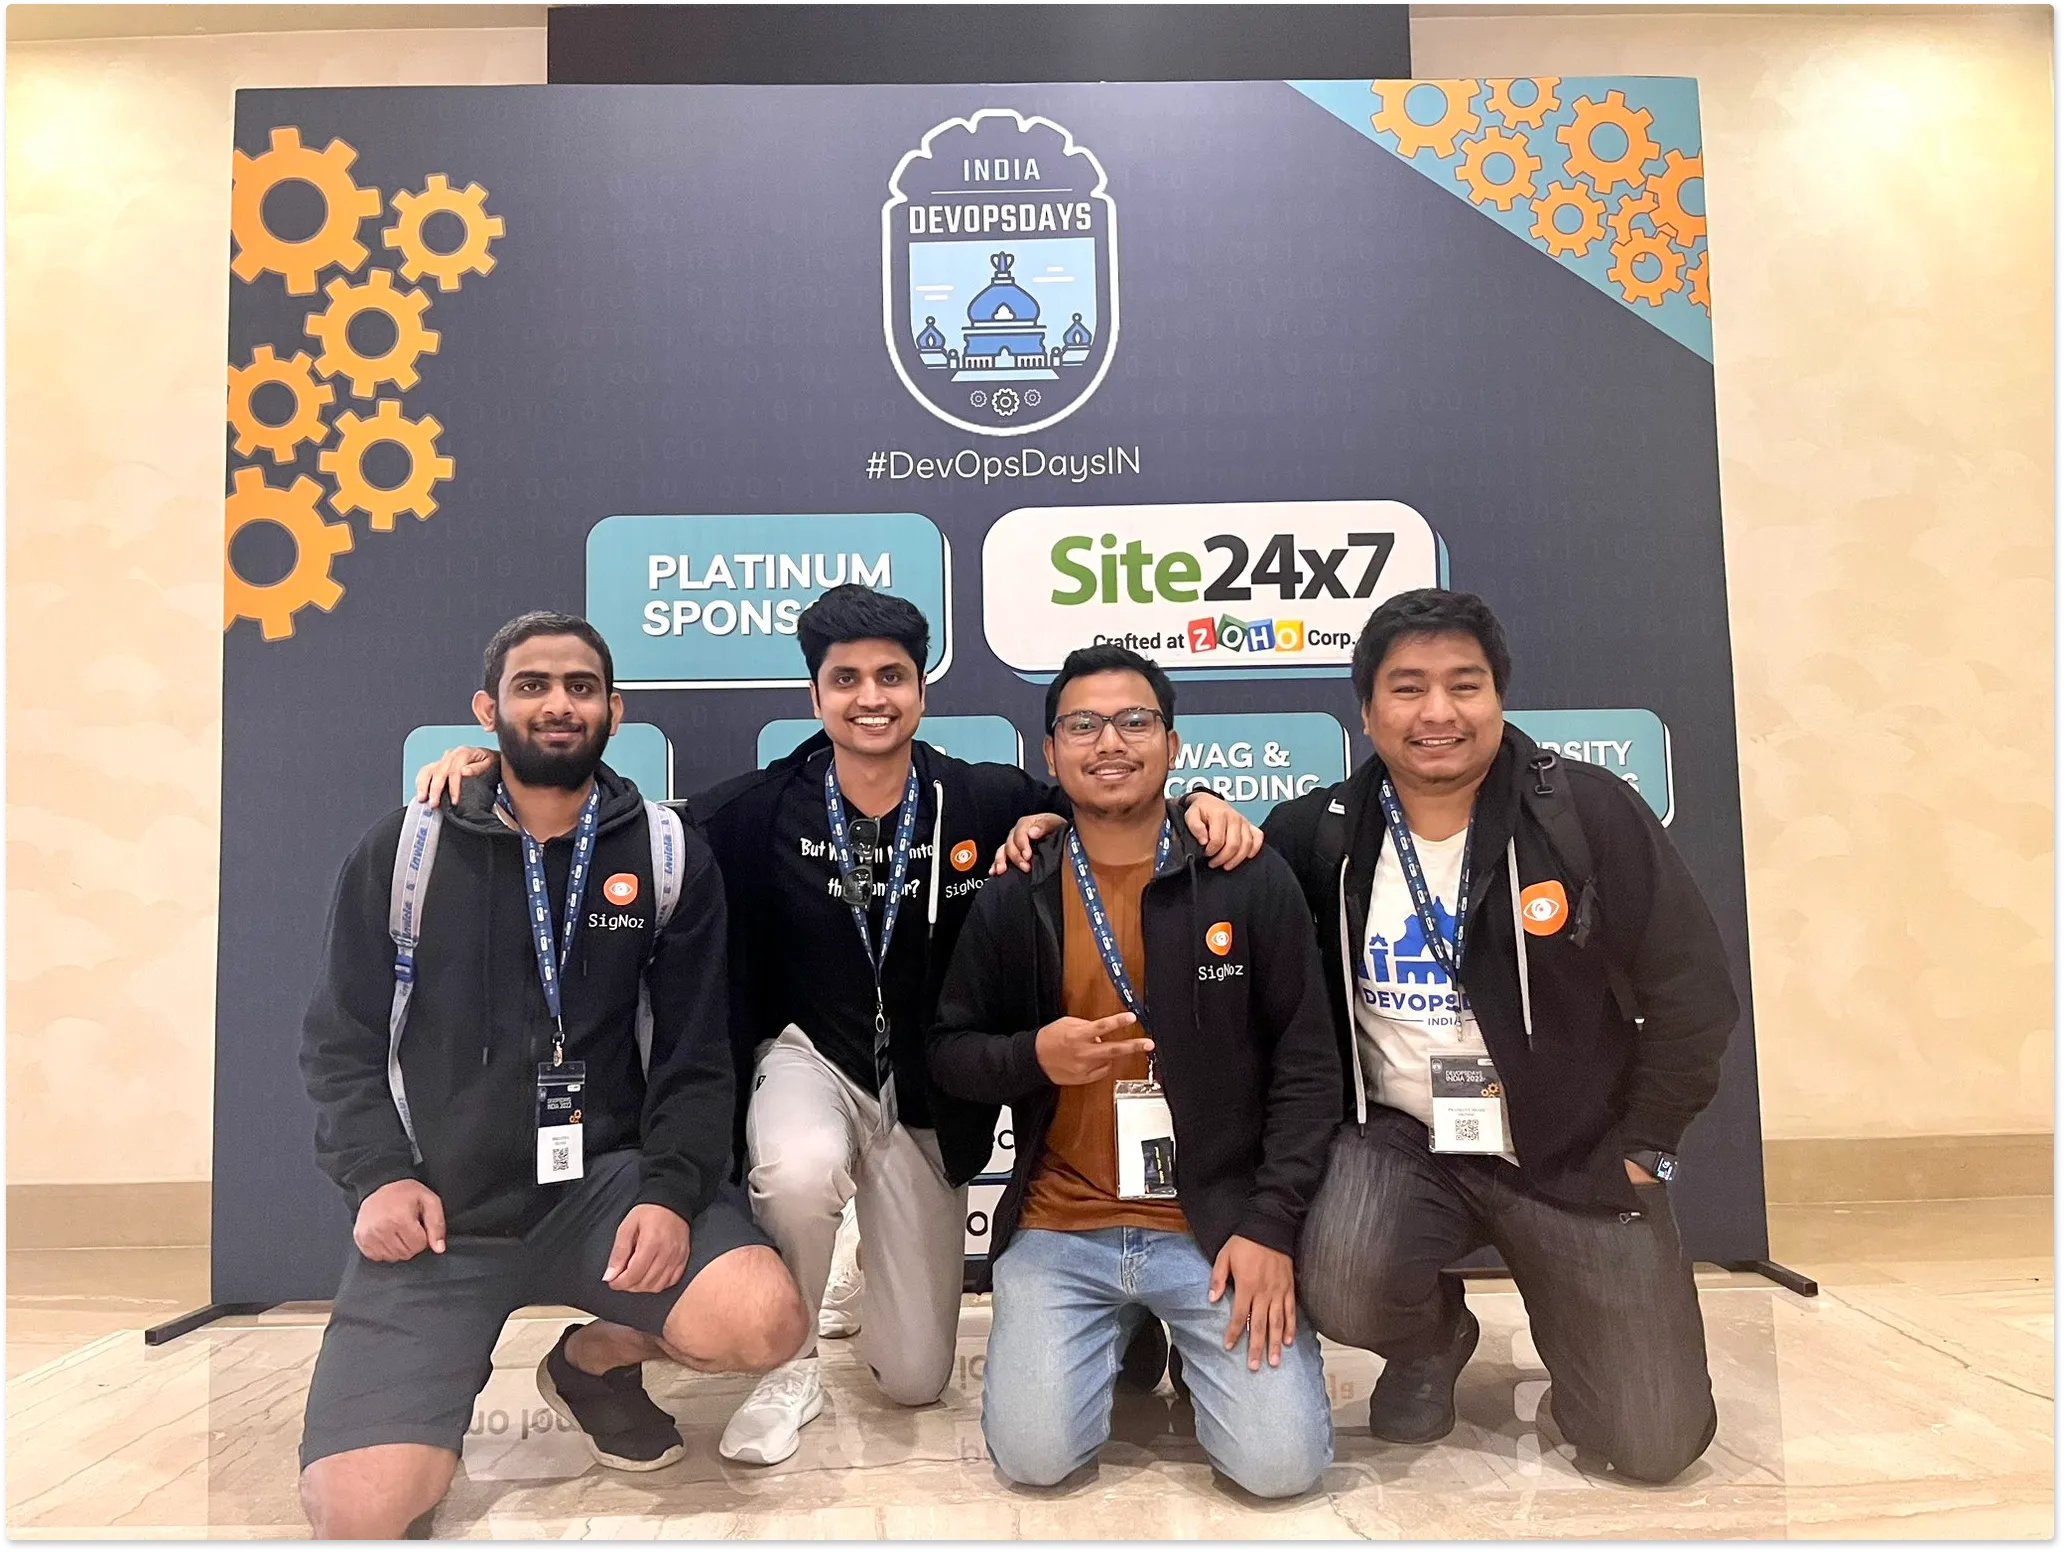
We also got an opportunity to interact with our users in person. It was wonderful to know SigNoz is a part of daily stand-ups for engineering teams who use it to improve their services continuously.
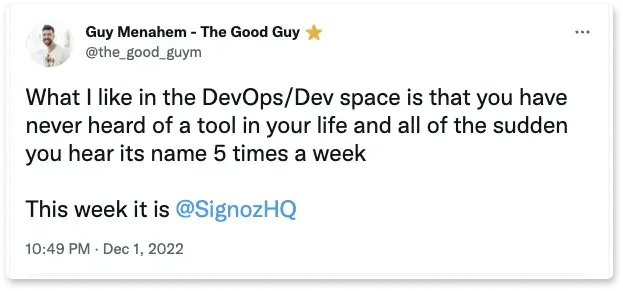
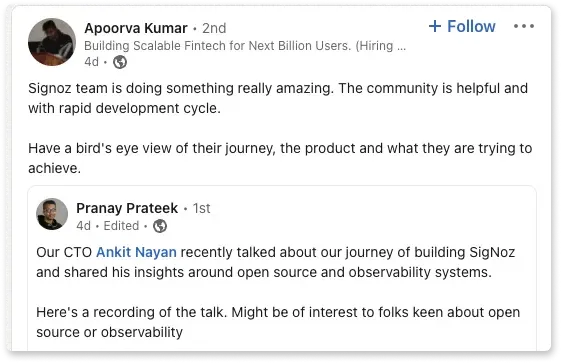
User shoutouts that make us happy
As a growing startup, testimonials from our users mean a lot. Some user shoutouts that made us happy recently.
Office Hours on Logs Performance Benchmark
We conducted office hours to share initial results on logs performance in SigNoz. Modern-day distributed systems generate a humungous amount of logs. Log management systems need to be efficient in ingesting, querying, and storage. We have shared the initial results of Logs perf benchmarks with the community, and gathered their feedback to improve upon it further.
Contributor Highlight
We want to thank the following contributors for making significant contributions to SigNoz in our latest releases 🤗


From the Blog
Log analysis is a very powerful feature for an application when it comes to debugging and finding out which flow is working properly in the application and which is not. Most applications today run on Docker containers.
While Docker has made life easier for developers with on-demand scaling of containers, it has also increased operational complexity. Containers are multi-leveled and ephemeral, and logging is challenging.
Read our guide on Docker logging, including configuration and logging strategies.
Thank you for taking out the time to read this issue :) If you have any feedback or want any changes to the format, please create an issue.
Feel free to join our slack community and say hi! 👋