7000+ GitHub stars, DIY Query Builder & UX improvements - SigNal 14
Change happens gradually, and then suddenly.
It’s time for our monthly product updates. Closing GitHub issues, fixing bugs, shipping code, and sipping coffee, time flies by every month. Last month, we crossed a major milestone of 7000+ GitHub stargazers. We can not thank the developer community enough for supporting us in our mission to democratize observability.

Our team shipped a do-it-yourself Query Builder, which makes creating custom dashboards a breeze. It is a major upgrade to creating dashboards with PromQL.
Apart from the Query builder, we shipped a lot of UX and UI improvements. Let’s see what humans at SigNoz were up to in the month of June 2022!
What we shipped?
We made significant progress in our metrics capabilities last month. Here’s the link to the latest update:
v0.9 is a breaking release that requires data migration. If you are upgrading from an older version, then you have to run the data migration scripts to be able to see past data.
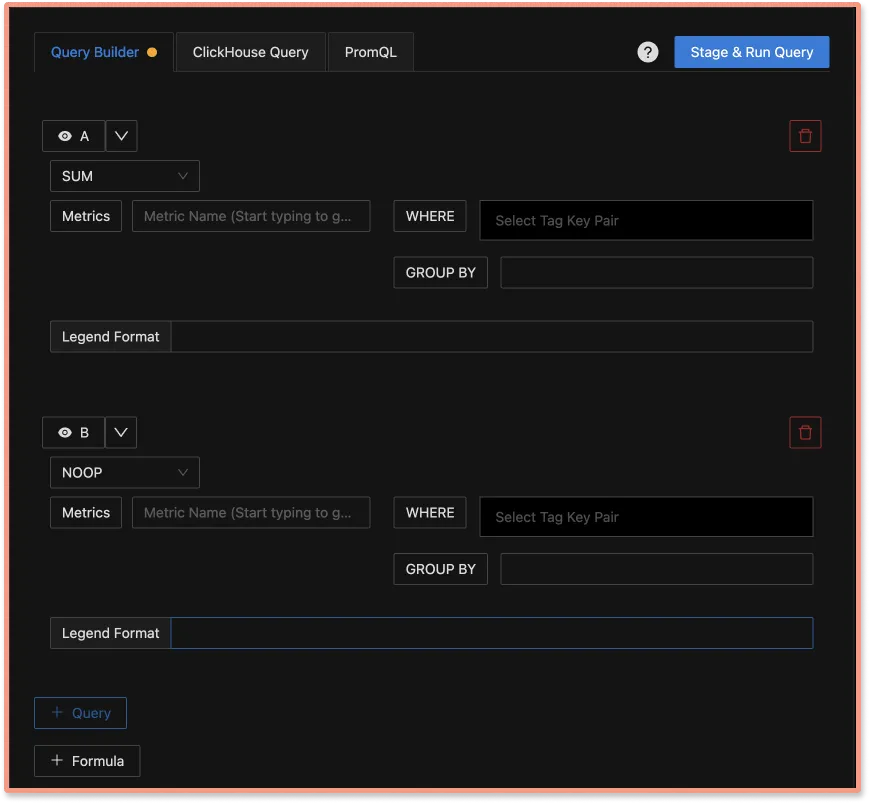
Do It Yourself Query Builder
We have made it easier for our users to build custom dashboards. With the new Query Builder, you can create dashboards easily with dropdowns and metrics auto-suggestions. It has a very small learning curve, and users can start building their required dashboards quickly.
Our users can now create custom dashboards in three ways, using:
- Query Builder
- ClickHouse Query
- PromQL
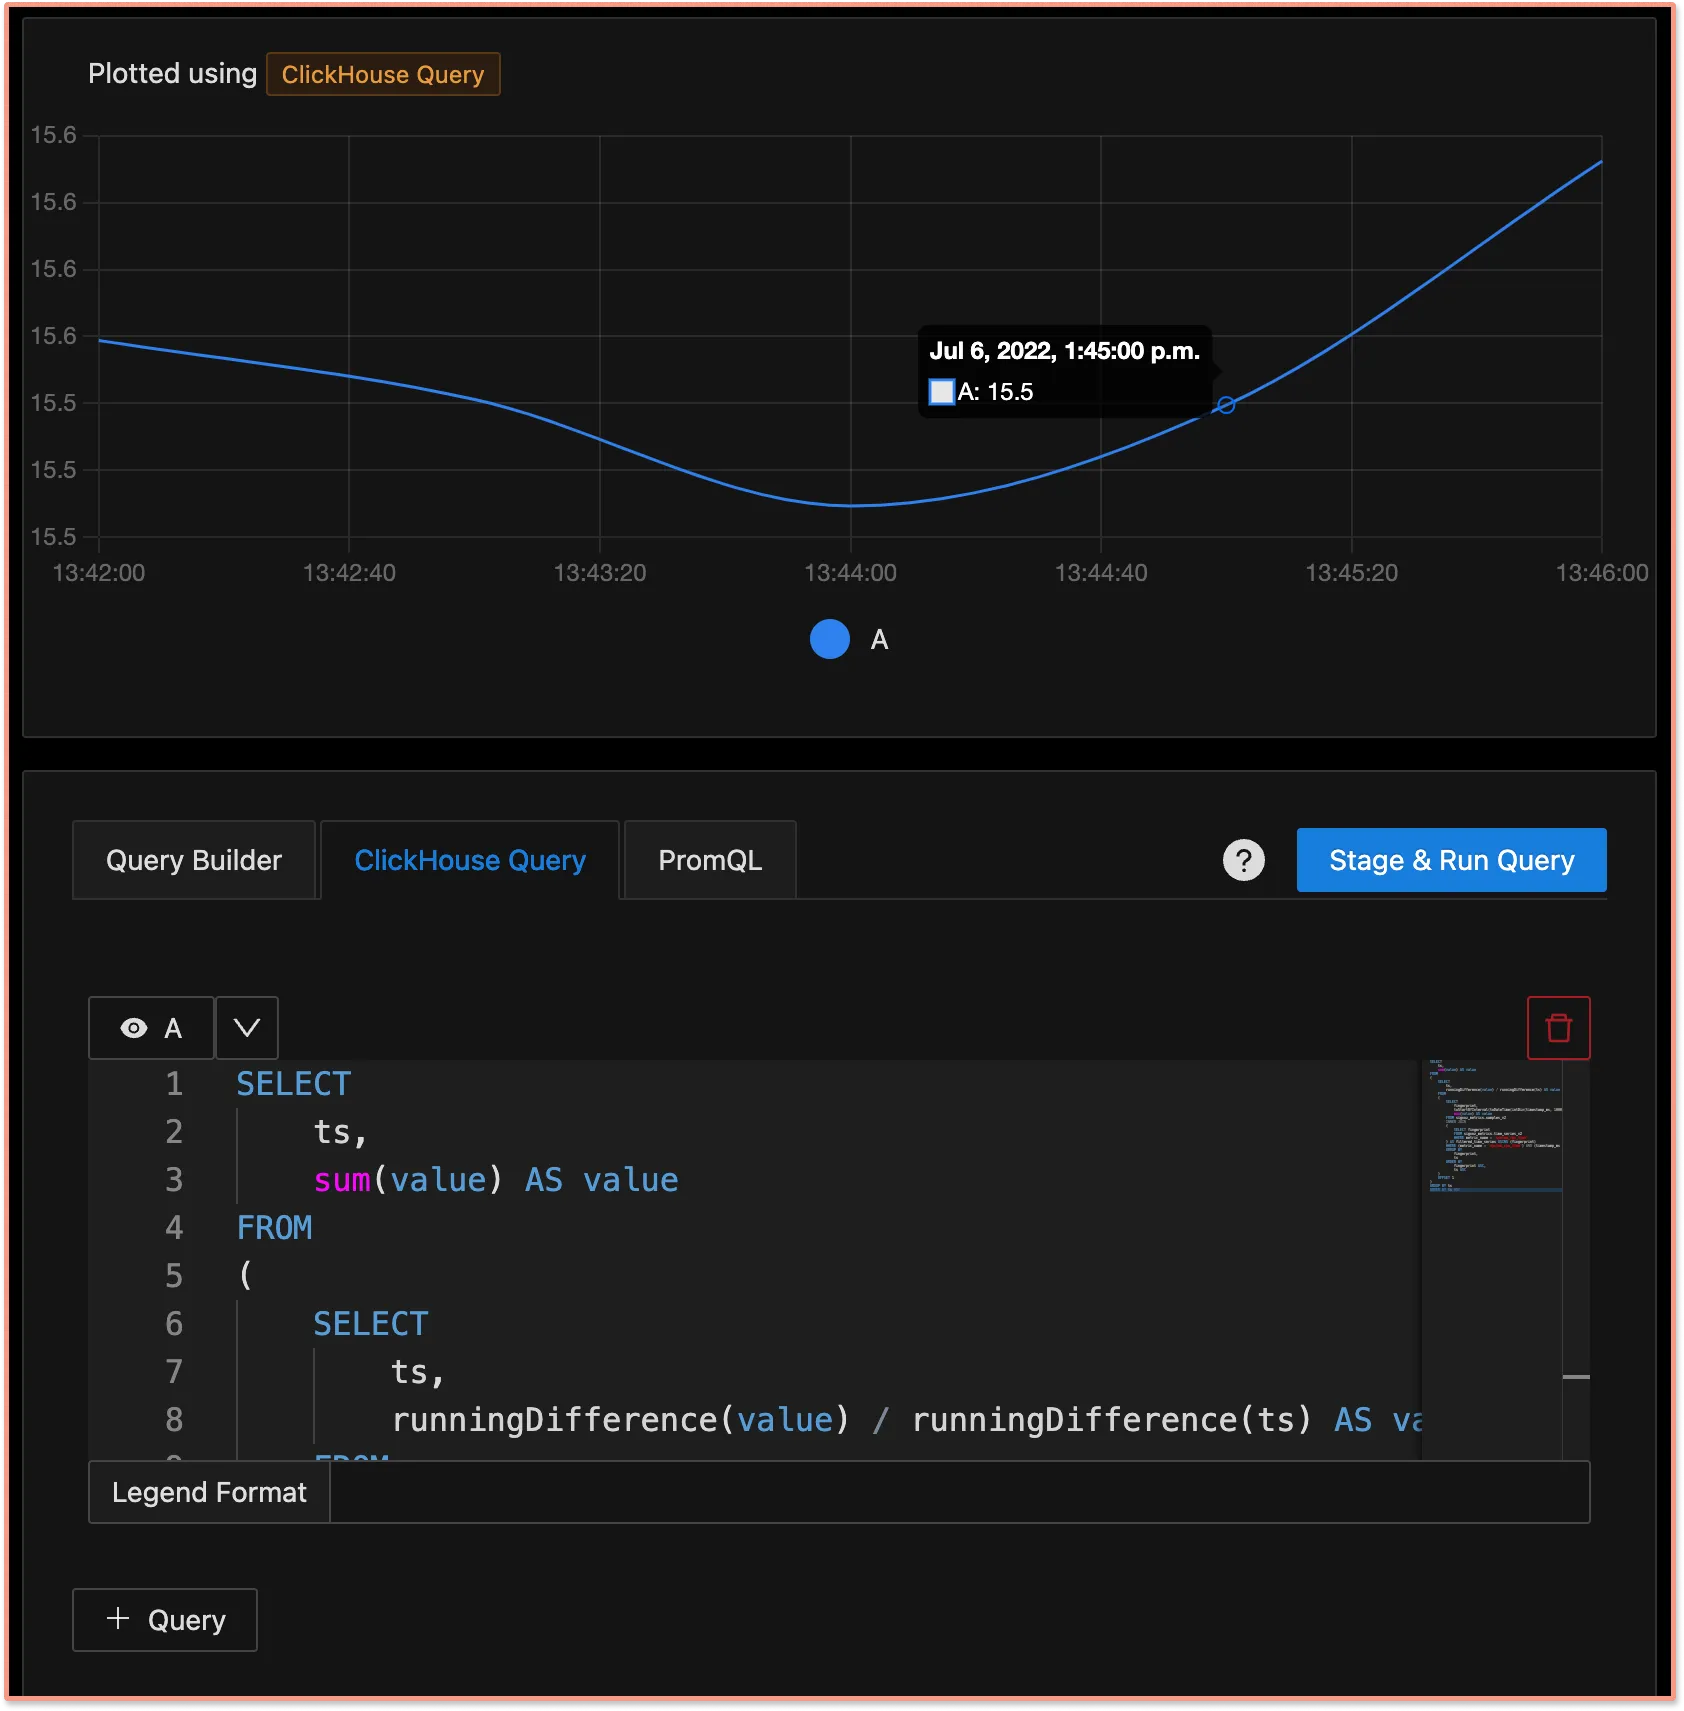
Native ClickHouse Queries
For advanced users, we have shipped support for native ClickHouse queries. ClickHouse is the database that we use for storing the observability data.
With native ClickHouse queries, users can write queries in SQL format as ClickHouse supports SQL format.
For reference - ClickHouse SQL Statements
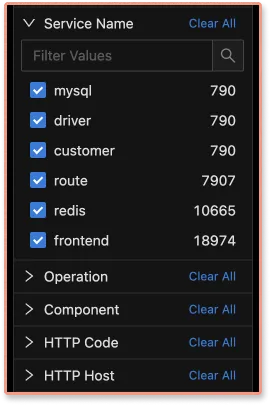
Search for fields values in filter categories of Traces page
We iterate continuously with our users to improve the usability of our dashboards. On our Traces tab, users can use a powerful set of filters to analyze their trace data. Users can apply filters across Service Name, Operation, HTTP Code, etc., to see their required set of data.
Often, the number of field values in these filter categories is huge, and it’s practically impossible for users to remember all field values. In this release, we have introduced a search field for the field values making it easier for our users to navigate the filters.
Improved CPU usage performance
Observability datasets are huge. We are continuously optimizing SigNoz for better performance at scale. We optimized the storage of the time-series dataset to improve CPU usage performance by manifolds. Users will now be able to run SigNoz more efficiently in their production environment.
UI Improvements
Apart from building the UI for Query Builder, we also shipped a lot of UI improvements both in the dark and light mode versions of SigNoz. UI improvements like auto-suggestion of field values improve the usability of the product. You can check out the list of improvements here.
What’s upcoming?
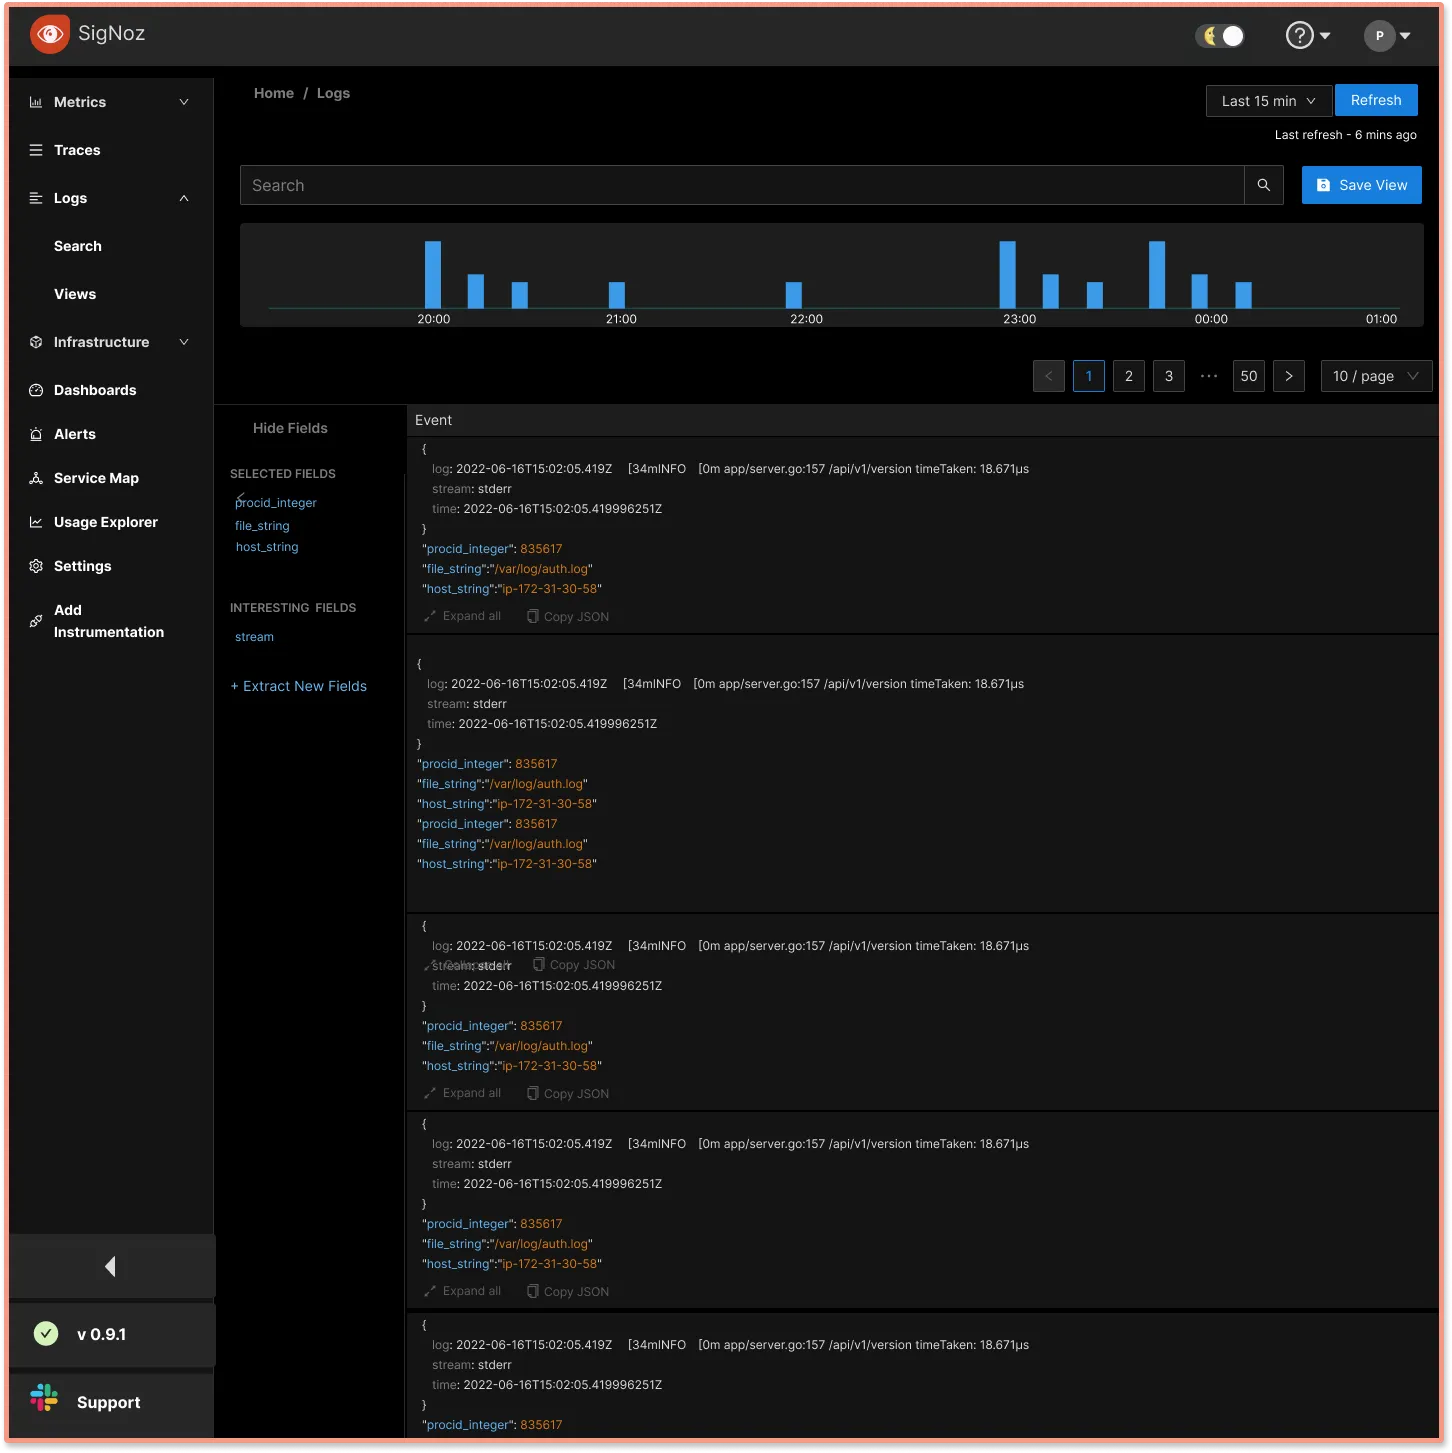
Log Management
Log management will be shipped shortly with SigNoz. This will be a huge upgrade to our capabilities. Logs, metrics, and traces are considered the three pillars of observability. We want to equip our users with all three signals to debug their performance issues quickly.
With log management enabled in SigNoz, users can monitor everything using a single pane of glass. Here’s a sneak peek of the Logs tab on SigNoz dashboard:
We would love to hear about your use cases and ideas on logs, feel free to comment here:
https://github.com/SigNoz/signoz/issues/1139
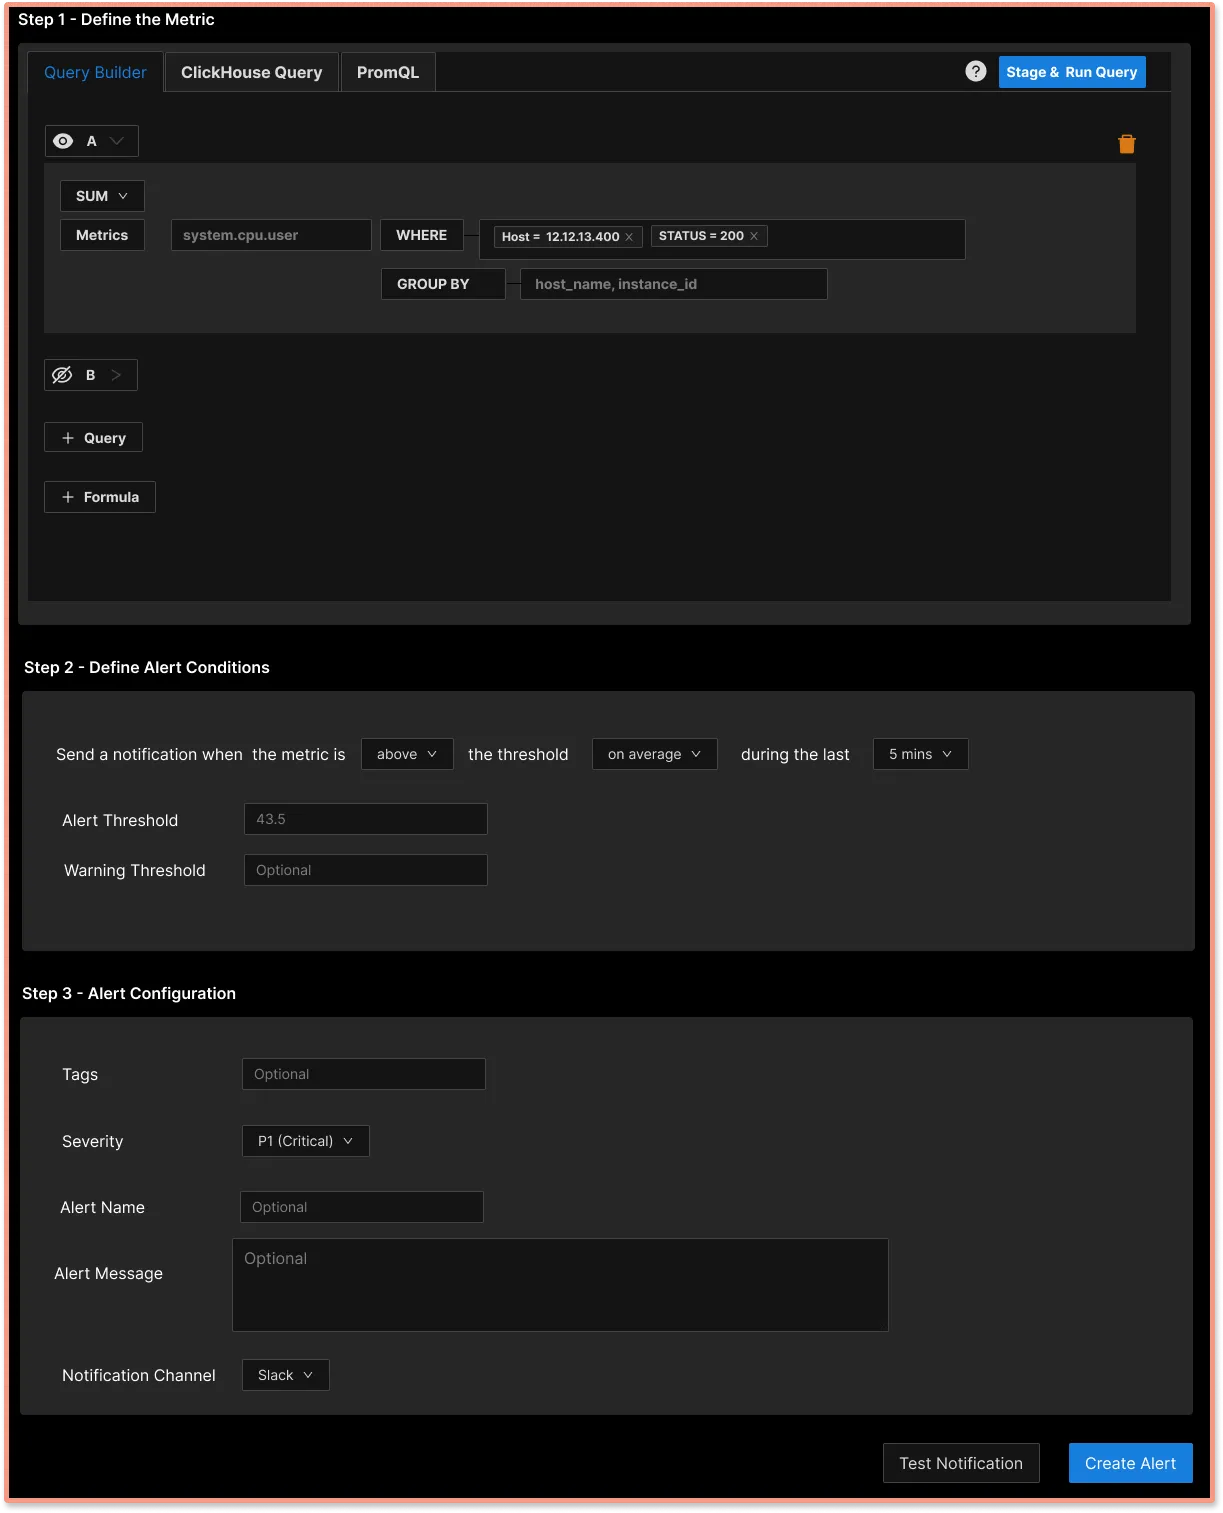
Alerts Builder
We are working on improving our alerts building experience. Just like our metrics builder, the goal is to make it easy for users to configure alerts on their metrics. Currently, alerts can be set using PromQL, which has a bit of a learning curve.
With the new alerts builder, users can set alerts quickly without requiring any knowledge of the PromQL query language. Here’s a sneak peek into our upcoming alerts builder page.
Featured Issue
Support and Docs for OpenTelemetry Operators
OpenTeletery Operators can help you instrument your application code with minimal changes to your code. If you have used the OpenTelemetry operator in your application, feel free to share your experience on this GitHub issue.
https://github.com/SigNoz/signoz/issues/1315
SigNoz News
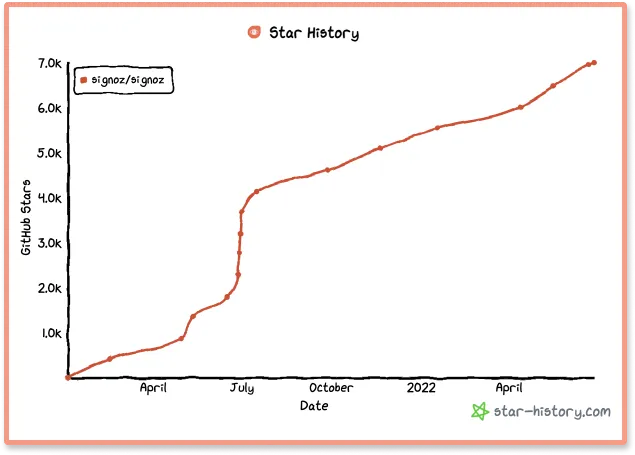
7000+ GitHub stars and counting
Last month, we crossed 7000+ stargazers on GitHub. We started out building SigNoz with a vision of open source observability because we had experienced the pain of not having access to a robust observability setup ourselves. It’s good to see that vision resonating with the developer community. And we’re just getting started!
Next stop, 10,000 GitHub stars! 🥳 We’re coming.
If you’re someone interested in observability and application monitoring domain, check out our Github repo here:
Contributor Spotlight
We want to thank our new contributors who made significant contributions to the latest releases of SigNoz. 🤗

India


From our Blog
OpenTelemetry provides you the freedom to choose a backend analysis tool of your choice. But what factors should be taken into consideration before selecting an OpenTelemetry backend? In this article, we list down the factors you should keep in mind before selecting an OpenTelemetry backend:
Choosing an OpenTelemetry backend - Things to keep in mind
OpenTelemetry follows a specification-driven development. Each language implementation follows the design principles from the OpenTelemetry Specification. Following the design principles, OpenTelemetry has an implementation for Elixir applications too.
In this tutorial, learn how to use OpenTelemetry to instrument one of the most common combos in the Elixir world: Phoenix + Ecto.
Monitor your Elixir application with OpenTelemetry and SigNoz
Thank you for taking out the time to read this issue :) If you have any feedback or want any changes to the format, please create an issue.
Feel free to join our slack community and say hi! 👋