Improved User Experience, Community-led Tutorials, and the Upcoming Explorer pages - SigNal 26
"Every action you take is a vote for the person you wish to become.” James Clear
Welcome to the 26th edition of our monthly product newsletter - SigNal 26! Our team shipped important updates to improve user experience. We were also pleasantly surprised by the number of community-led tutorials featuring SigNoz.

Let’s dive in to see what humans at SigNoz were up to in the month of June 2023.
What we shipped?
We have improved our user experience with updates in different tabs of SigNoz. We have also been busy working on the new Trace and Logs Explorer pages.
Latest release - v0.22.0
Earlier Releases - v0.21.0
Improved experience in APM charts and traces
We have shipped updates in APM charts to improve user experience. You can now see the data inside the tooltips sorted according to values.
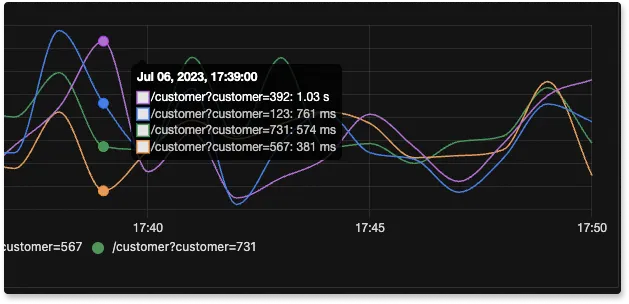
We have also introduced a feature to configure noisy top-level operations. You can find more details about it in this PR.
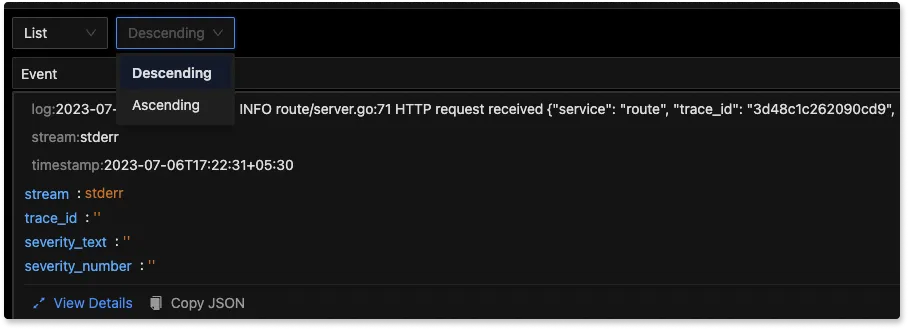
Sort your logs based on timestamp
You can now sort logs in ascending or descending order based on timestamp. It will sort all the logs for the selected time range.
Ability to clone an alert
You can now clone your alerts in SigNoz.
What we’re working on?
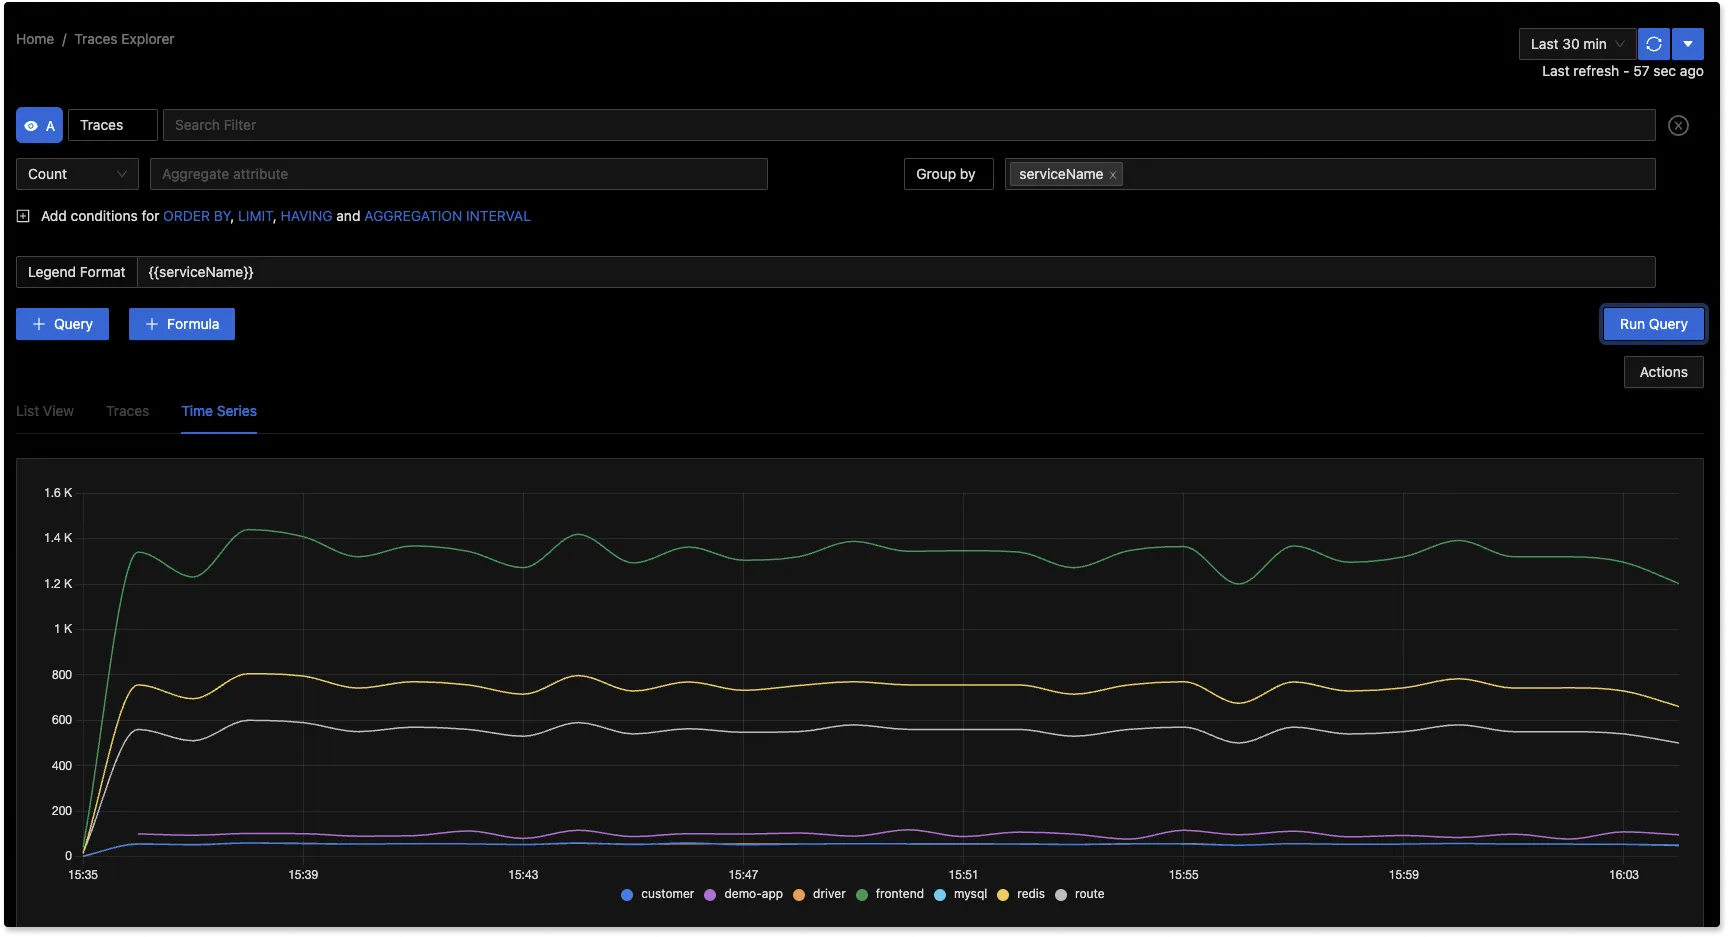
New Trace Explorer and Logs Explorer page
We’re working on a new Trace and Logs Explorer page. It will give users much more granular control over logs and trace data.
Here’s a sneak peek of the Trace Explorer page. You can dig deeper into your trace data, make charts and add them to your dashboards.
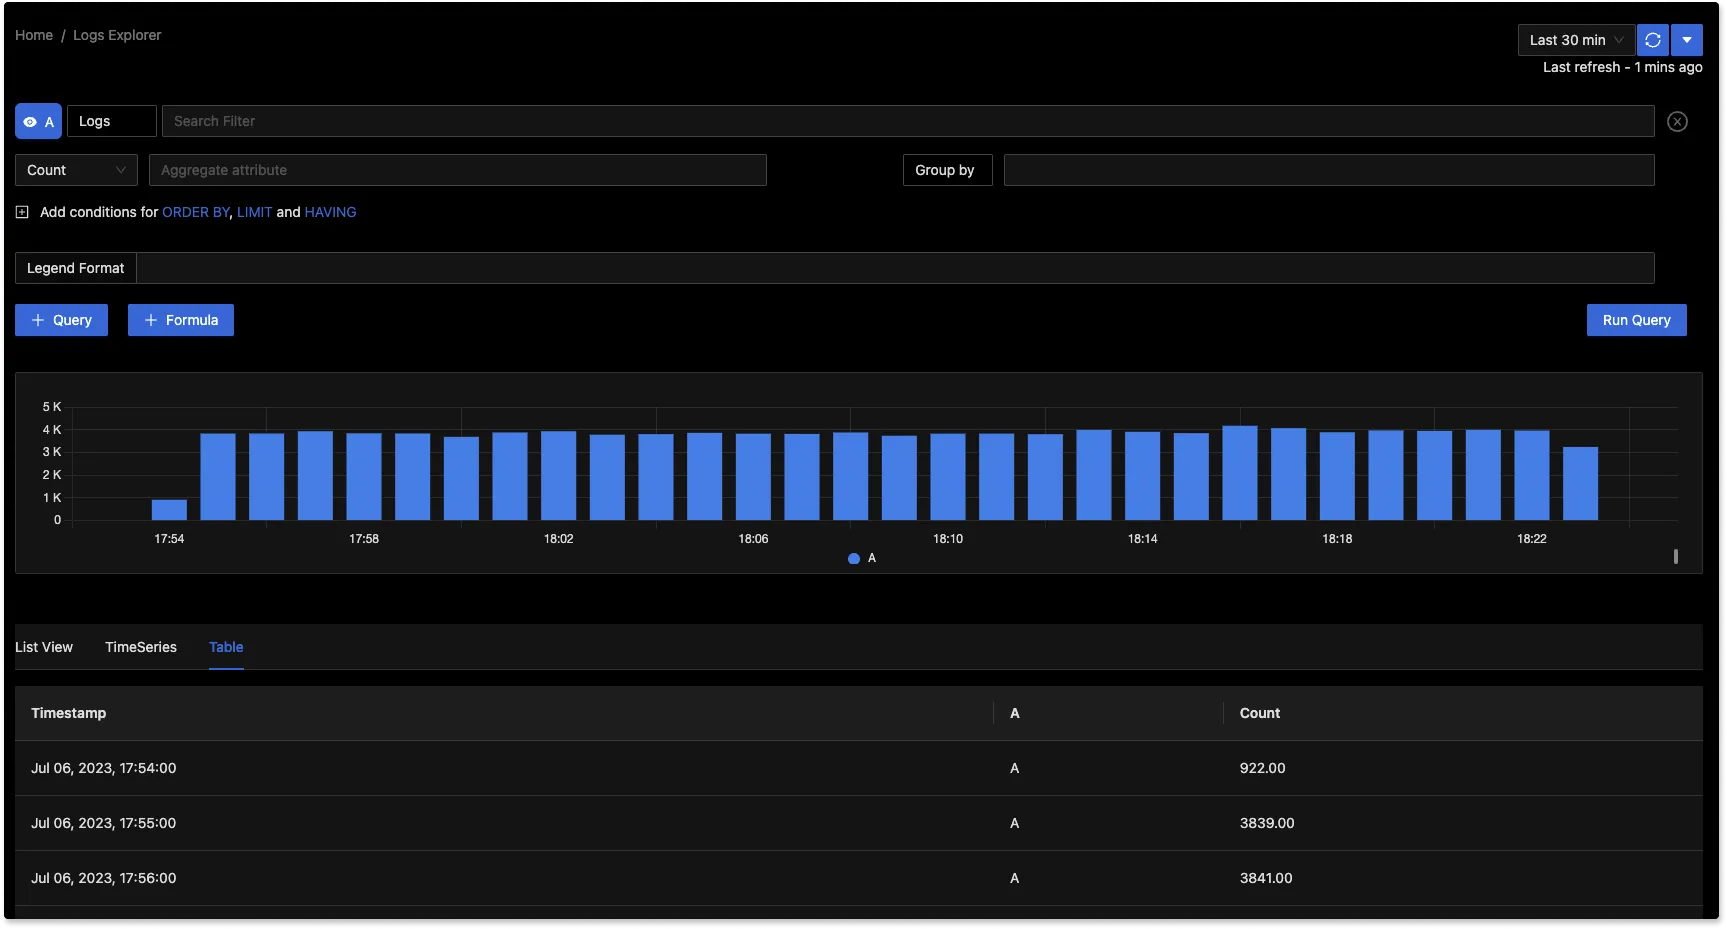
Here’s a sneak peek of the Logs Explorer page. You can search and analyze your logs easily. You can also build charts and see your log data in compact views.
Working at a Dev Infra Open Source Startup
Working at an early-stage startup is not easy. But it also gives you the opportunity to work on areas that you would never get in a bigger org. We are building a developer tool, and our developers are getting a front-row seat to building a dev infra product from scratch.
Our team member, Srikanth Chekuri, penned down his experience as an early team member explaining the challenges and the opportunities.
We already have users using it in the production environment and ingest tens of millions of events per second. As we scale it, there is no shortage of engineering challenges, from building highly reliable data pipeline systems to reusable and high-performant web components to scaling applications and storage systems on Kubernetes that easily handle billions of records. -Srikanth Chekuri, SigNoz Backend Team
You can read the full post here.
SigNoz News
User Shoutout
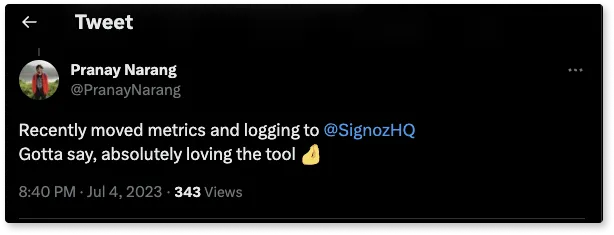
We feel the happiest when we find our users love their experience with SigNoz. We are working on building a seamless observability experience with three signals in a single pane of glass.
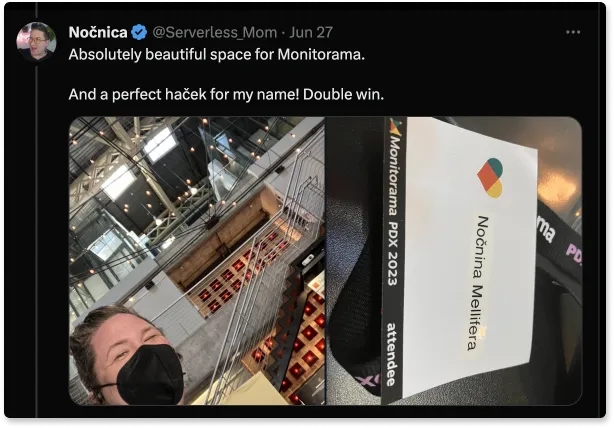
Attended Monitorama Portland 2023
Nica from our team attended Monitorama Portland 2023. Nica has joined our team as the founding developer advocate, and we’re very excited for her to join us.
Monitorama is an exclusive event for monitoring and observability practitioners. Check out Nica’s twitter thread to know more.
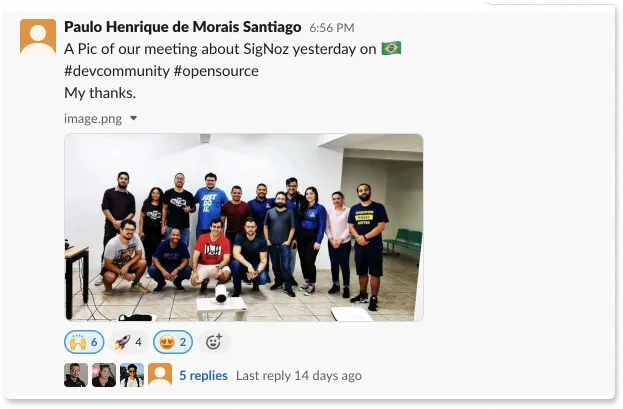
Community Tutorials on SigNoz
It’s great to see SigNoz getting adopted by developers across the world. We were pleasantly surprised to see a developer meetup about SigNoz in Brazil. The host of the meetup, Paulo was kind enough to join our Slack community and share about the meetup.
Here’s another video tutorial that folks made on how to use SigNoz with OpenTelemetry.
Developers from Korea have also created a detailed tutorial on SigNoz. You can check out the full tutorial here. We want to democratize observability for teams of all engineering sizes, and our open source solution is helping out devs from across the world. 🥳
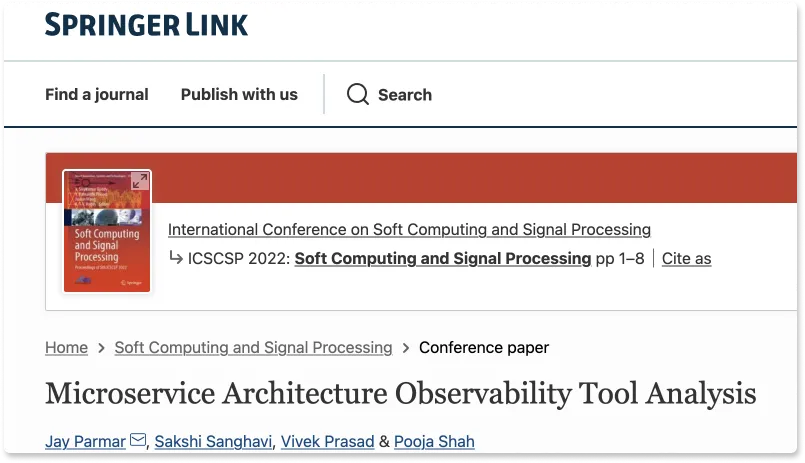
SigNoz making its way into academic research papers
It’s good to see SigNoz getting featured in academic research papers. It’s good to see more research around observability for microservices architecture. You can find the conference paper here
OpenTelemetry End-user Group Discussion
The team at SigNoz facilitates the monthly OpenTelemetry End-user group discussions for the APAC region. The OTel end-user group discussion is a place where you can discuss challenges related to OpenTelemetry implementations and learn from other OpenTelemetry users in a vendor-neutral space.
In our June session, we discussed real-world experiences using OpenTelemetry auto-instrumentation packages. We also discussed the status of OpenTelemetry logs and managing large deployments using OTel infra.
If you wish to participate in the next APAC end-user session, please register on our website
We’re Hiring!
We’re hiring the next set of rockstars to take SigNoz to the next level. You can look at open roles here.
If you know someone in your network who you think will be a good fit for SigNoz, please refer them.
Contributor Highlight
Every month, contributors from our community help make SigNoz better. We want to thank the following contributors who made contributions to SigNoz last month 🤗


From the blog
High-cardinality data refers to a dataset or data attribute containing many distinct values relative to the total number of data points. In other words, it refers to data with a large number of unique or distinct entries compared to the overall size of the dataset.
Read about what makes high-cardinality data and its benefits.
What is High Cardinality Data?
Thank you for taking out the time to read this issue :) If you have any feedback or want any changes to the format, please create an issue
Feel free to join our Slack community and say hi! 👋