“But I know, somehow, that only when it is dark enough can you see the stars.” Martin Luther King, Jr.
Welcome to our monthly product newsletter - SigNal 22!
Last month our team worked on improving the logs tab and improved the correlation between telemetry signals to drive contextual insights faster. We were also trending on GitHub and crossed 2000+ developers in our slack community.

Let’s dive in to see what humans at SigNoz were up to in the month of February 2023.
What we shipped?
Logs data is often huge, and to drive insights faster, users needed more compact views of collected logs. We have shipped multiple views for our logs tab and made improvements in the traces tab. We also worked on improving the correlation between metrics and traces.
Earlier Releases - v0.16.1, v0.16.0
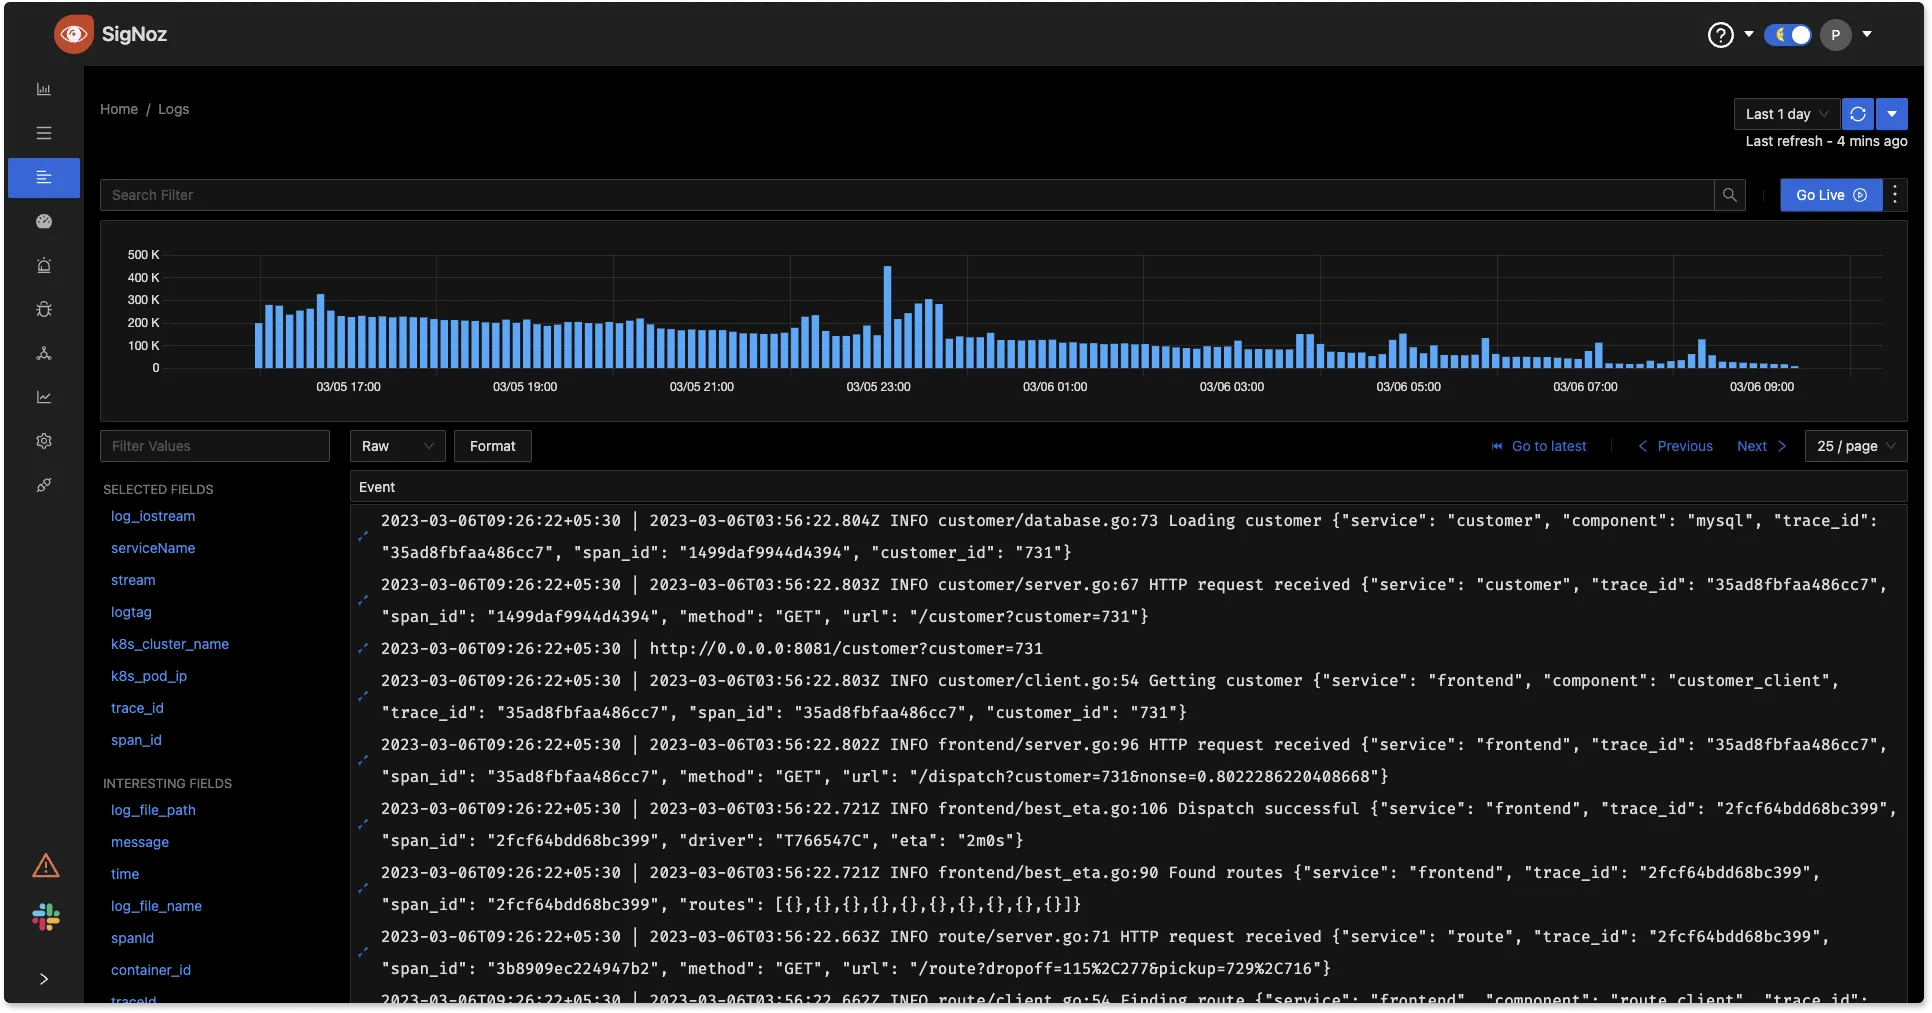
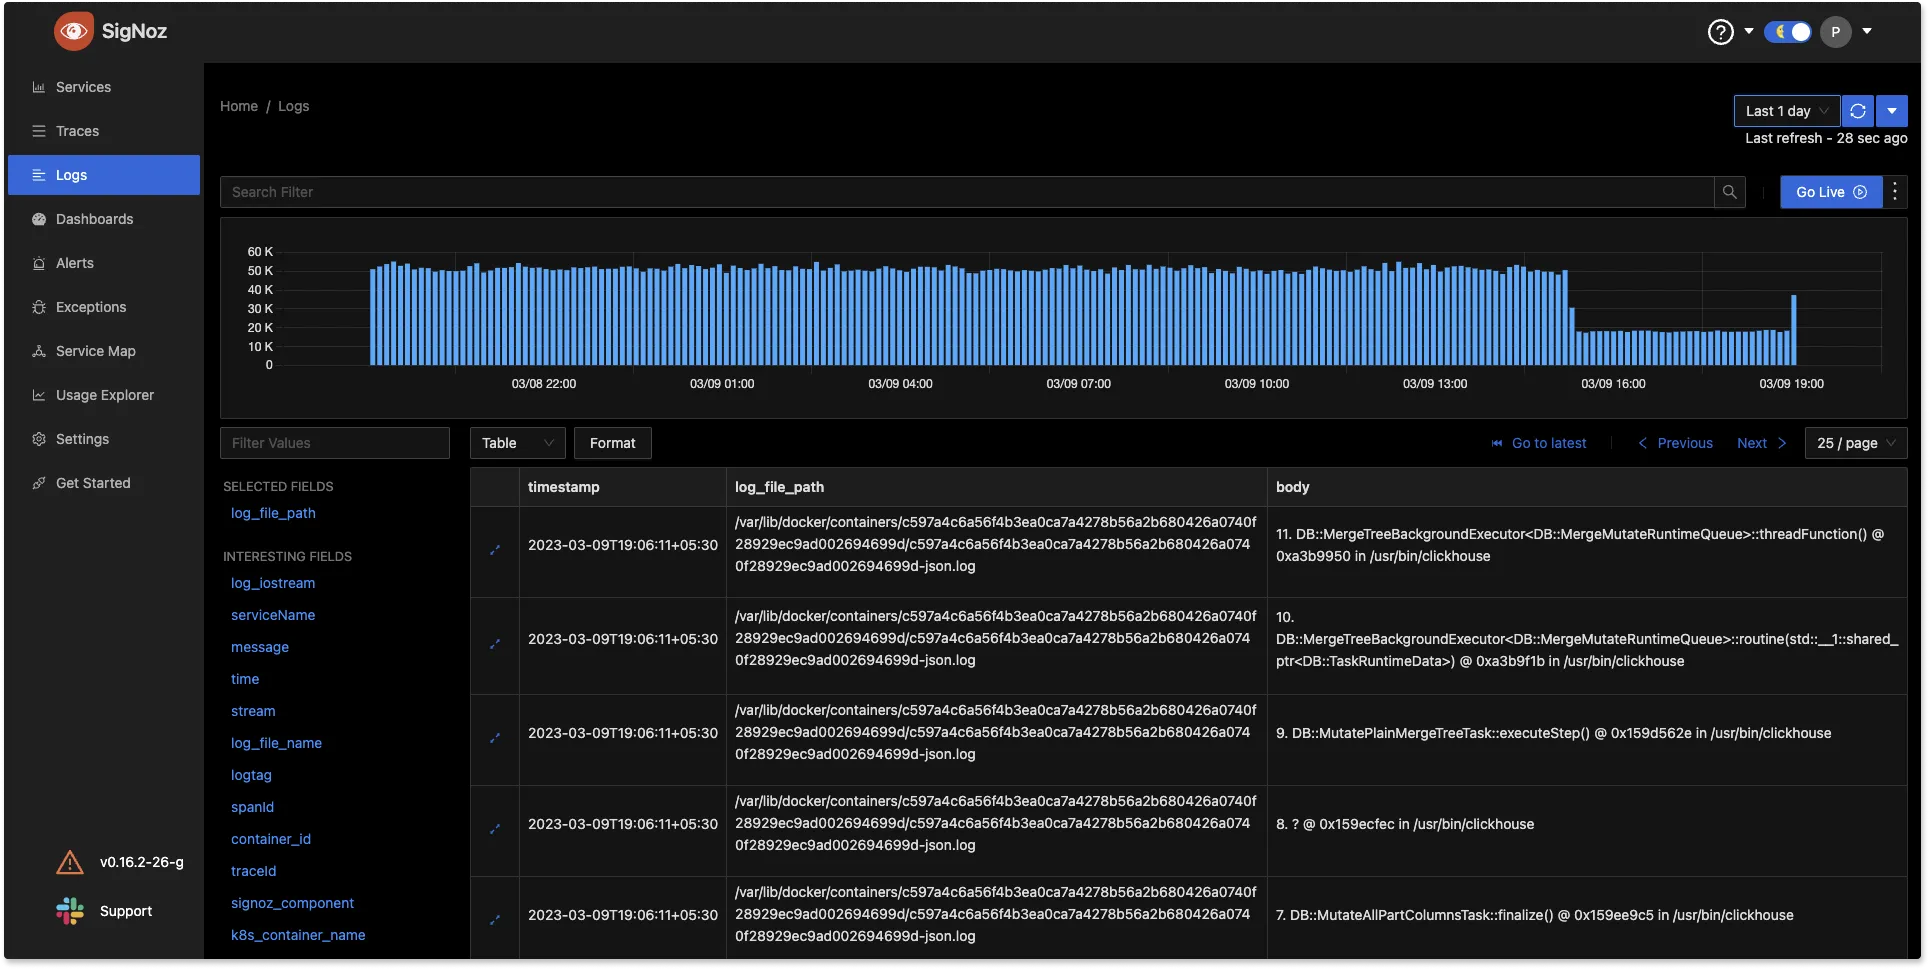
Improved Logs Management Tab
Our Logs tab now comes equipped with multiple views so that users can consume their logs data easily. You can view your logs in either list, raw, or table view, making it very easy to monitor logs data.
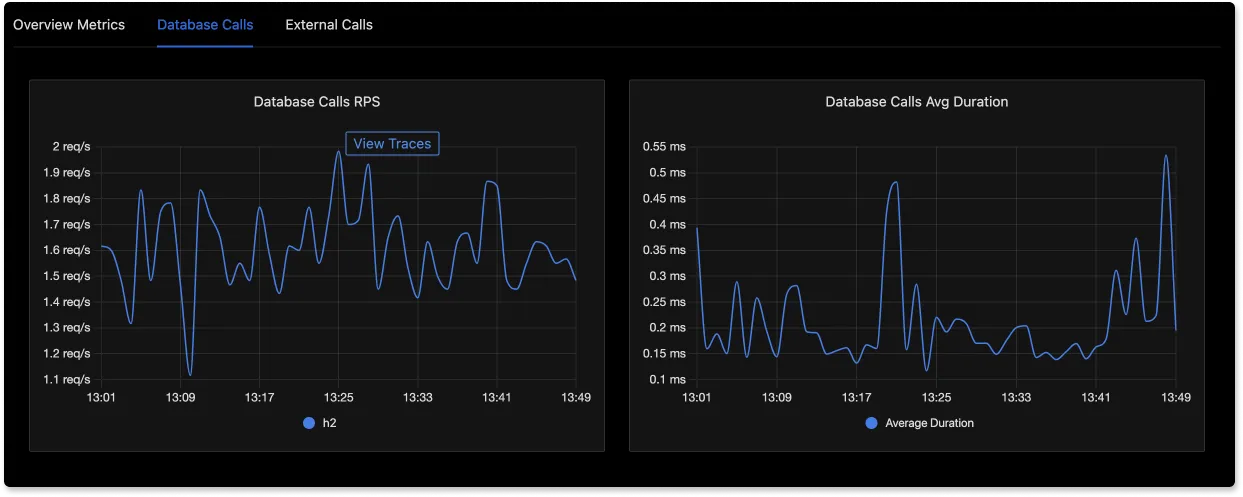
Correlated Database Metrics and Traces
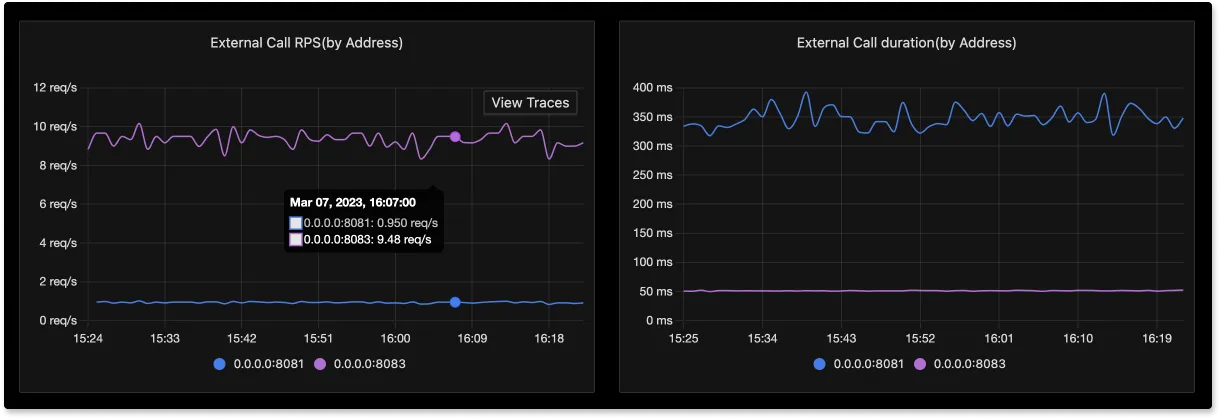
Intelligent correlation between different telemetry signals can help drive contextual insights faster. SigNoz comes with out-of-box charts for database and external calls. These metrics charts are now correlated with traces.
At timestamps, where the database or external calls are taking more time, users can dig deeper by viewing traces around that timestamp. You just have to click on the metrics graph and then click on View Traces to investigate the spans associated with the calls.
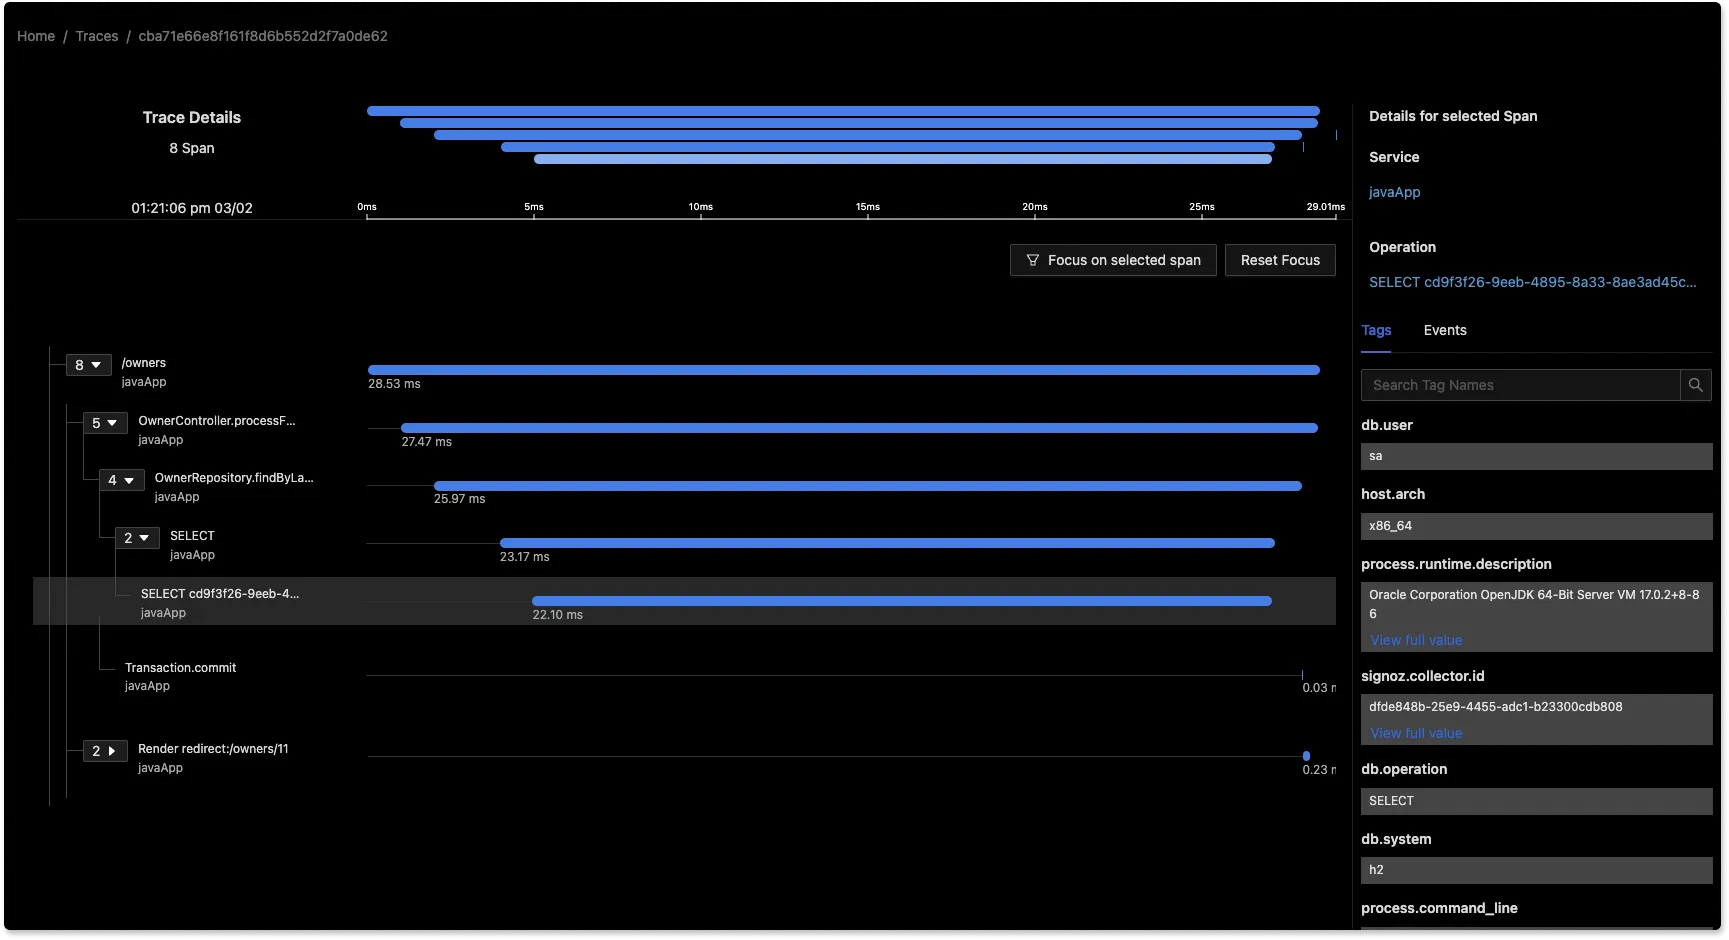
You can also dig deeper into issues related to external calls.
Improvements in the Traces Tab
Using the Traces tab, users can run aggregates on tracing data. This is a powerful feature that lets users dig deeper into business metrics. We have enabled autocomplete suggestions in the Group By filter to make it easier for users to apply filters.
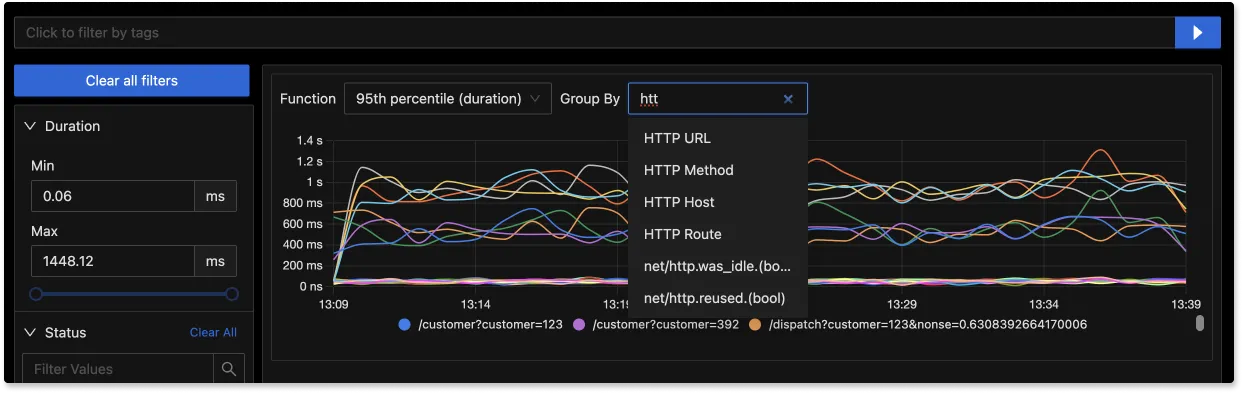
Group By filter on Traces tab.What’s upcoming?
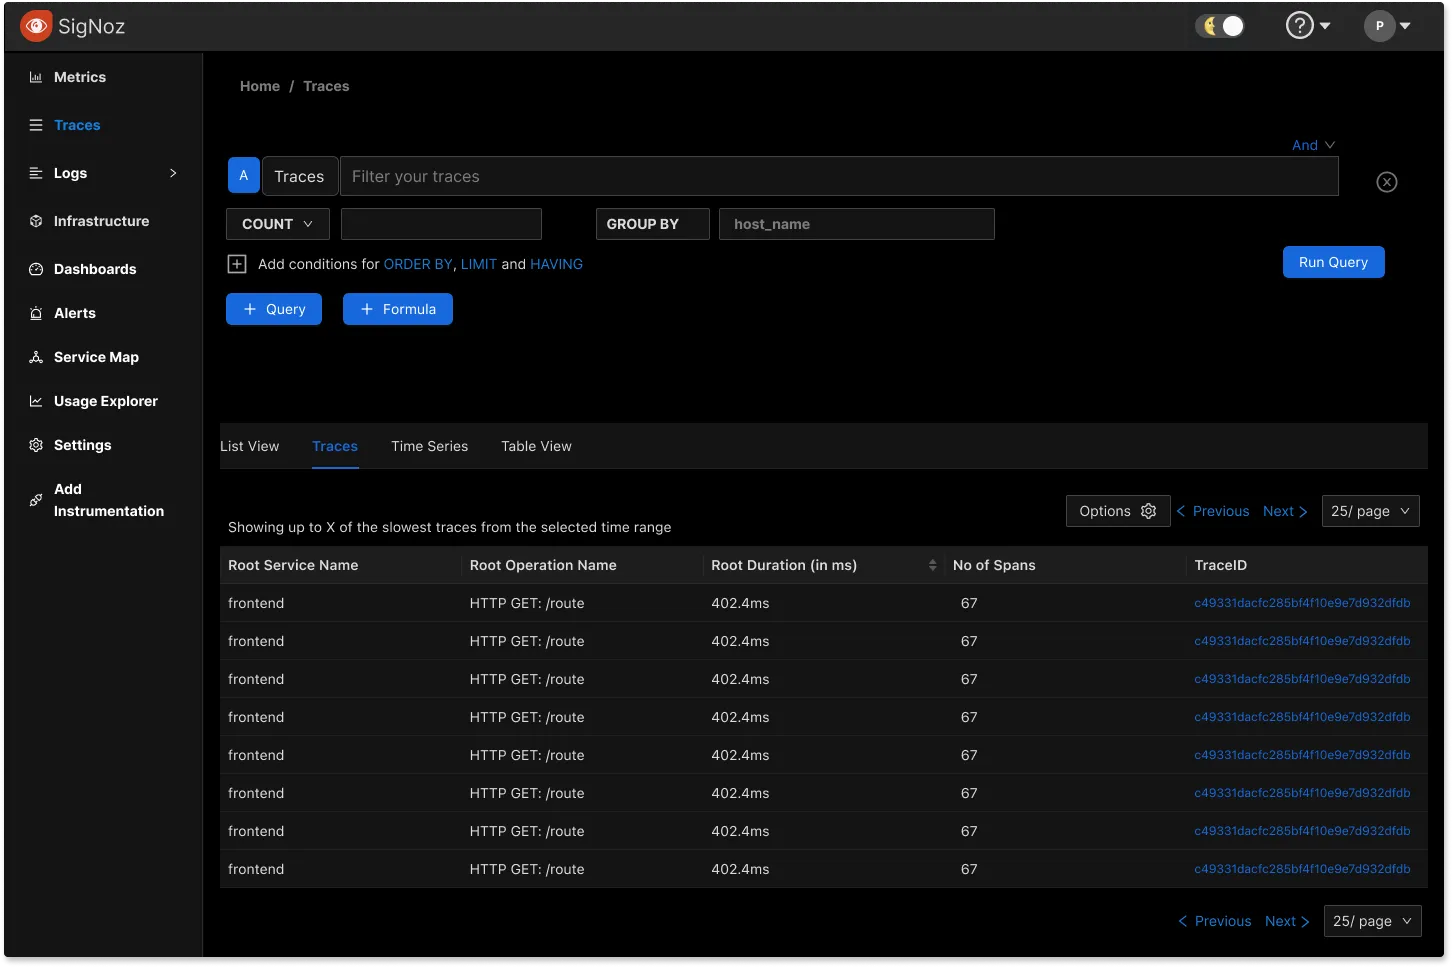
Our team is working on shipping an advanced Traces explorer tab. The new Traces explorer tab will have multiple views with improved filtering capabilities to analyze trace data. It will help our users drive contextual insights faster and have a much better user experience.
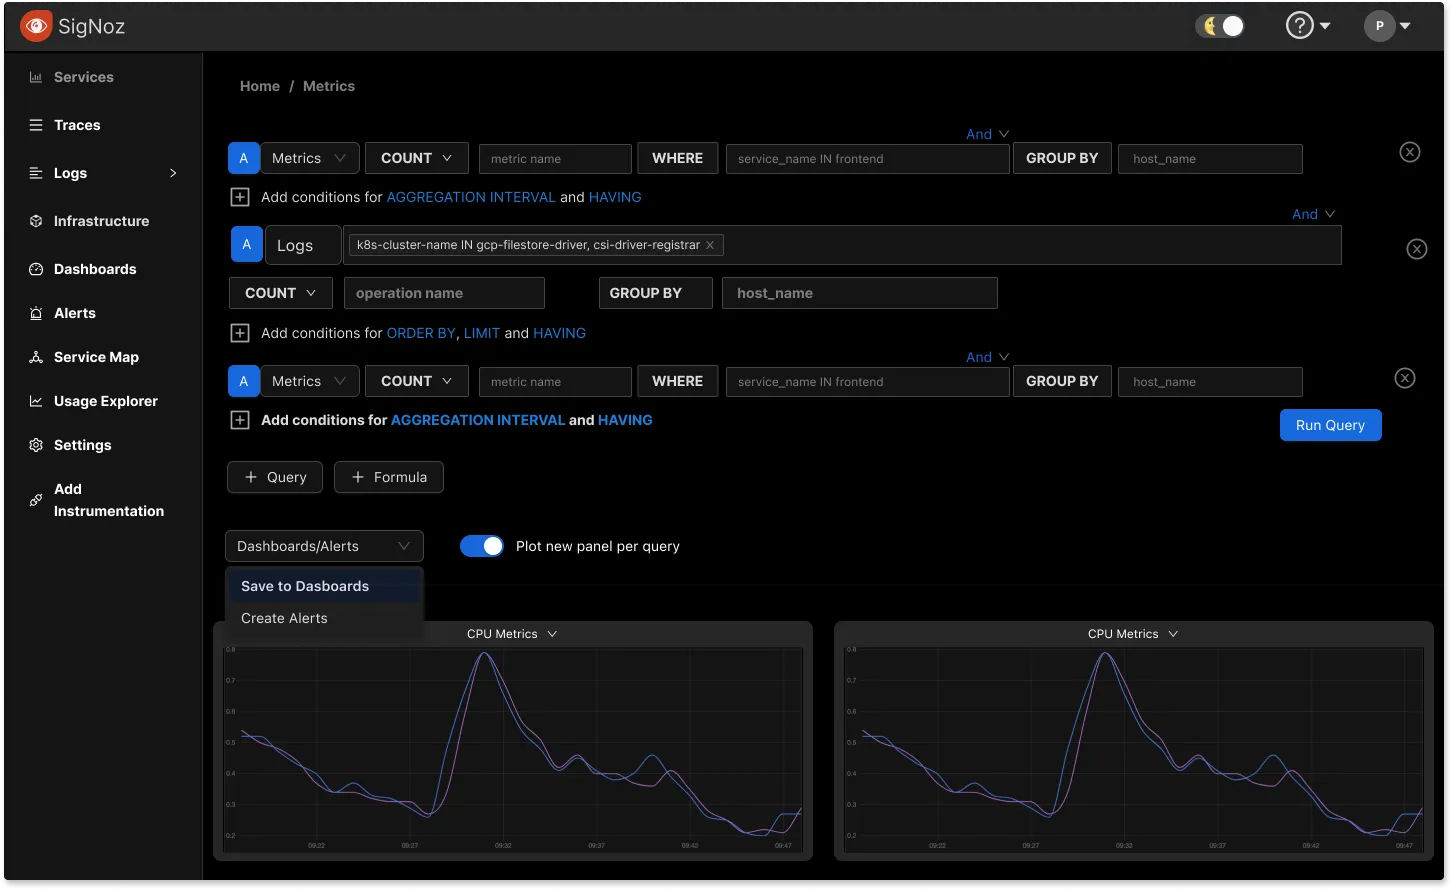
Our team is also working on an advanced metrics explorer page. With the new metrics explorer page, users will be able to combine multiple queries on different telemetry signals to dig much deeper into their observability data. With such advanced querying and charting capabilities, users will be able to realize the true potential of their observability data and cross correlate across different signals easily.
Featured issue
Creating Alerts from Dashboards Tab
Creating alerts on critical metrics is one of the fundamental features of a good monitoring solution. We are expanding our alerting capabilities by making it easier for users to create alerts on a diverse set of metrics.
You can create customized charts in SigNoz using our Dashboards tab. We will enable creating alerts while creating new charts on metrics in our Dashboards tab. If you have more ideas or feedback on useful use cases for alerts, please feel free to comment on this GitHub issue.
SigNoz News
2000+ Slack Community Members
We have crossed an important milestone of 2,000+ developers in our slack community 🚀🥳
When we started, this seemed like a far-fetched dream - thousands of developers joining us in our journey of democratizing open-source observability. We are very thankful to the developer community for all the support and love. 🙏
Our slack community is a place where you can discuss things like Observability, OpenTelemetry, and open source. Join our slack community here.
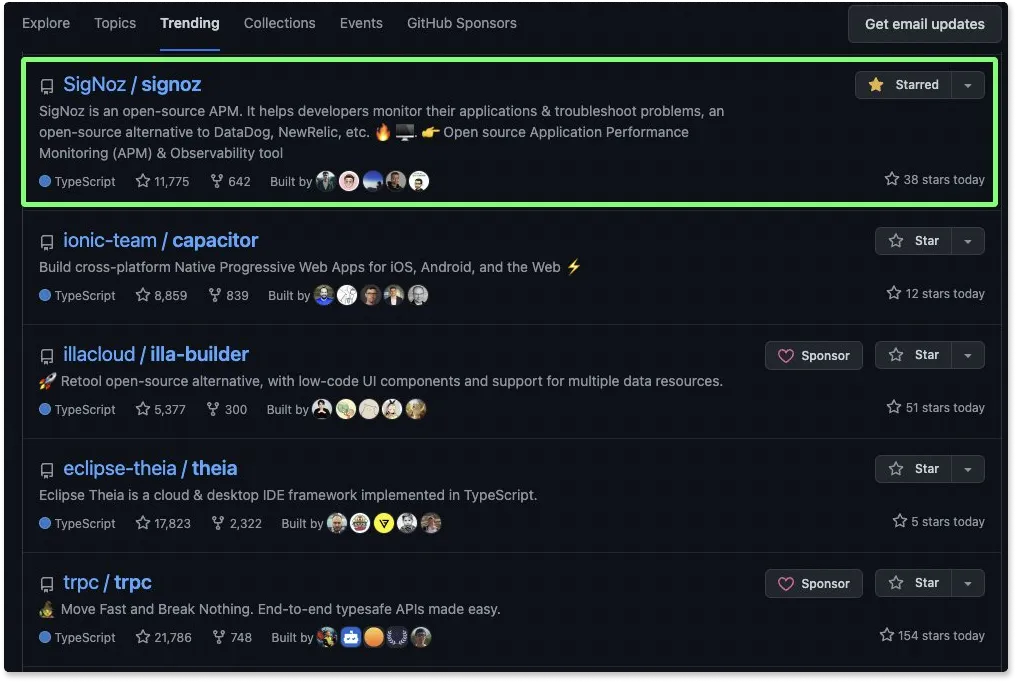
Trending on GitHub
We were trending on GitHub for the Typescript language. It’s amazing to get the continued support of the developer community in our journey of democratizing observability.
Community Shoutout
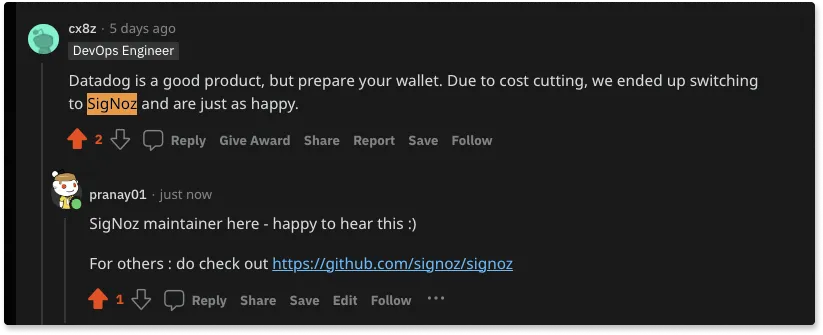
We are happiest when our users give us testimonials. Some user shoutouts that made us happy recently.
We have built SigNoz to support engineering teams of all sizes, and we’re happy to see our users getting as much value out of SigNoz as popular closed-source SaaS APMs.
We are also getting recognized in the community as one of the top open source projects from India.

Contributor Highlight
Every month, contributors from our community help make SigNoz better. We want to thank the following contributors who made contributions to SigNoz last month 🤗


From the Blog
OpenTelemetry consists of several main components. OpenTelemetry specification is organized into distinct telemetry types called signals. Currently, OpenTelemetry supports three telemetry signals: traces, metrics, and logs. Understanding OpenTelemetry architecture is the key to utilizing it for setting up a robust observability framework.
Read our guide on OpenTelemetry architecture to understand the key design principles.
OpenTelemetry Architecture - Understanding the design concepts
Thank you for taking out the time to read this issue :) If you have any feedback or want any changes to the format, please create an issue.
Feel free to join our slack community and say hi! 👋