Crossed 15K+ GitHub Stars, Simplified Logs Parsing with Pipelines & Trending on Hacker News - SigNal 30
"Make something people want.”
YC’s Motto
Welcome to the 30th edition of our monthly product newsletter - SigNal 30!
Last month, our Github repo crossed 15k+ Github stars, which is a great milestone for our open-source project and for our team. We also shipped the much-awaited logs pipeline that will make logs parsing a much better experience for our users.
We also shipped other improvements to the product, hosted OpenTelemetry meetups and webinars, and much more.
Let’s dive in to see what humans at SigNoz were up to in the month of October 2023.
What we shipped?
We shipped the logs pipeline in our latest release. We also shipped improvements to APM charts and the alerts dashboard.
Latest release - v0.33.0
Previous Releases - v0.32.1, v0.32.0, v0.31.1
Simplified Logs Parsing with Logs Pipeline
With the newly shipped logs pipeline, it’s much easier to parse logs in SigNoz. Log parsing is an important step in monitoring logs effectively. Earlier, this process was cumbersome and required configurations in the OpenTelemetry Collector config files.
Log pipeline allows you to preprocess your logs for enrichment, transformation, and attribute extraction before they get indexed.
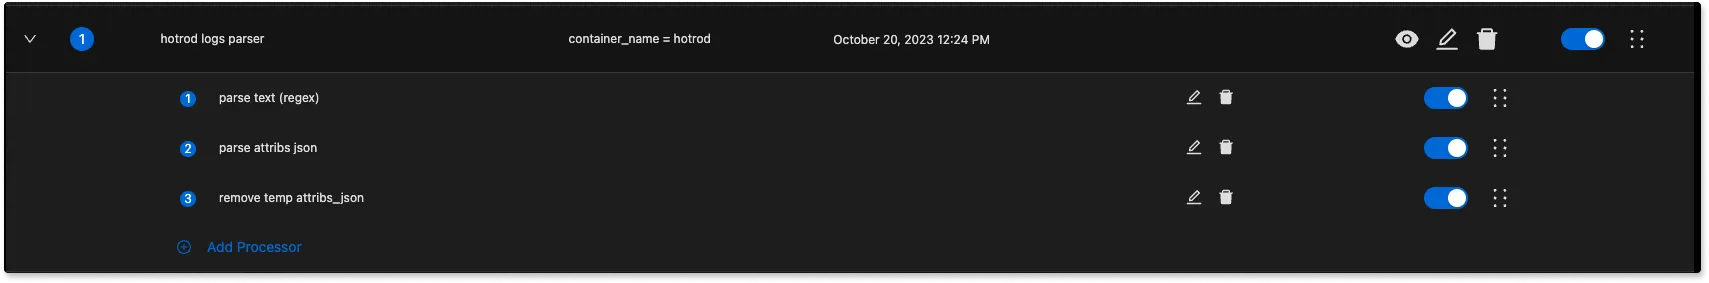
Each pipeline is a processor in the OTEL collector config. You can access the logs pipeline in the logs tab. Here’s a quick demo of the logs pipeline feature. In this demo, we parse Nginx logs using the logs pipeline feature in SigNoz.
You can apply a chain of processors to each pipeline to extract what you want from your logs. There are different processors like grok, regex, move, copy, add, etc., to make log parsing easy.
We hope this feature improves your logs experience with SigNoz. We would love some feedback on it on how to improve it further. You can create a GitHub issue with your feedback.
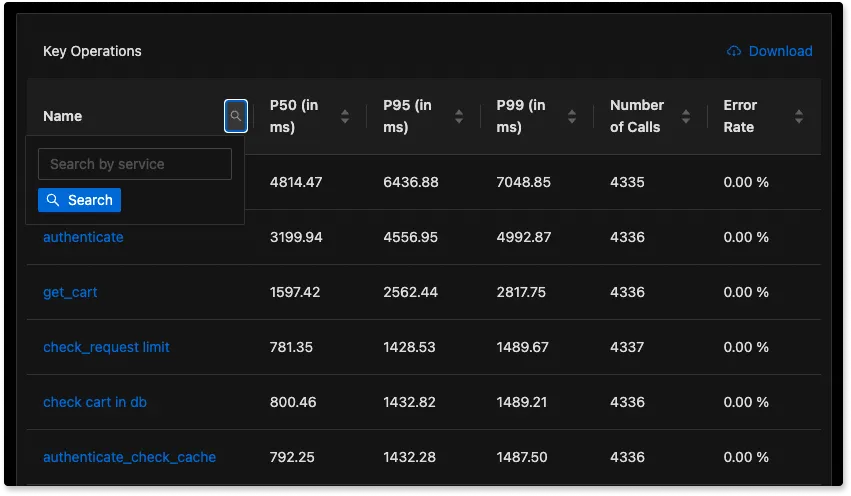
Search and Download feature for Key Operations in APM charts
We have shipped a search feature to search key operations in APM charts. You can also download the list as a CSV or Excel file to share with your team.
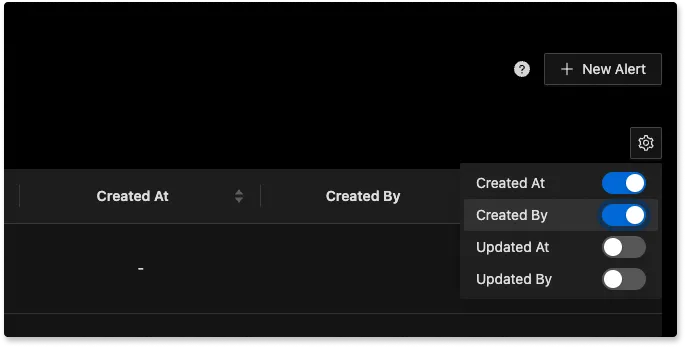
Improvements in Alerts Tab
In the Alerts tab, you can now add columns for Created At, Created By, Updated At, and Updated By. This will help you monitor changes in alert rules and improve collaboration with your teammates.
SigNoz Webinars
OpenTelemetry Webinars: Apache Kafka and OTLP data
In this webinar, Ankit and Nica talked about the benefits of a Kafka queue for OTLP data. While OpenTelemetry collectors primarily hold data in memory, Kafka's strength lies in its ability to handle traffic surges efficiently and provide a robust system to manage data surges.
One of the challenges in observability is the potential loss of telemetry data. This can be due to network issues, system downtimes, or even misconfigurations. Kafka addresses this challenge by acting as a buffer, ensuring that data is not lost during transient failures. It provides a mechanism to handle large volumes of data, especially during traffic spikes, ensuring that the backend systems are not overwhelmed.
Check out this webinar to understand how you can utilize Kafka with OpenTelemetry Collectors.
OpenTelemetry for AI: OpenLLMetry with SigNoz and Traceloop
We did a webinar in collaboration with Tracetest on OpenTelemetry-native observability for machine learning algorithms, especially LLMs. In this webinar, Nica and Nir discuss how machine learning can be monitored with OpenTelemetry.
SigNoz News
Crossed 15,000+ Github stars
We recently surpassed 15,000 GitHub stars. We are deeply grateful to the developer community for their ongoing support in our mission to democratize open-source observability.
We remain committed to enhancing SigNoz, making it an even better product for engineering teams of all sizes.
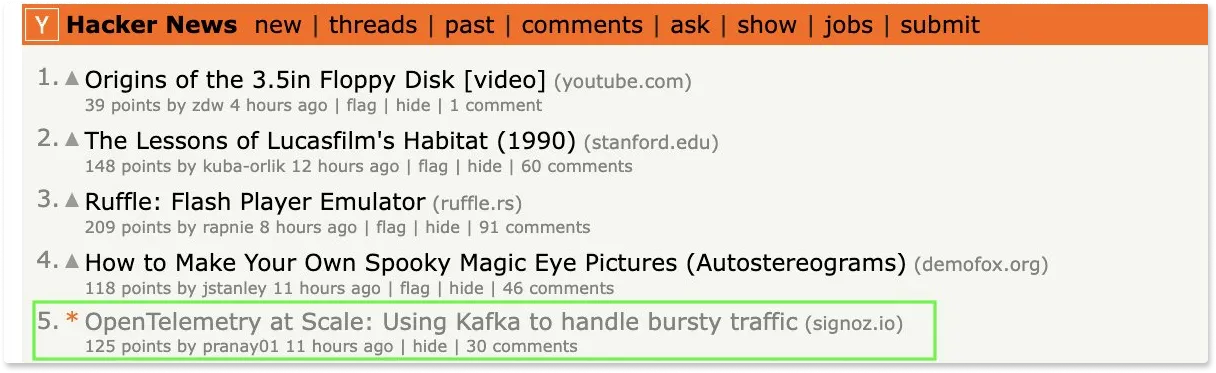
Trending on HackerNews with our article
Our article on scaling OpenTelemetry architecture with Apache Kafka was tending on Hacker News in the top 5 globally. The article talks about both multi-collector architecture and how Apache Kafka can be helpful there.
It’s always nice to see our content resonate with the developer audience.
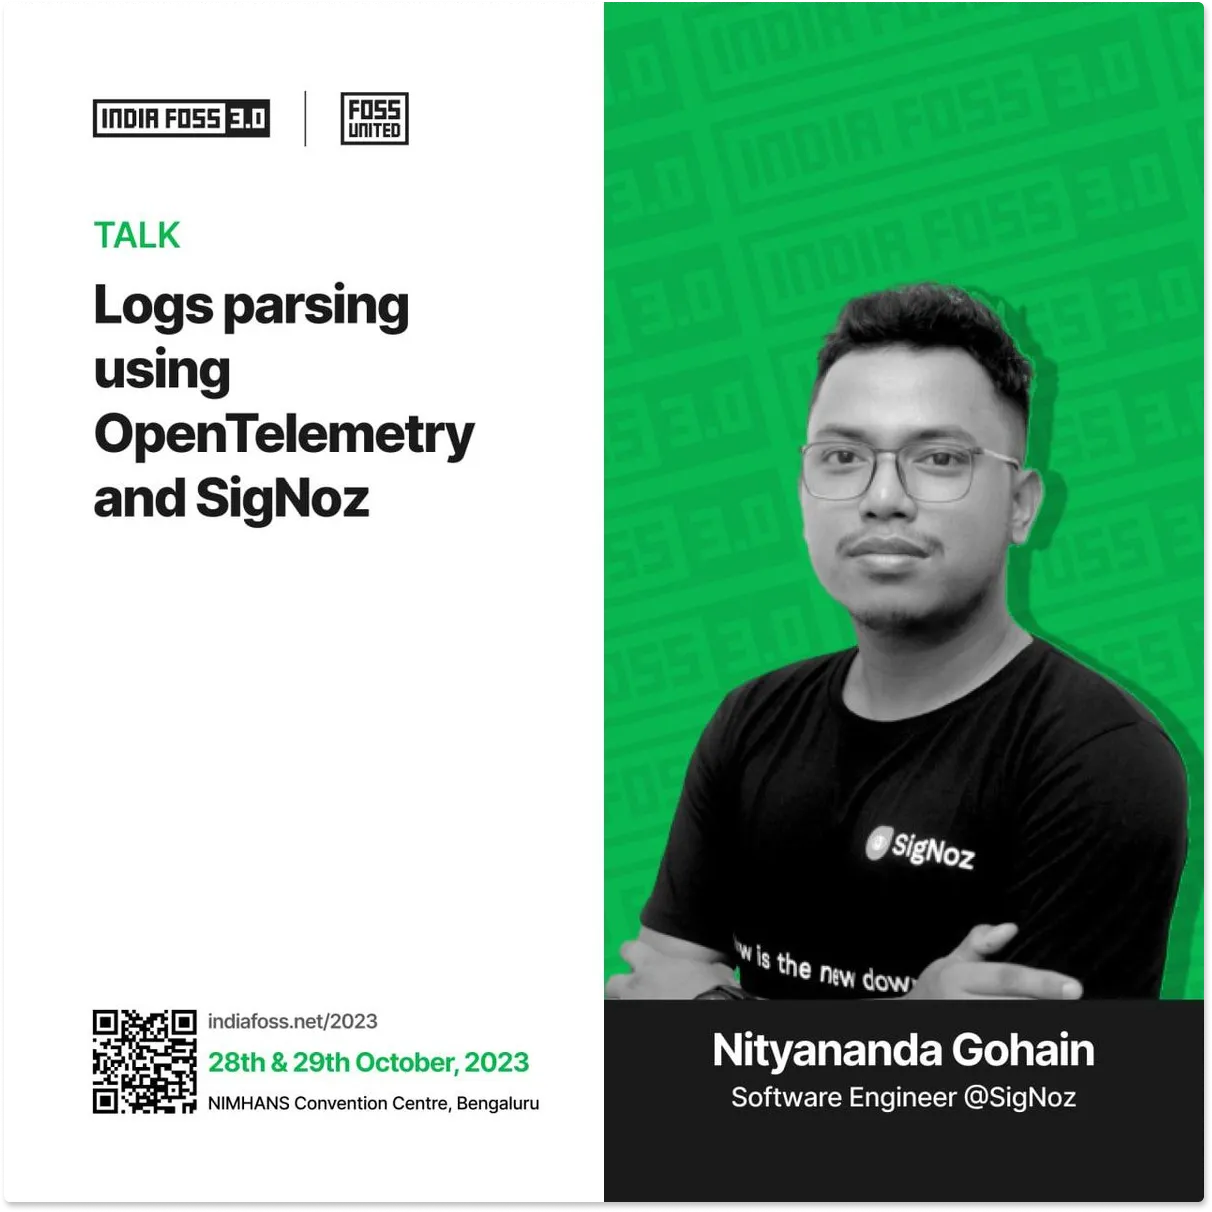
Talk at India Foss 3.0 on OpenTelemetry Logs Parsing
Our very own Nityanand Gohain presented a talk at the recently held conference by FOSS India in Bengaluru. The topic was “Logs parsing using OpenTelemetry and SigNoz.”
With our new logs pipeline, we’re aiming to make the logging experience in SigNoz a breeze.
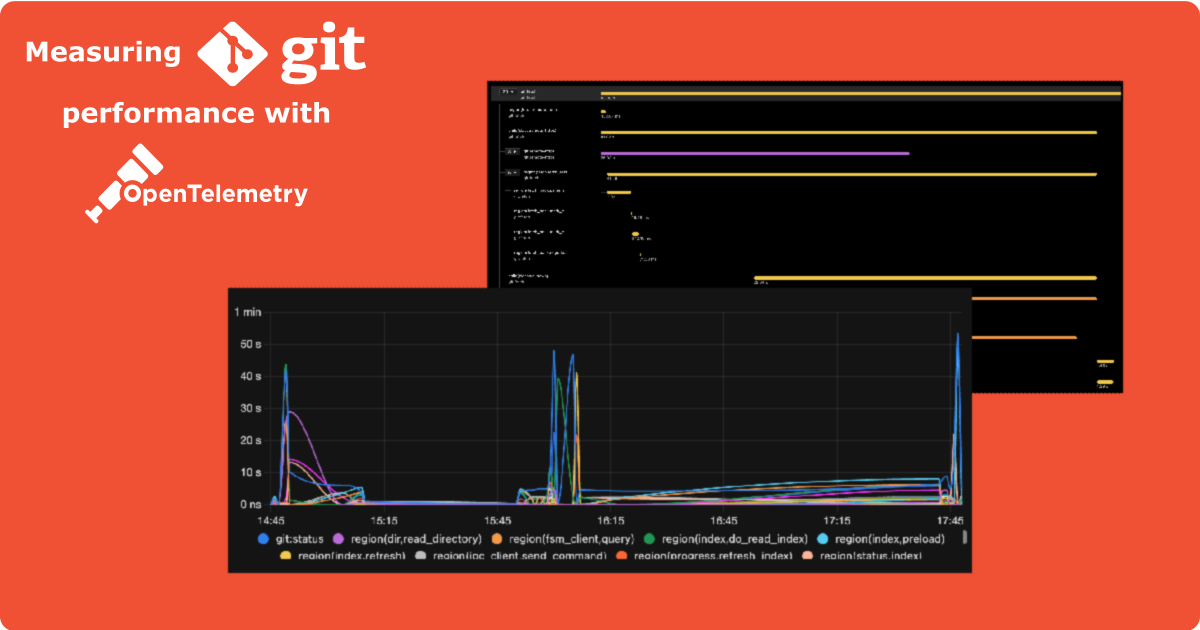
GitHub Team using SigNoz for OpenTelemetry Visualizations
It was great to see SigNoz featured in a blog by the GitHub team. They have written an article on measuring Git performance with OpenTelemetry and are using SigNoz for trace visualizations.
SigNoz is best suited for visualizing OpenTelemetry data as it has been OpenTelemetry-native since day 1. It’s nice to see great engineering teams using SigNoz and optimizing their applications.
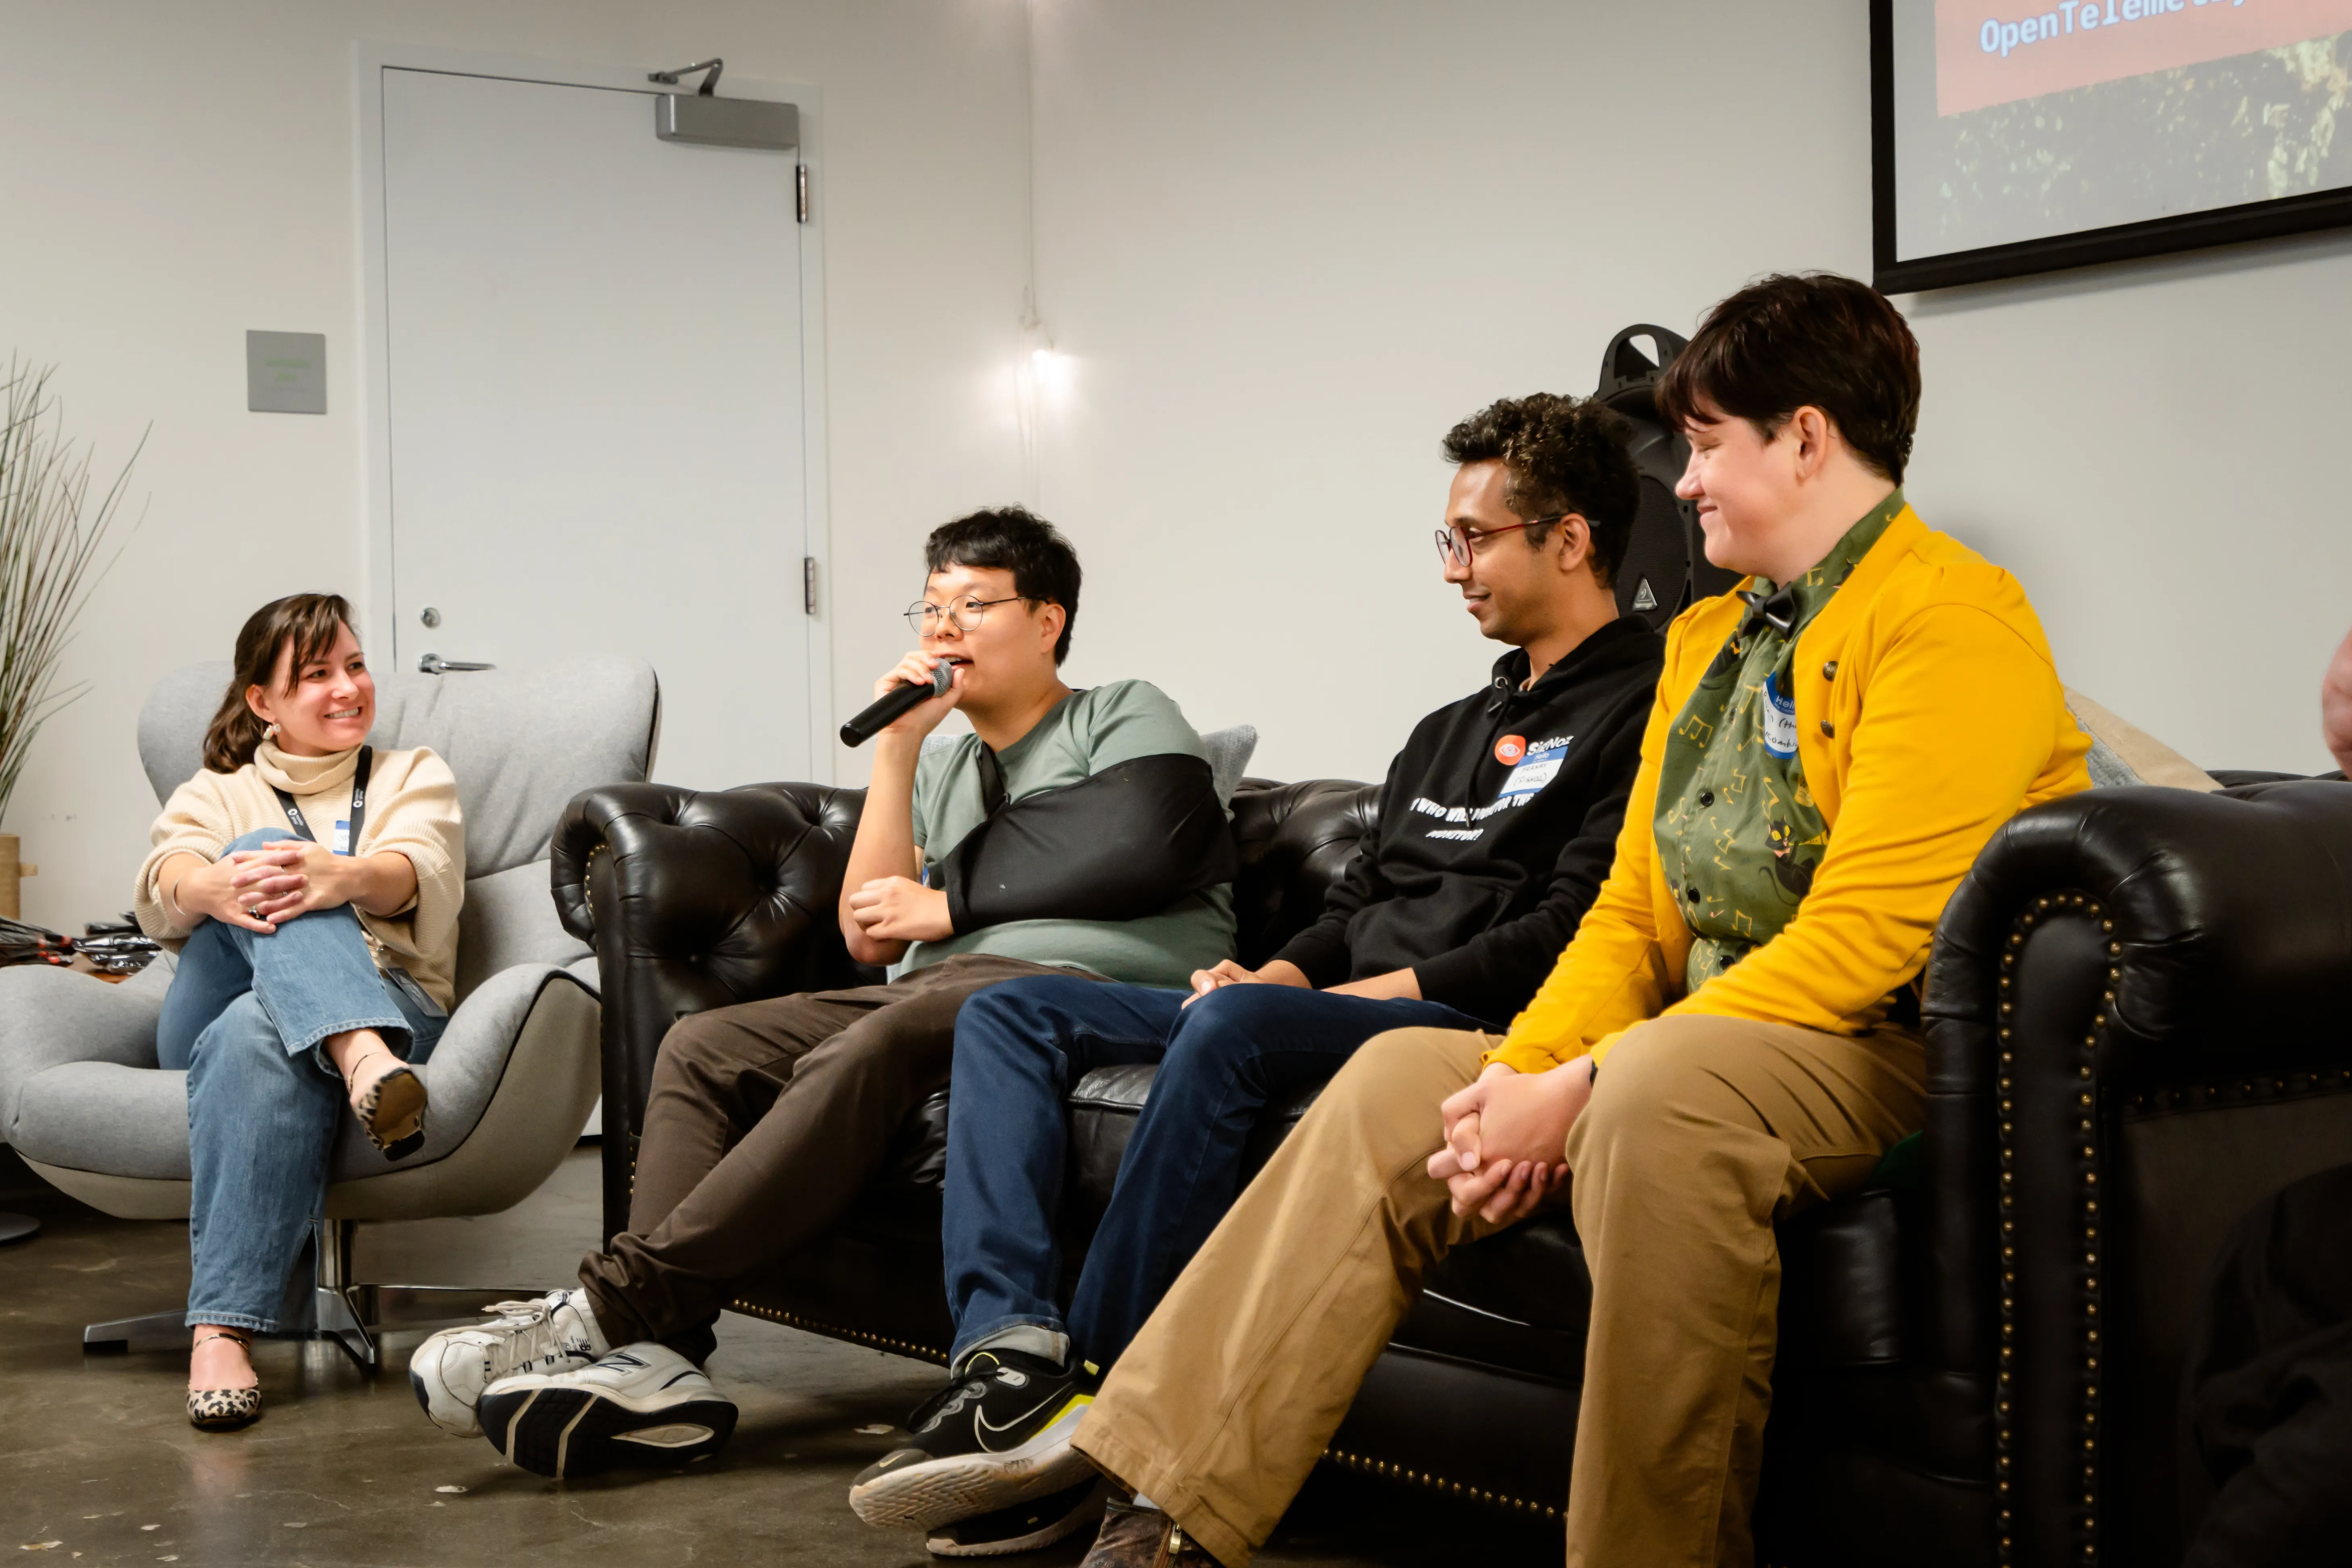
OpenTelemetry meetup in SF
We hosted an in-person meetup around OpenTelemetry and Observability in San Francisco. It was great to meet up with folks using OpenTelemetry, and we had some great discussions about what’s happening in the OpenTelemetry ecosystem.
Contributor Highlight
Every month, contributors from our community help make SigNoz better. We want to thank the following contributors who made contributions to SigNoz last month 🤗


From the blog
RabbitMQ is a message broker, which means it acts as an intermediary that takes in messages from one application and routes them to the correct destination application. RabbitMQ ensures message reliability through features like acknowledgments, message persistence, and retries. It also supports various messaging patterns, including point-to-point and publish-subscribe, making it a versatile solution for decoupling components and enabling asynchronous communication.
Check out this guide on RabbitMQ monitoring, where you will learn about key metrics that need to be monitored and built-in tools that can help you with it.
Key Metrics & In-Built RabbitMQ Monitoring Tools
Thank you for taking out the time to read this issue :) If you have any feedback or want any changes to the format, please create an issue.
Feel free to join our Slack community and say hi! 👋