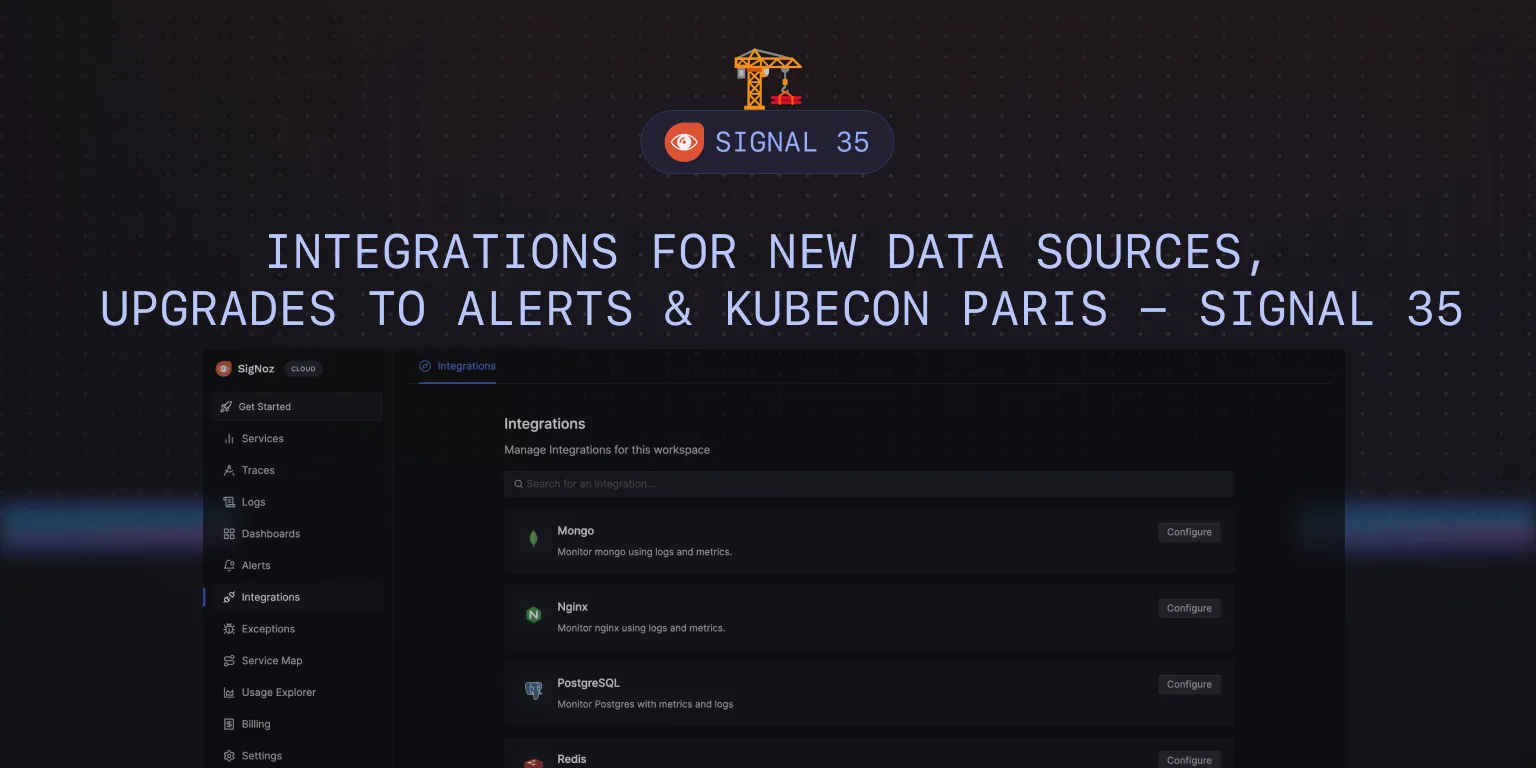
Integrations for new Data Sources, Upgrades to Alerts & Kubecon Paris - SigNal 35
"Greatness is not intelligence. Greatness comes from Character. And Character is not formed out of smart people but from people who have suffered"
-Nvidia CEO Jensen Huang
Welcome to the 35th edition of our monthly product newsletter - SigNal 35!
We have made significant advancements in enhancing our product. The integration feature we shipped will enable quick-start monitoring for popular technologies in SigNoz.
Let’s see what humans of SigNoz were up to in the month of March 2024.
What we shipped?
Latest release - v0.42.0
Previous Releases - v0.41.1, v0.40.0
Quick-Start Monitoring with Seamless Integrations
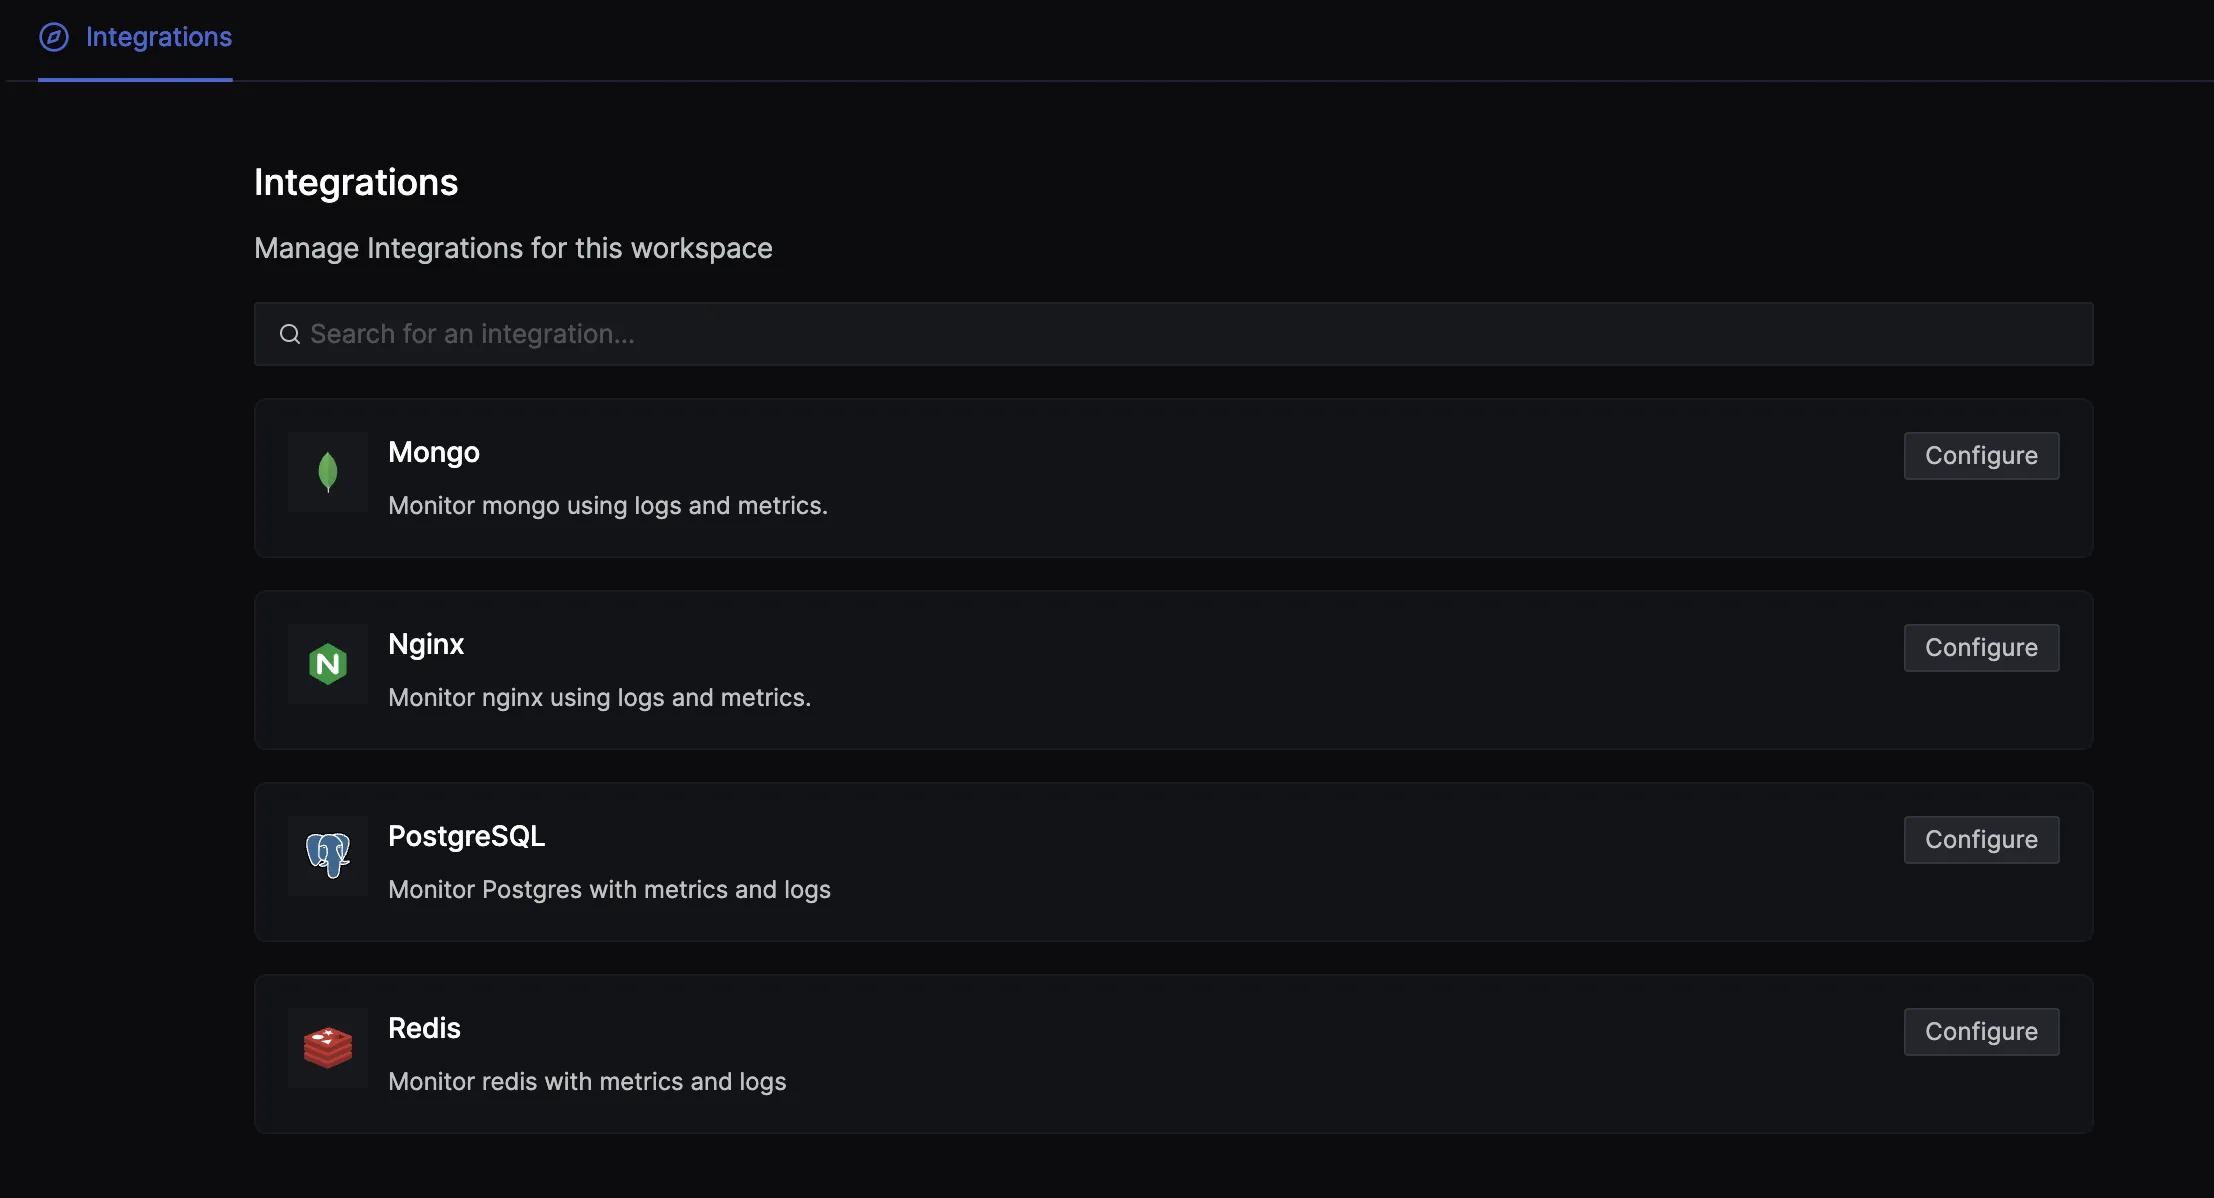
We have shipped integrations for MongoDB, Nginx, PostgreSQL, and Redis to make it easier for our users to set up monitoring for these technologies. After configuring the steps mentioned in the instructions, users can get access to pre-built dashboards with important logs and metrics from their integrations.
Go to Integrations tab and choose any integration that you need.
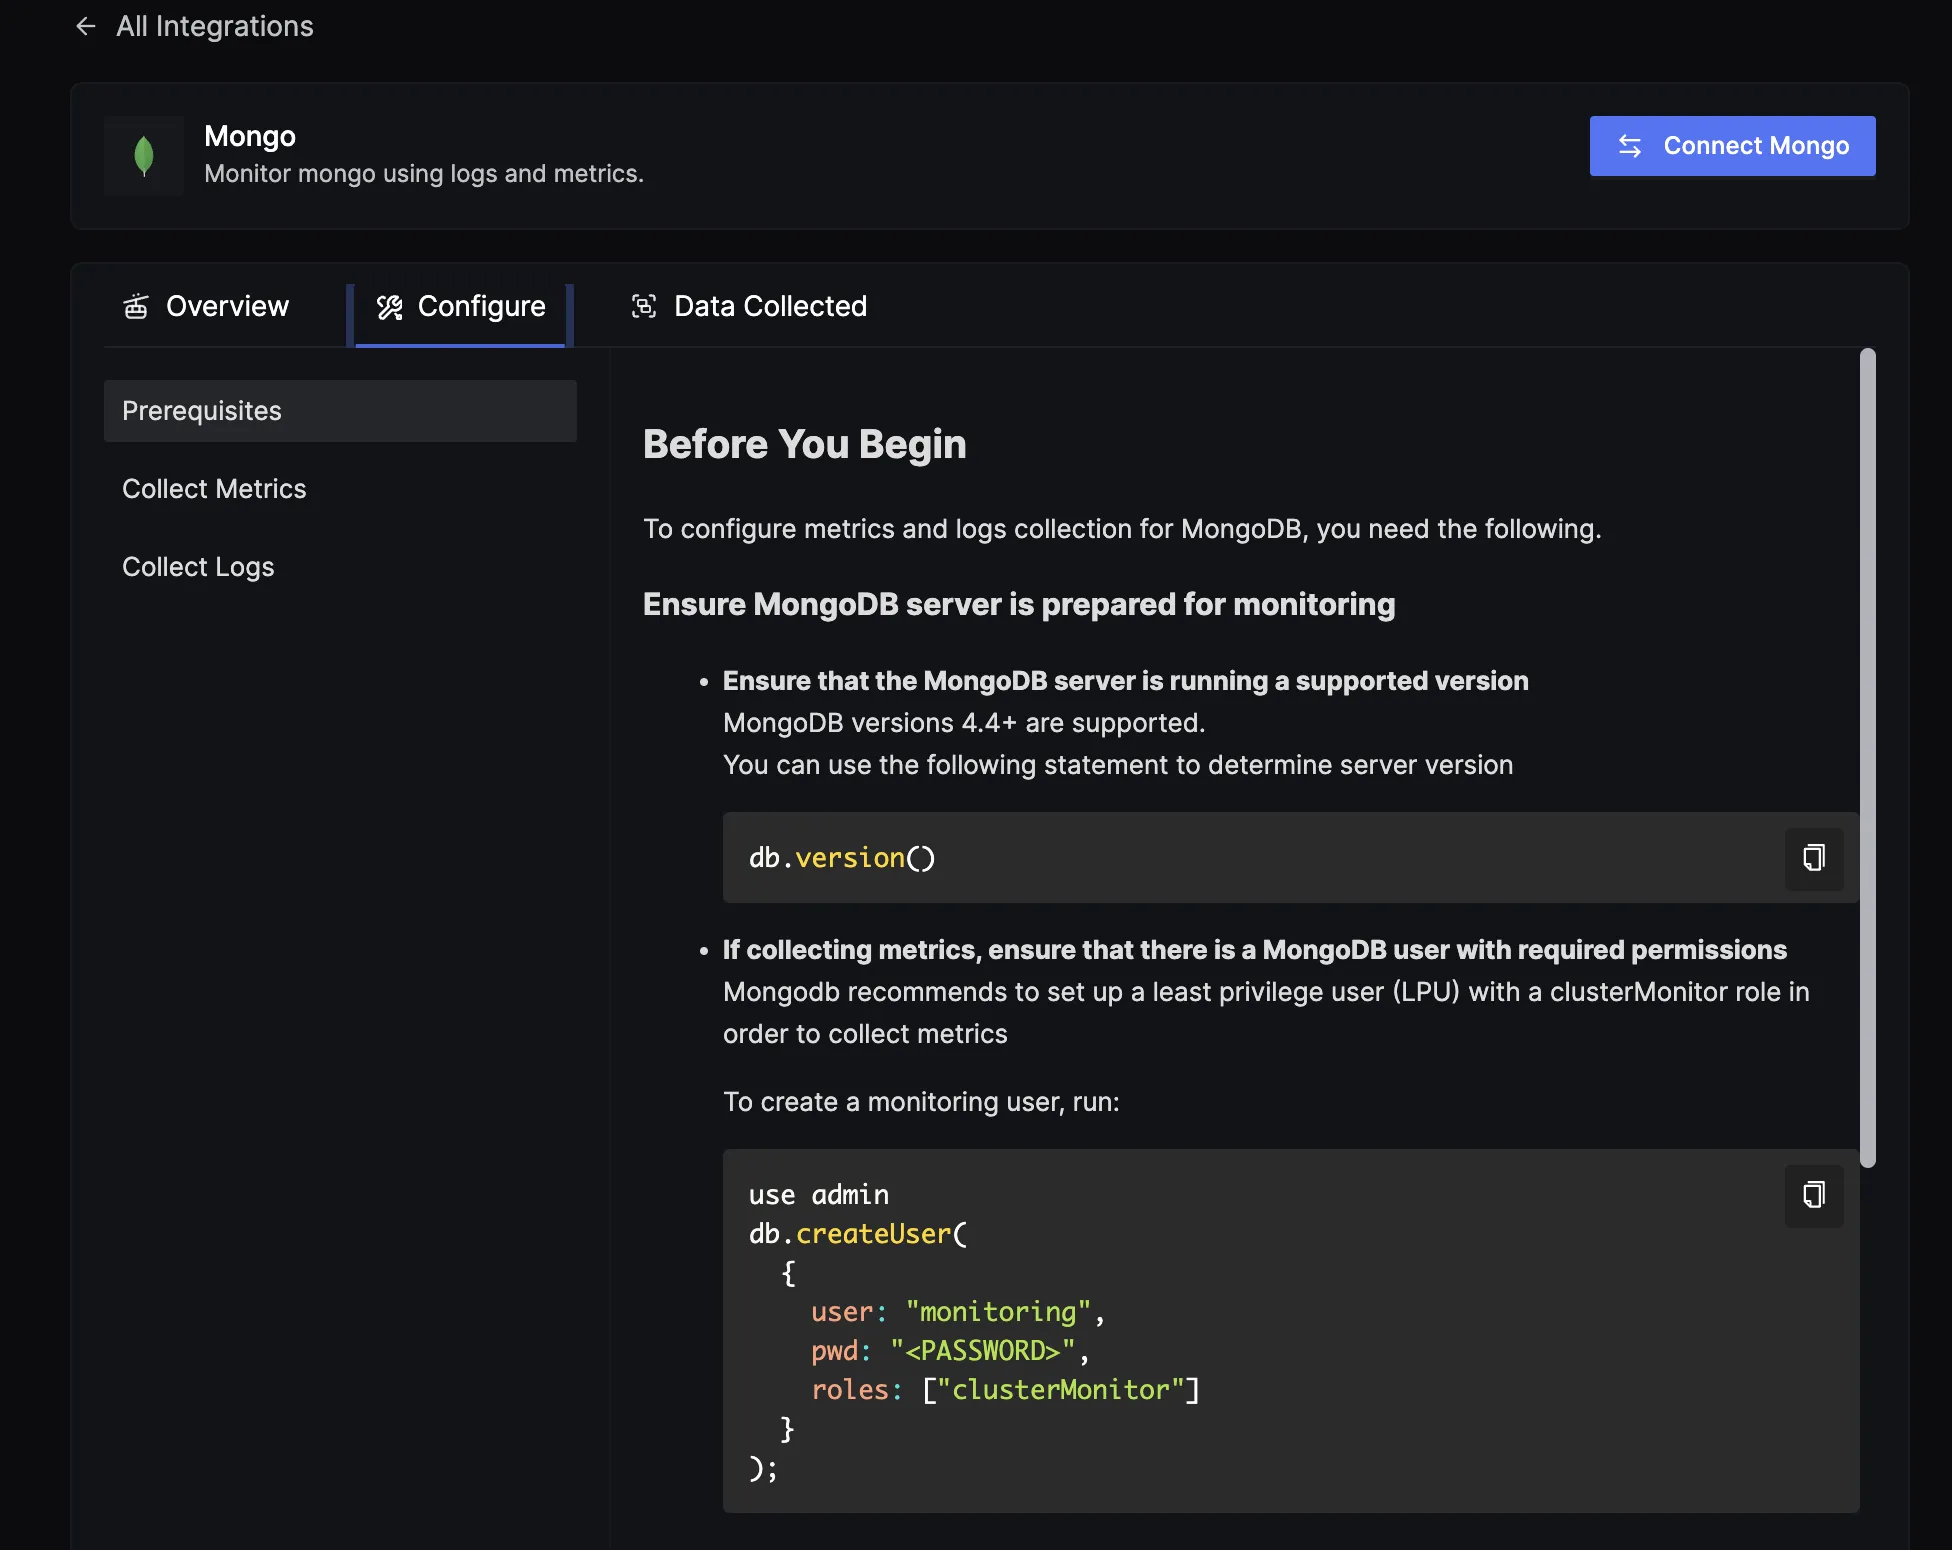
Configure the integrations with the steps mentioned under Configure tab. For example, you can configure your MongoDB integration to collect logs and metrics.
You can expect more integrations coming in future releases to make monitoring your application and infrastructure with SigNoz a breeze.
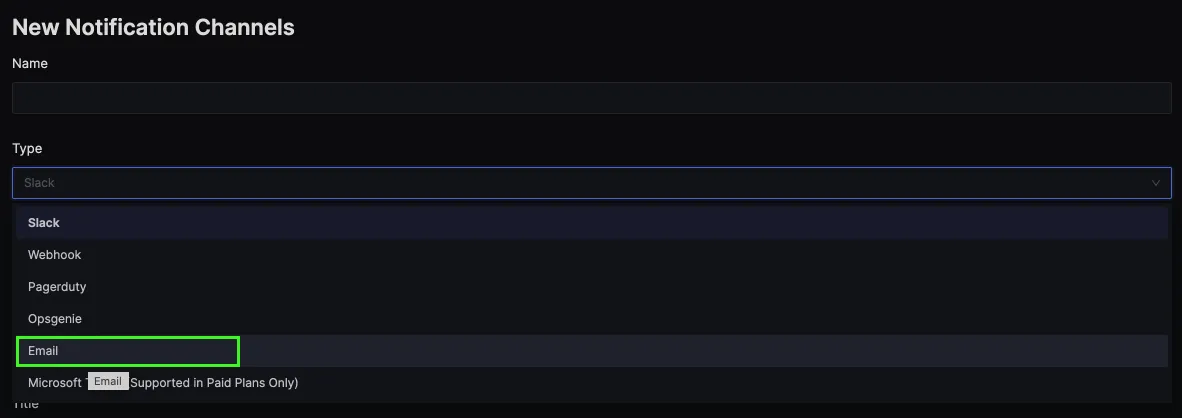
Support for Email as an alert channel
We have introduced support for Emails as an alert channel. SigNoz users now have the ability to receive alerts directly in their inboxes, making it easier than ever to stay on top of critical issues as they happen.
Upgraded functionalities for setting up alerts
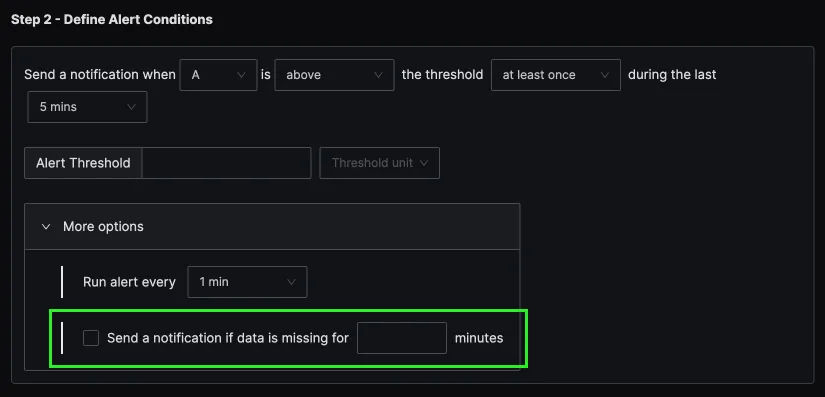
Support for Alerts on Missing Data
We've enhanced our alert configuration options to include alerts for missing data, applicable across all signal types - metrics, traces, and logs. This feature proves invaluable in scenarios where certain hosts or segments of your application cease transmitting data, ensuring you're immediately alerted to potential issues or downtimes.
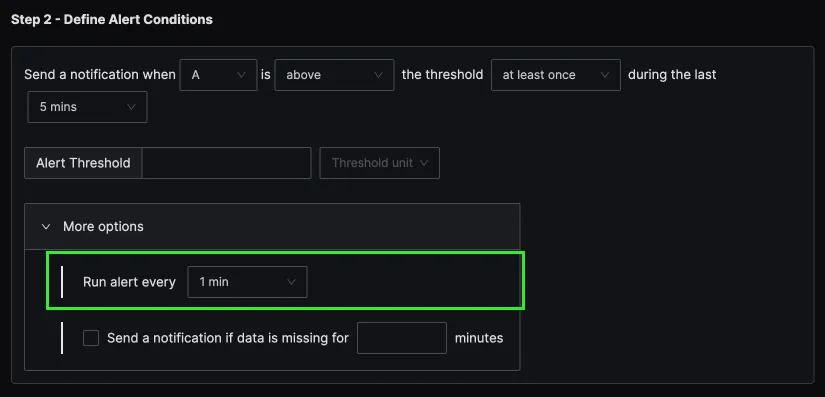
Ability to customize the alert frequency
Earlier, each alert condition was checked every 1 minute, and it was not configurable to change this. Now, you can click on More Options to configure how frequently you want your alerts to run.
It is useful to users in some use cases and helps them with some computing costs. For example, an external data system might send data every three hours. You can set the alert frequency to check alert thresholds accordingly.
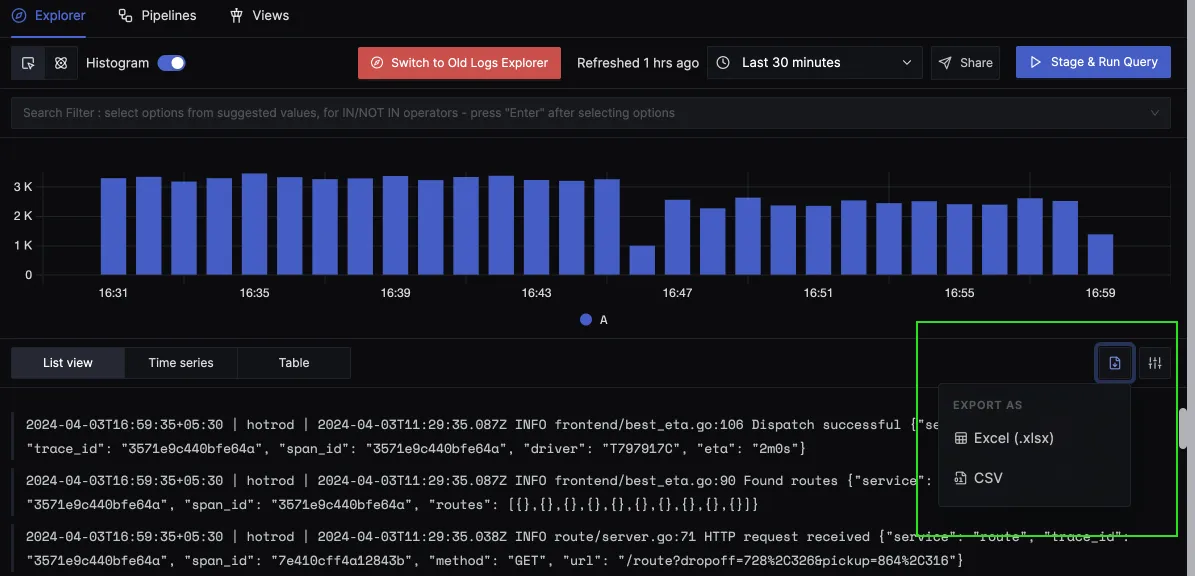
Download logs in Excel and CSV format
You can download your filtered logs in Excel and CSV format from our logs explorer page. This comes in handy in use cases where you are required to share some specific logs with folks who don’t have access to SigNoz.
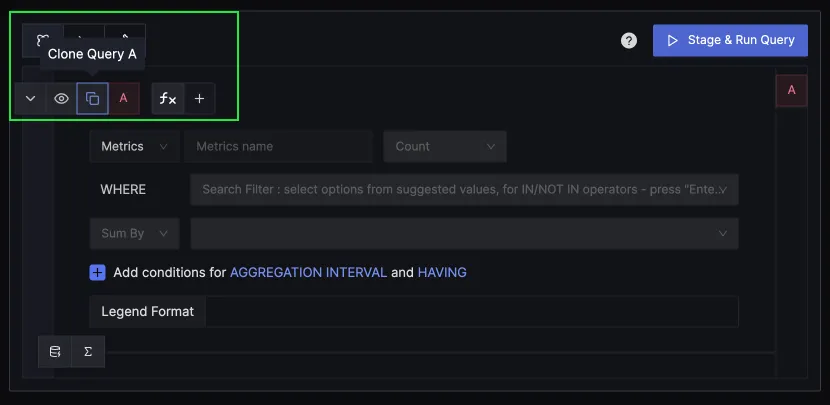
Ability to clone queries in query builder to quickly build complex queries
The query builder is one of SigNoz's most powerful features. We have added the ability to clone a query in our query builder. This will help users start from a previous query and build complex queries faster.
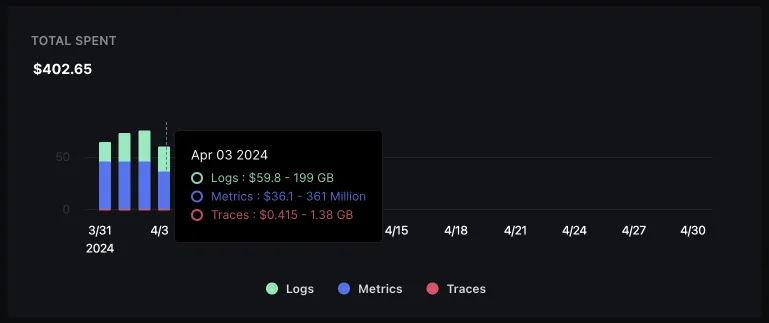
Daily breakdown in billing for better transparency
For SigNoz Cloud users, we've introduced a new feature that shows daily costs based on how different signals are used in the Billing tab. This way, we help our users understand their SigNoz usage better and make sure they're getting real value for their money.
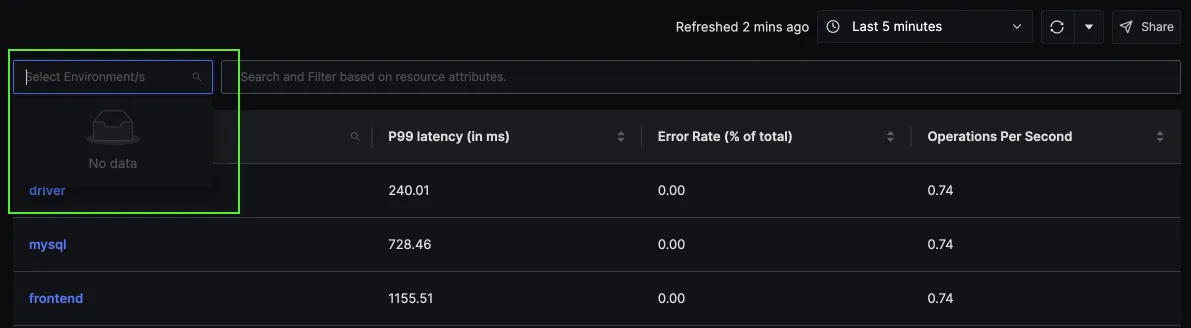
Ability to filter services based on their environment
Now, in the Services tab, you can filter services by their environment—like dev, prod, and staging. This makes it easier to check how services perform in different settings, helping users quickly get the insights they need.
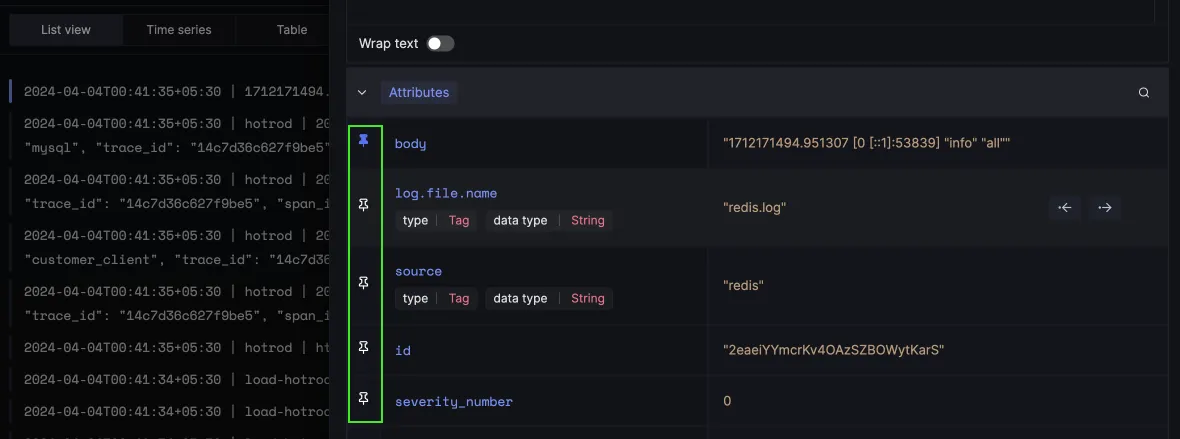
Ability to pin common attributes in the logs context tab
You can now pin commonly occurring attributes to identify your logs quickly in the logs context tab. Logs context tab is accessible by clicking on any log line that you want to view.
Select and change variables even when dashboards are locked
In many use cases, you might find it necessary to implement role-based access controls to allow different users within your organization to access dashboards. However, while you may not want someone to alter any configurations, you might still want to enable them to analyze the data using different variables. Now, you can select and change variables even when dashboards are locked, enhancing flexibility without compromising on security.
SigNoz News
SigNoz at Kubecon Paris
SigNoz team was at Kubecon Paris, and this time we were delighted to present a talk too. Srikanth, our in-house OpenTelemetry expert, talked about building dynamic observability pipelines using OpAMP in OpenTelemetry.
If you want to see this feature in action, check out the Pipelines feature in our logs module which enables you to parse and update attributes in ingestion time. So, you no longer need to configure all the attributes/parsing during log generation or collection.
Here’s a full video of the talk 👇
OpenTelemetry doctors in the house, including Srikanth from our team 👇

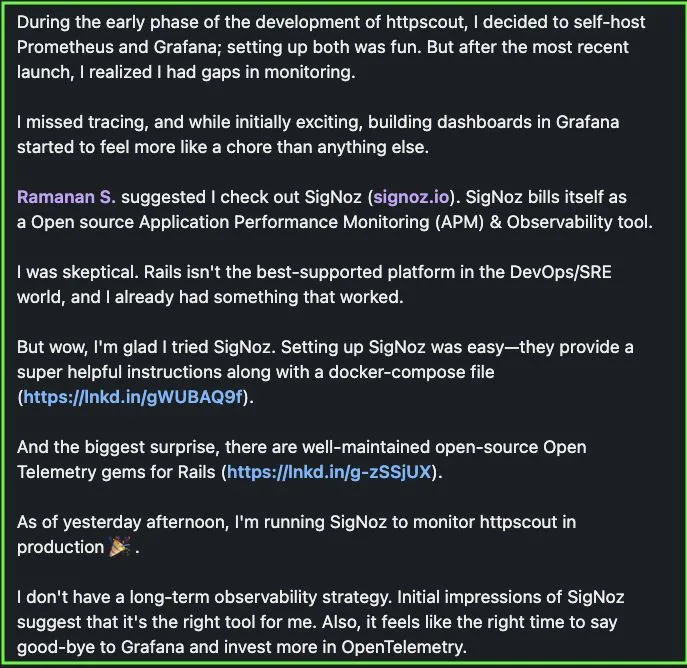
User Shoutout
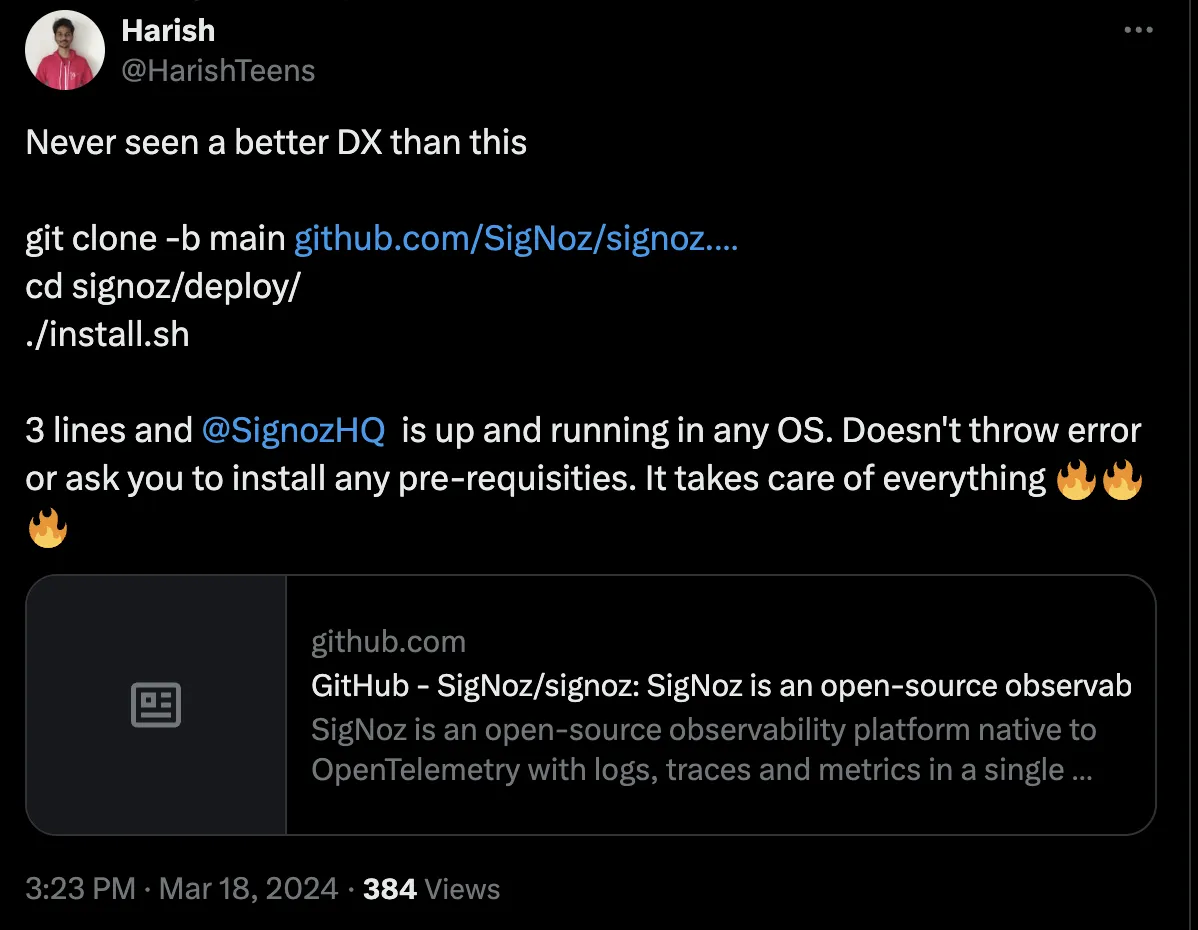
Developers are choosing SigNoz over the Grafana + Prometheus setup because of the ease of getting started and having logs, metrics, and traces under a single pane of glass.
We are always motivated when users of SigNoz love their experience with our product. And yes, you can get started with open-source SigNoz in three lines:
git clone -b main https://github.com/SigNoz/signoz.git
cd signoz/deploy/
./install.sh
Contributor Highlight
Every month, contributors from our community help make SigNoz better. We want to thank the following contributors who made contributions to SigNoz last month 🤗


From the blog
We have published a guide on API monitoring covering API basics and the critical aspects of API monitoring, including availability, performance, and security, and highlights key metrics for monitoring API health.
The post also reviews top tools for API monitoring and best practices and emphasizes the critical role of monitoring in ensuring API reliability, performance enhancement, and security.
Check out the full guide on API monitoring.
Thank you for taking out the time to read this issue :) If you have any feedback or want any changes to the format, please create an issue.
Feel free to join our Slack community and say hi! 👋