Spans - a key concept of distributed tracing
Spans are fundamental building blocks of distributed tracing. A single trace in distributed tracing consists of a series of tagged time intervals known as spans. Spans represent a logical unit of work in completing a user request or transaction.
Distributed tracing is critical to application performance monitoring in microservice-based architecture. Before we deep dive into spans, let's have a brief overview of distributed tracing.
What is distributed tracing?
In a microservices architecture, a user request travels through hundreds, even thousands of services before serving the user what they need. Engineering teams often responsible for maintaining single services have no visibility over how the system performs as a whole.
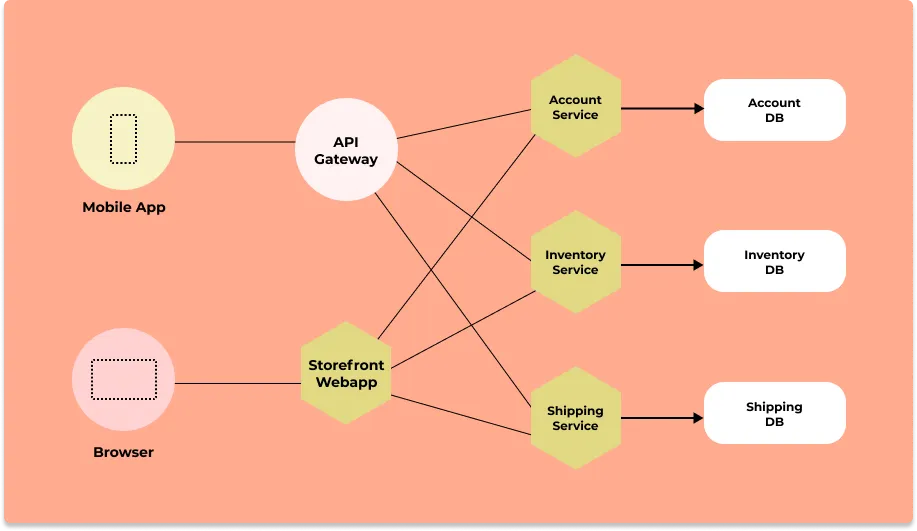
Distributed tracing gives insights into how a particular service is performing as part of the whole in a distributed software system. It involves passing a trace context with each user request which is then passed across hosts, services, and protocols to track the user request.
These requests are broken down into spans, and the entire request is represented by a trace.
What is a Trace?
A trace is a detailed representation of a request’s journey as it travels various services within a distributed system. It acts like a map, illustrating how the request moves through different components. A trace consists of multiple spans, each representing a discrete unit of work within a service (e.g., a network request or database query). These spans collectively form the entire path of the request through the system.
Traces provide visibility into the entire lifecycle of a request, from start to finish. This is particularly useful in understanding the flow of operations, identifying issues, and troubleshooting problems in software or systems.
What are spans in distributed tracing?
In distributed tracing, a user request or a transaction is represented by a trace. Traces are broken down into multiple spans. Spans represent a single logical operation within a trace. For example, a function call during a user request can be represented by a span.
Spans in distributed tracing
What are spans in distributed tracing?
Each unit of work in a trace is represented by a span. A trace represents a complete process for a request - from its initiation to its completion. The picture below shows one trace which is composed of multiple spans.
In the example shown below, the request is initiated from a frontend web client. The first span is the parent span which shows the total time taken by the request.
Parent span calls four services which form the child spans, namely:
- auth - to authenticate the user
- route - to find the nearest route
- driver - to allocate the nearest driver
- customer - to add customer details
These spans can then further have their own child spans.
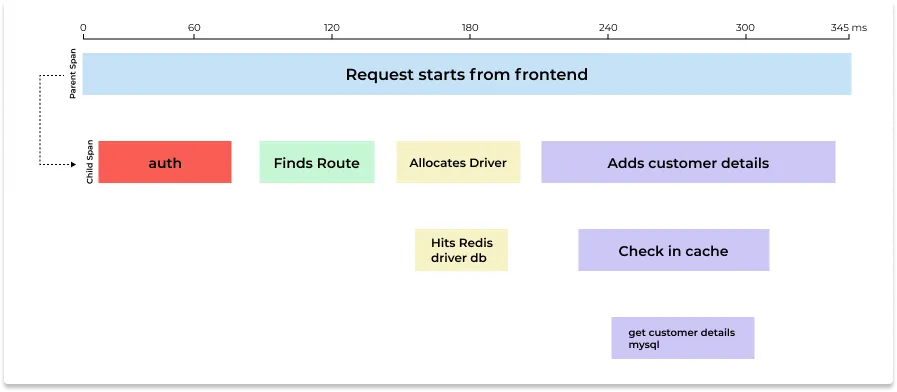
The first span is known as the parent span and the subsequent spans are child spans.
Parent Span:
Also known as root spans, a parent span encapsulates the end-to-end latency of an entire request. To explain it more clearly, let us define adding a product to a cart on an e-commerce website as a user request. The parent span will measure the time it took from the event of an end-user clicking a button to the product being added to the cart. The parent span can also end if some error occurs.
Child Spans:
A child span is triggered by a parent span and can be a function call, DB calls, calls to another service, etc. In the example mentioned above, a child span can be a function checking whether the item is available or not. Child spans provide visibility into each component of a request.
Combining all the spans in a trace can give you a detailed idea about how the request performed across its entire lifecycle.
What are spans composed of?
Span attributes:
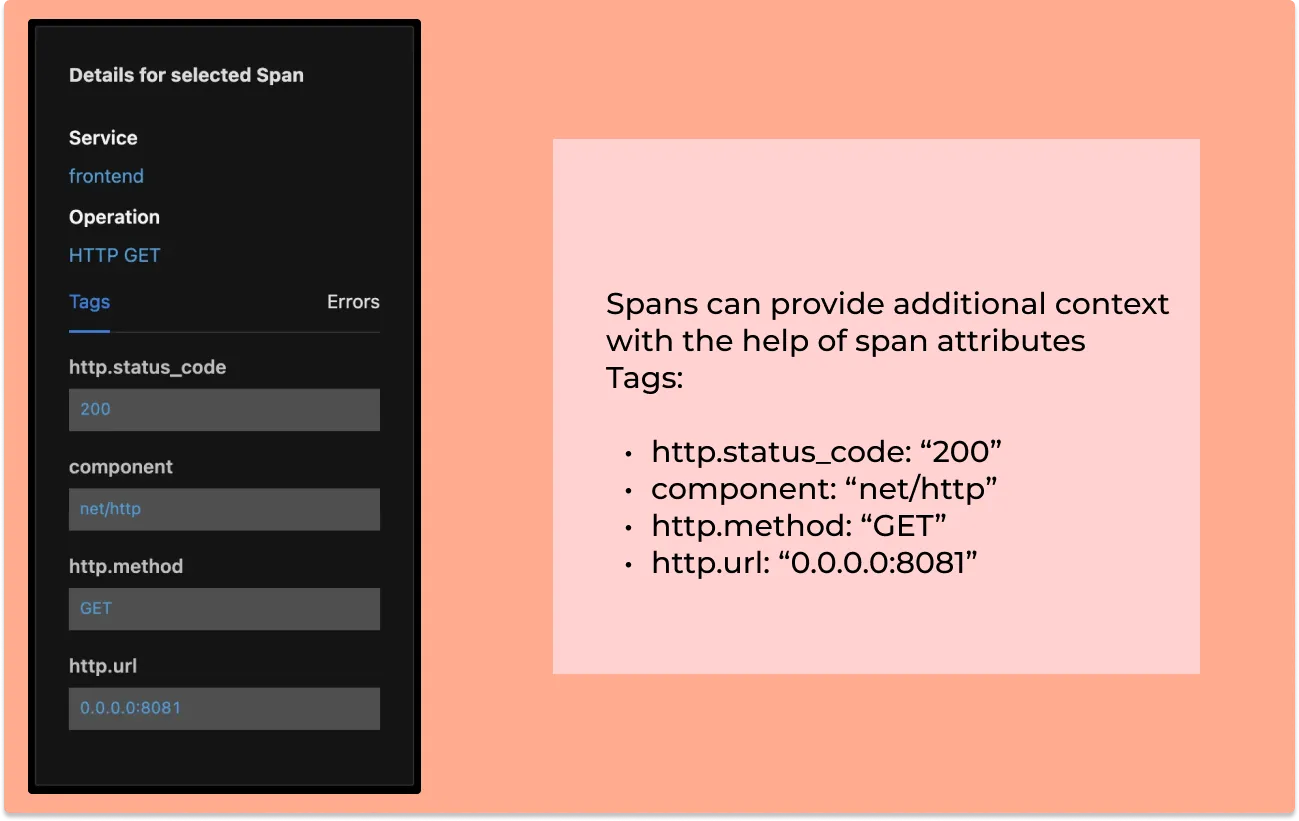
Span attributes are key-value pairs that can be used to provide additional context on a span about the specific operation it tracks. They serve as descriptive elements, providing more information about the operation being performed within the span.
Span context:
A Span context uniquely identifies the request a span is part of. It serves as a container holding critical information that links together spans across various services and machines. Span context consists of three core components:
- Trace ID: The same trace ID as in the trace context, linking spans to the broader trace.
- Span ID: A unique identifier for each span within the trace, which is crucial for distinguishing the span's role within the trace.
- Timestamps: Timing details for span creation.
These contexts are propagated to child spans, ensuring that related spans are linked together for effective correlation of activities across distributed systems. Span contexts are instrumental in building a detailed and informative picture of the entire workflow or request, which is useful for effective troubleshooting of distributed transactions and gaining deep insights into system behavior.
Let us see details of a selected span in an APM tool like SigNoz.
Example of a basic span
Let’s see an example of creating a basic span using the OpenTelemetry instrumentation library. OpenTelemetry is a set of API, SDKs, libraries, and integrations that is aiming to standardize the generation, collection, and management of telemetry data(logs, metrics, and traces).
Example of creating a basic span in java (Source: OpenTelemetry docs)
Span span = tracer.spanBuilder("my span").startSpan();
// put the span into the current Context
try (Scope scope = span.makeCurrent()) {
	// your use case
	...
} catch (Throwable t) {
    span.setStatus(StatusCode.ERROR, "Change it to your error message");
} finally {
    span.end(); // closing the scope does not end the span, this has to be done manually
}
Example of adding span attributes
Span span = tracer.spanBuilder("/resource/path").setSpanKind(SpanKind.CLIENT).startSpan();
span.setAttribute("http.method", "GET");
span.setAttribute("http.url", url.toString());
Difference between Traces and Spans
The key difference between Traces and Spans is that a Trace represents the complete journey of a request through a distributed system, while a Span represents a single unit of work or operation within that Trace.
Traces provide an end-to-end overview of the transaction flow, showing the complete path a request takes from start to finish. This overview helps in understanding the overall performance, latency, and any issues affecting the transaction as a whole.
Spans, on the other hand, provide detailed information about individual operations or steps, such as an HTTP request to a service, a database query, or any other specific task. Each span contains metadata about the operation, including its duration, start and end time, and any associated tags or logs.
In essence, Traces give a broad overview of a request journey while Spans give a detailed breakdown of each step within that journey.
Getting started with Distributed Tracing
Distributed tracing has become a key debugging tool for applications based on microservices architecture. If you want to implement distributed tracing for your application, you can use SigNoz - a full stack open source APM.
SigNoz provides metrics monitoring, log management, and distributed tracing under a single pane of glass and is built to support OpenTelemetry natively. OpenTelemetry is quietly becoming the world standard for application instrumentation. Using OpenTelemetry, you can avoid vendor lock-in and it comes with handy client libraries which can help you get started with distributed tracing easily.
SigNoz provides easy-to-use visualizations like flamegraphs and Gantt charts from tracing data collected with OpenTelemetry.

SigNoz can be installed on macOS or Linux computers in just three steps by using a simple install script.
The install script automatically installs Docker Engine on Linux. However, on macOS, you must manually install Docker Engine before running the install script.
git clone -b main https://github.com/SigNoz/signoz.git
cd signoz/deploy/
./install.sh
You can visit our documentation for instructions on how to install SigNoz using Docker Swarm and Helm Charts.

To go deeper, our OpenTelemetry tracing guide walks through instrumenting your services end to end, while our deep dive on OpenTelemetry spans covers the span data model in more detail. If you're still evaluating options, compare your choices in our roundup of distributed tracing tools, and learn how spans stay connected across services with context propagation.
To make sense of the traces you collect, see how to read flamegraphs and how tracing funnels help you analyze critical user journeys across distributed systems. Further, you can also understand why the OpenTelemetry Collector is a vital part of most modern telemetry pipelines.
