Health Check Monitoring With OpenTelemetry | Complete Code Tutorial
Health check monitoring is a critical practice for maintaining reliable and high-performing systems. It allows you to proactively identify and address issues before they impact your users.
This guide explores the fundamentals of health check monitoring, its importance in modern systems, and practical strategies for implementation.
You will also learn how HTTP endpoints can be monitored with OpenTelemetry. You will use the OpenTelemetry Collector to collect metrics from the target endpoint and send them to SigNoz for monitoring and visualization.
If you want to jump straight into implementation, start with this prerequisites.
What is Health Check Monitoring?
Health check monitoring is a systematic approach to assessing the status and performance of your systems and applications. It involves regular checks on various components to ensure they're functioning correctly. These checks can range from simple ping tests to complex, custom-designed probes that evaluate specific functionalities.
Key components of health check monitoring include:
- Endpoints: Dedicated URLs or interfaces that respond to monitoring requests.
- Metrics: Specific data points that indicate system health (e.g., response time, error rate).
- Thresholds: Predefined limits that, when exceeded, trigger alerts or actions.
Health checks come in various forms:
- Basic ping checks: Verify if a service is responsive.
- HTTP requests: Assess the availability and response of web services.
- Custom checks: Evaluate specific business logic or complex system states.
What is an HTTP endpoint?
An HTTP endpoint is a specific URL or path on a web server that is designed to receive and respond to HTTP requests. It acts as an entry point for clients to interact with the server and access its resources. When a client sends an HTTP request to a specific endpoint, the server processes the request and sends back an HTTP response. The endpoint, therefore, acts as a gateway or entry point for interacting with a specific part of a web application or service.
Why Monitor HTTP endpoints?
Monitoring HTTP endpoints is crucial for ensuring the continuous availability, optimal performance, and reliability of web services. It helps detect issues such as downtime, slow response times, or errors, allowing for proactive identification and resolution of potential problems.
Why is Health Check Monitoring Critical for Modern Systems?
In today's fast-paced digital landscape, system reliability is paramount. Health check monitoring plays a crucial role in maintaining this reliability by:
- Ensuring high availability: Continuous monitoring helps minimize downtime by quickly identifying and addressing issues.
- Enabling early detection: Problems are often caught before they escalate and impact end-users.
- Facilitating rapid response: Automated alerts allow teams to react swiftly to anomalies.
- Supporting DevOps practices: Regular health checks align with continuous delivery and integration principles.
Benefits of Implementing Health Check Monitoring
Effective health check monitoring offers numerous advantages:
- Improved system reliability: Consistent monitoring leads to more stable systems and higher user satisfaction.
- Reduced MTTD and MTTR: Mean Time to Detect (MTTD) and Mean Time to Resolve (MTTR) decrease with proactive monitoring.
- Enhanced capacity planning: Monitoring data informs decisions about resource allocation and scaling.
- Better SLA compliance: Regular checks help ensure adherence to Service Level Agreements.
How to Implement Effective Health Check Monitoring
To set up robust health check monitoring:
- Identify critical components: Determine which services and systems are essential to your operations.
- Design meaningful endpoints: Create specific URLs (e.g.,
/health,/status) that accurately represent component health. - Define appropriate metrics: Choose indicators that truly reflect the health of each component.
- Set realistic thresholds: Establish limits that balance sensitivity with the risk of false alarms.
- Implement automated alerts: Configure notifications to inform relevant team members when issues arise.
Best Practices for Health Check Design
Follow these guidelines to create effective health checks:
- Keep checks lightweight: Ensure monitoring doesn't significantly impact system performance.
- Use appropriate timeouts: Prevent cascading failures by setting reasonable time limits for checks.
- Implement authentication: Secure sensitive health check endpoints to prevent unauthorized access.
- Ensure representativeness: Design checks that accurately reflect real-world usage and potential issues.
What is OpenTelemetry
OpenTelemetry is a set of APIs, SDKs, libraries, and integrations aiming to standardize the generation, collection, and management of telemetry data(logs, metrics, and traces). It is backed by the Cloud Native Computing Foundation and is the leading open-source project in the observability domain.
The data you collect with OpenTelemetry is vendor-agnostic and can be exported in many formats. Telemetry data has become critical in observing the state of distributed systems. With microservices and polyglot architectures, there was a need to have a global standard. OpenTelemetry aims to fill that space and is doing a great job at it thus far.
What is OpenTelemetry Collector?
OpenTelemetry Collector is a stand-alone service provided by OpenTelemetry. It can be used as a telemetry-processing system with a lot of flexible configurations that gather and process observability data, such as traces, metrics, and logs, from different parts of a software system. It then sends this data to chosen destinations, allowing for centralized analysis and monitoring. The collector simplifies the task of collecting and exporting telemetry data in cloud-native environments.
How does OpenTelemetry Collector collect data?
Data collection in OpenTelemetry Collector is facilitated through receivers. Receivers are configured via YAML under the top-level receivers tag. To ensure a valid configuration, at least one receiver must be enabled.
Below is an example of an otlp receiver:
receivers:
  otlp:
    protocols:
      grpc:
      http:
The OTLP receiver accepts data through gRPC or HTTP in the OTLP format. There are advanced configurations that you can enable via the YAML file.
Here’s a sample configuration for an otlp receiver:
receivers:
  otlp:
    protocols:
      http:
        endpoint: "localhost:4318"
        cors:
          allowed_origins:
            - <http://test.com>
            # Origins can have wildcards with *, use * by itself to match any origin.
            - https://*.example.com
          allowed_headers:
            - Example-Header
          max_age: 7200
You can find more details on advanced configurations here.
Once a receiver is configured, it needs to be enabled to start the data flow. This involves setting up pipelines within a service. A pipeline acts as a streamlined pathway for data, outlining how it should be processed and where it should go. A pipeline comprises of the following:
- Receivers: These are entry points for data into the OpenTelemetry Collector, responsible for collecting data from various sources and feeding it into the pipeline.
- Processors: After data is received, processors manipulate, filter, or enhance the data as needed before it proceeds further in the pipeline. They provide a way to customize the data according to specific requirements.
- Exporters: After processing, the data is ready for export. Exporters define the destination for the data, whether it's an external monitoring system, storage, or another service. They format the data appropriately for the chosen output.
Below is an example pipeline configuration:
service:
  pipelines:
    metrics:
      receivers: [otlp, httpcheck]
      processors: [batch]
      exporters: [otlp]
Here’s a breakdown of the above metrics pipeline:
- Receivers: This pipeline is configured to receive metrics data from two sources: OTLP and HTTP Check. The
otlpreceiver collects metrics using both gRPC and HTTP protocols, while thehttpcheckreceiver gathers metrics from the HTTP endpoint. - Processors: Metrics data is processed using the
batchprocessor. This processor likely batches metrics before exporting them, optimizing the data flow. - Exporters: Metrics processed through this pipeline are exported to the OTLP destination. The
otlpexporter sends data to an endpoint specified in the configuration.
Monitoring HTTP endpoint with OpenTelemetry Collector
In this section, you will learn how HTTP endpoints can be monitored and how metrics can be collected from those endpoints using the OpenTelemetry Collector. You will also learn how the collected metrics can be sent to SigNoz for visualization.
Prerequisites
- A web app, a sample Flask App has been provided. This app has five endpoints that we will set up to be monitored.
- A SigNoz cloud account
Setting up SigNoz
You need a backend to send the collected data for monitoring and visualization. SigNoz is an OpenTelemetry-native APM that is well-suited for visualizing OpenTelemetry data.
SigNoz Cloud is the easiest way to run SigNoz. Sign up for a free account and get 30 days of unlimited access to all features.

You can also install and self-host SigNoz yourself since it is open-source. With 24,000+ GitHub stars, open-source SigNoz is loved by developers. Find the instructions to self-host SigNoz.
Setting up OpenTelemetry Collector
The OpenTelemetry Collector offers various deployment options to suit different environments and preferences. It can be deployed using Docker, Kubernetes, Nomad, or directly on Linux systems. You can find all the installation options here. For the purpose of this article, the OpenTelemetry Collector will be installed manually.
Download the OpenTelemetry Collector
Download the appropriate binary package for your Linux or macOS distribution from the OpenTelemetry Collector releases page. We are using the latest version available at the time of writing this tutorial.
curl --proto '=https' --tlsv1.2 -fOL <https://github.com/open-telemetry/opentelemetry-collector-releases/releases/download/v0.89.0/otelcol-contrib_0.89.0_darwin_arm64.tar.gz>
For macOS users, download the binary package specific to your system.
| Build | Architecture |
|---|---|
| M1 Chip | arm64 |
| Intel | amd64 (x86-64) |
Extract the package
Create a new directory named otelcol-contrib and then extract the contents of the otelcol-contrib_0.89.0_darwin_arm64.tar.gz archive into this newly created directory with the following command:
mkdir otelcol-contrib
Extract the contents of the binary package in that directory:
tar xvzf otelcol-contrib_0.89.0_darwin_arm64.tar.gz -C otelcol-contrib
Go into the directory:
cd otelcol-contrib
Set up the Configuration file
In the same otelcol-contrib directory, create a config.yaml file:
touch config.yaml
Paste the below config into the file:
receivers:
  otlp:
    protocols:
      grpc: {}
      http: {}
  httpcheck:
    targets:
      - endpoint: <http://localhost:5000/>
        method: GET
      - endpoint: <http://localhost:5000/one>
        method: GET
      - endpoint: <http://localhost:5000/two>
        method: GET
      - endpoint: <http://localhost:5000/three>
        method: GET
      - endpoint: <http://localhost:5000/four>
        method: GET
      - endpoint: <http://localhost:5000/error>
        method: GET
    collection_interval: 10s

processors:
  batch:
    send_batch_size: 1000
    timeout: 10s

exporters:
  otlp:
    endpoint: "ingest.{region}.signoz.cloud:443"
    tls:
      insecure: false
    timeout: 20s
    headers:
      "signoz-ingestion-key": "<SIGNOZ_INGESTION_KEY>"
  logging:
    verbosity: detailed

service:
  telemetry:
    metrics:
      address: localhost:8888
  pipelines:
    metrics:
      receivers: [otlp, httpcheck]
      processors: [batch]
      exporters: [otlp]
The HTTP Check Receiver is a component of the OpenTelemetry Collector that enables monitoring of HTTP endpoints. It periodically sends HTTP requests to specified endpoints and collects metrics about the responses, such as response time, status code, and error messages. You can find more information on the OpenTelemetry HTTP Check receiver here.
In the above config file, you can see that we are setting the endpoints as targets to be monitored.
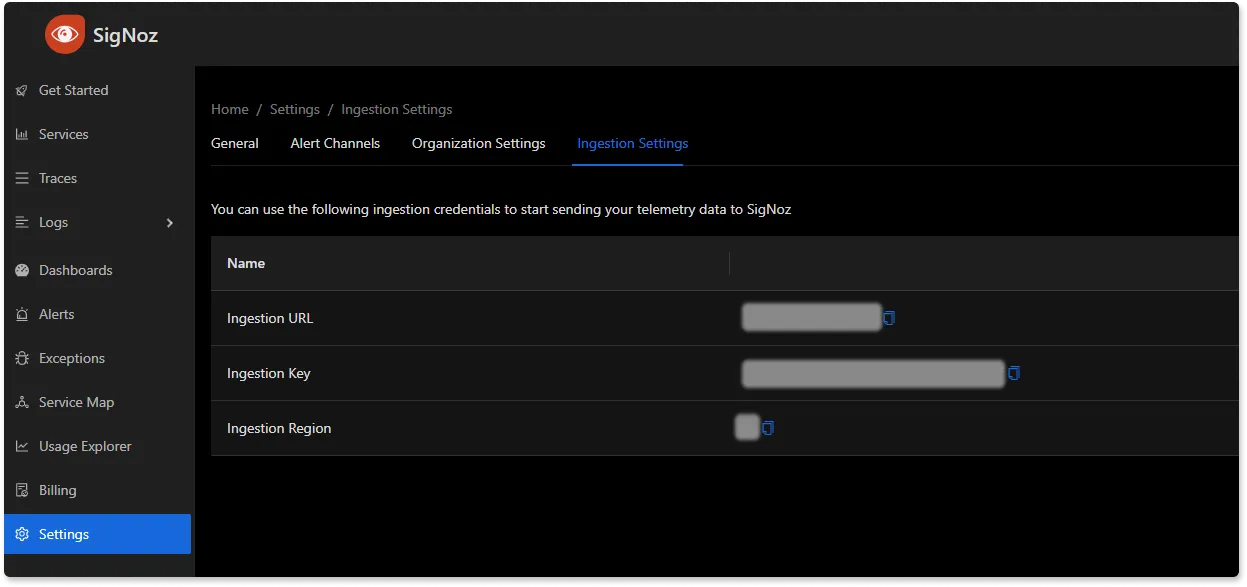
Replace http://localhost:5000/ with the correct endpoint where you have your web app running. If you have only one target endpoint, take out the rest endpoints. Also, replace {region} with the region for your SigNoz cloud account and <SIGNOZ_INGESTION_KEY> with the ingestion key for your account. You can find these settings in the SigNoz dashboard under Settings > Ingestion Settings.
Run the collector service
In the same otelcol-contrib directory, run the below command to start the collector service:
./otelcol-contrib --config ./config.yaml
You should receive a similar output to show it has started successfully:
2023-11-29T00:16:14.193+0100    info    service@v0.89.0/telemetry.go:85    Setting up own telemetry...
2023-11-29T00:16:14.195+0100    info    service@v0.89.0/telemetry.go:202   Serving Prometheus metrics      {"address": "localhost:8888", "level": "Basic"}
2023-11-29T00:16:14.197+0100    info    receiver@v0.89.0/receiver.go:296   Development component. May change in the future.        {"kind": "receiver", "name": "httpcheck", "data_type": "metrics"}
2023-11-29T00:16:14.198+0100    info    service@v0.89.0/service.go:143     Starting otelcol-contrib...     {"Version": "0.89.0", "NumCPU": 12}
2023-11-29T00:16:14.198+0100    info    extensions/extensions.go:34        Starting extensions...
2023-11-29T00:16:14.200+0100    warn    internal@v0.89.0/warning.go:40     Using the 0.0.0.0 address exposes this server to every network interface, which may facilitate Denial of Service attacks     {"kind": "receiver", "name": "otlp", "data_type": "metrics", "documentation": "<https://github.com/open-telemetry/opentelemetry-collector/blob/main/docs/security-best-practices.md#safeguards-against-denial-of-service-attacks>"}
2023-11-29T00:16:14.201+0100    info    otlpreceiver@v0.89.0/otlp.go:83    Starting GRPC server    {"kind": "receiver", "name": "otlp", "data_type": "metrics", "endpoint": "0.0.0.0:4317"}
2023-11-29T00:16:14.202+0100    warn    internal@v0.89.0/warning.go:40     Using the 0.0.0.0 address exposes this server to every network interface, which may facilitate Denial of Service attacks     {"kind": "receiver", "name": "otlp", "data_type": "metrics", "documentation": "<https://github.com/open-telemetry/opentelemetry-collector/blob/main/docs/security-best-practices.md#safeguards-against-denial-of-service-attacks>"}
2023-11-29T00:16:14.203+0100    info    otlpreceiver@v0.89.0/otlp.go:101   Starting HTTP server    {"kind": "receiver", "name": "otlp", "data_type": "metrics", "endpoint": "0.0.0.0:4318"}
2023-11-29T00:16:14.203+0100    info    service@v0.89.0/service.go:169     Everything is ready. Begin running and processing data.
Monitoring HTTP Endpoints with SigNoz dashboard
Once the collector service has started successfully, it will collect the data and send it to SigNoz.
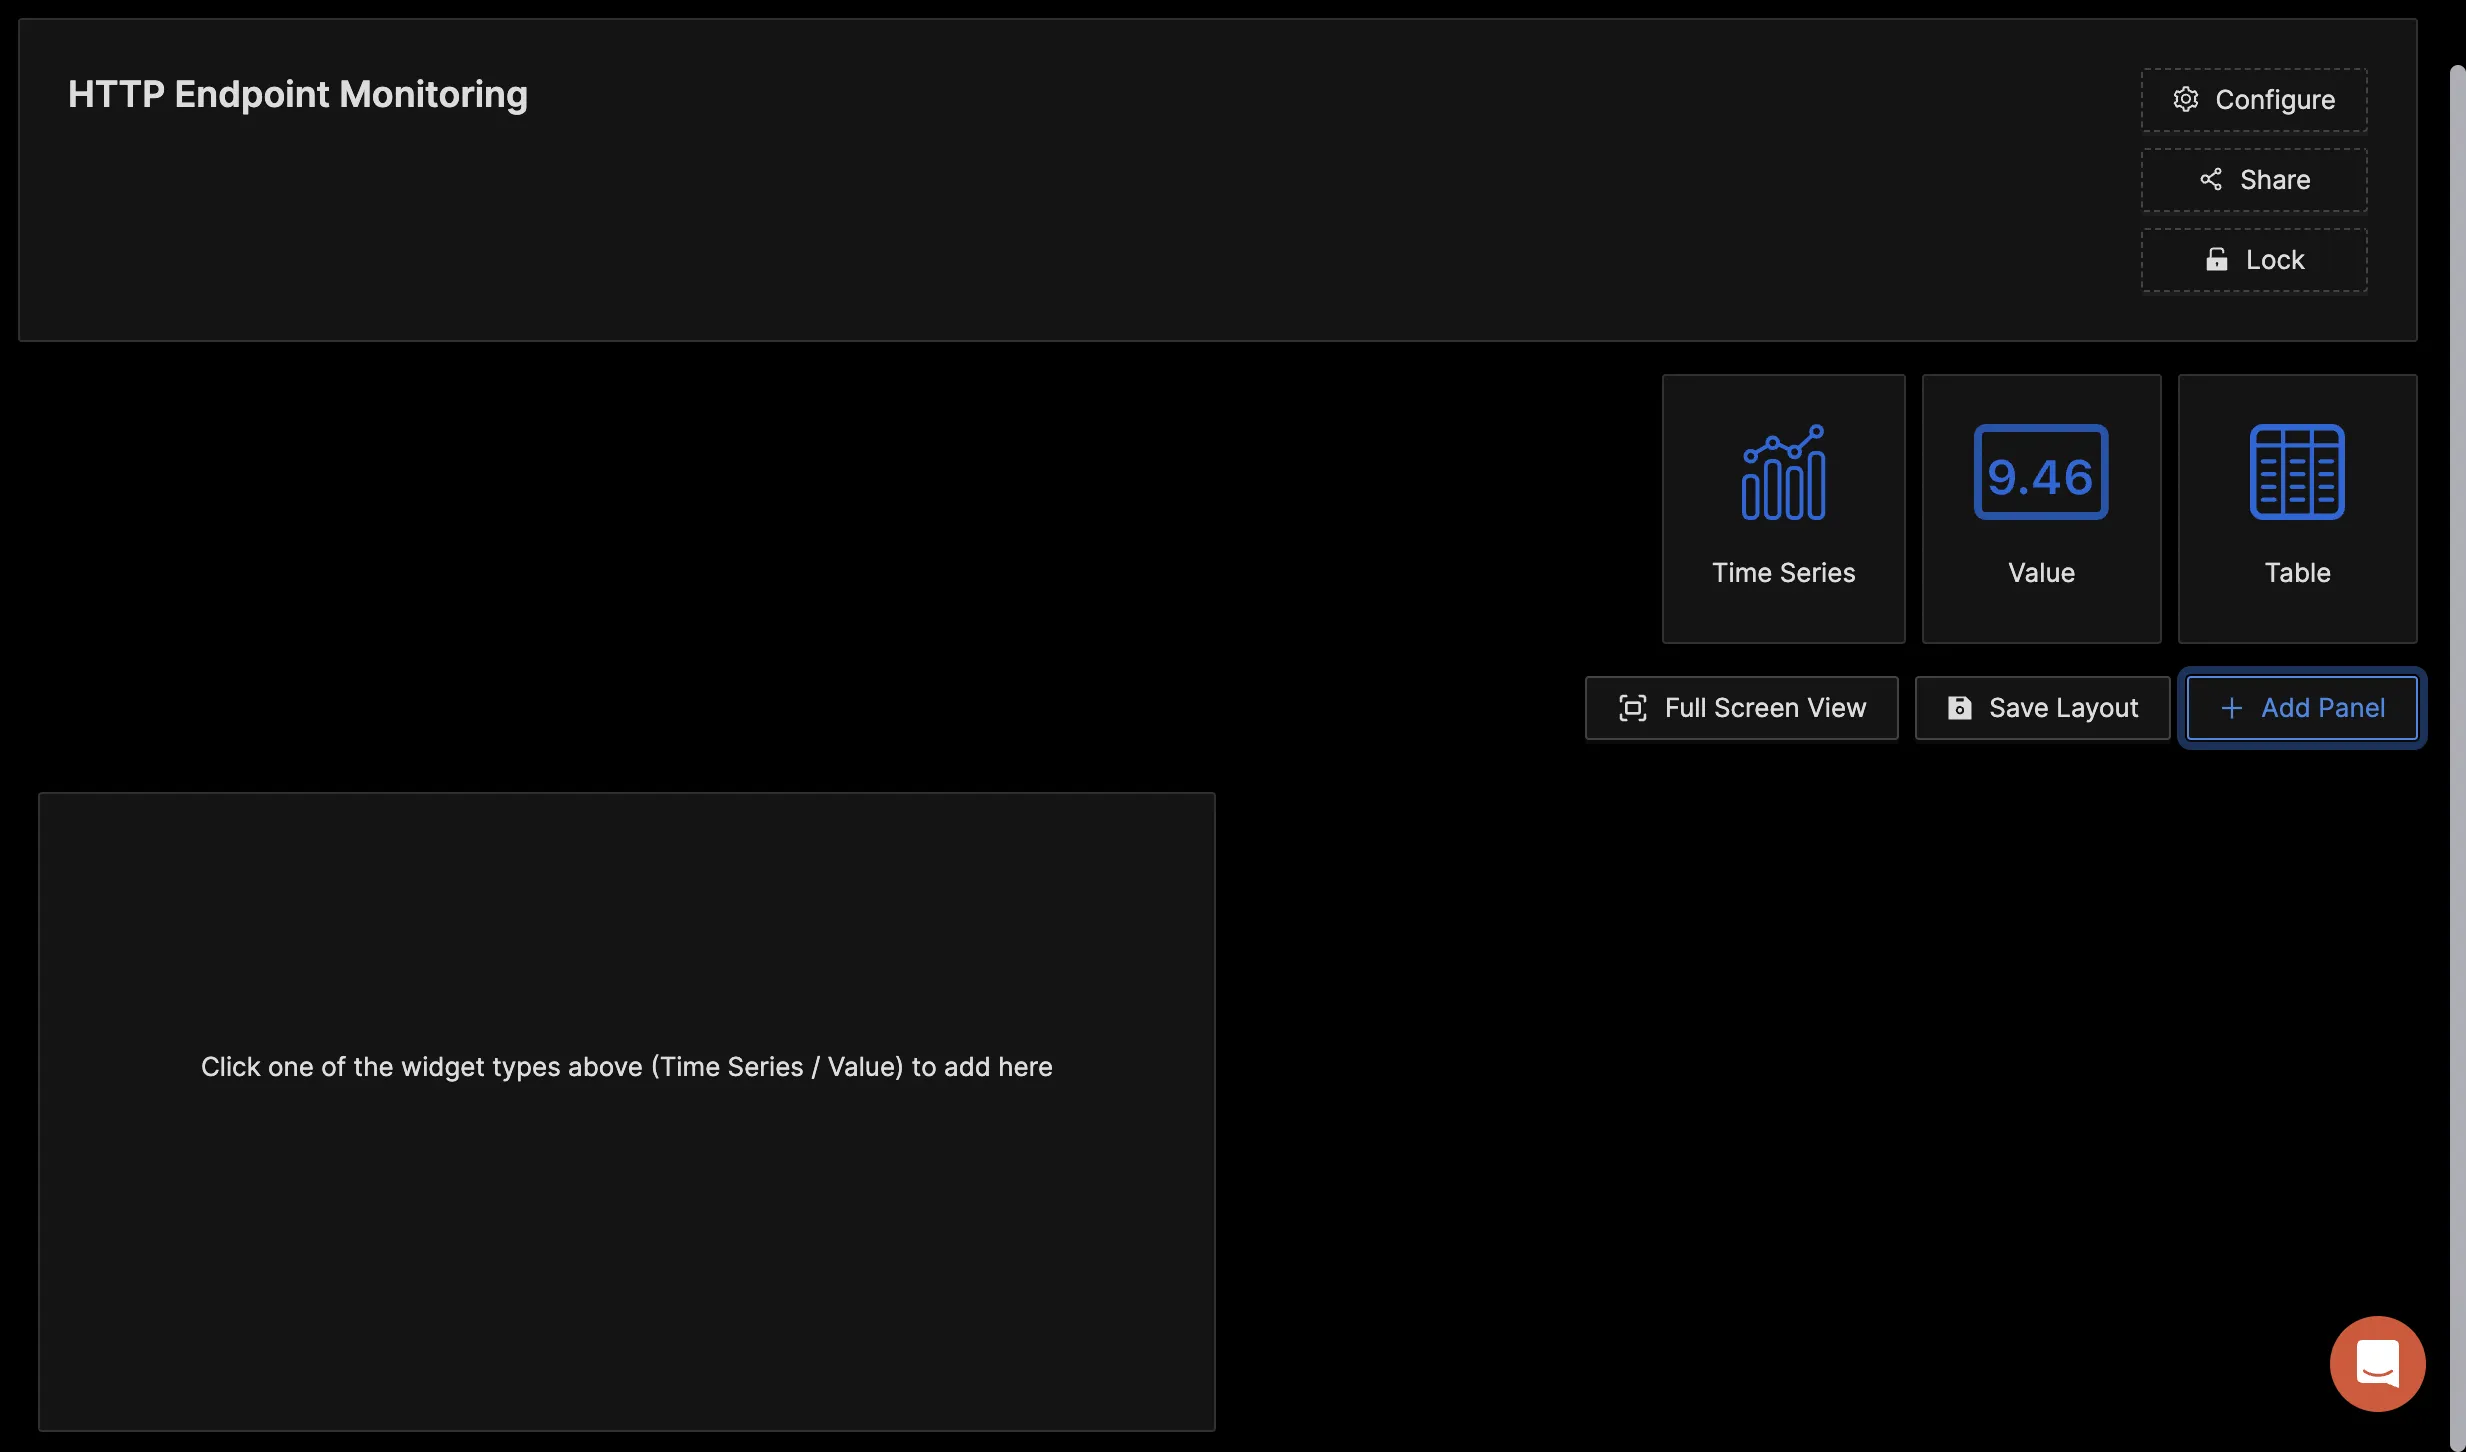
Navigate to your SigNoz Cloud account and access the "Dashboard" tab. Click on the “New Dashboard” button to create a new dashboard.
For HTTP endpoint monitoring, you can use the time-series chart.
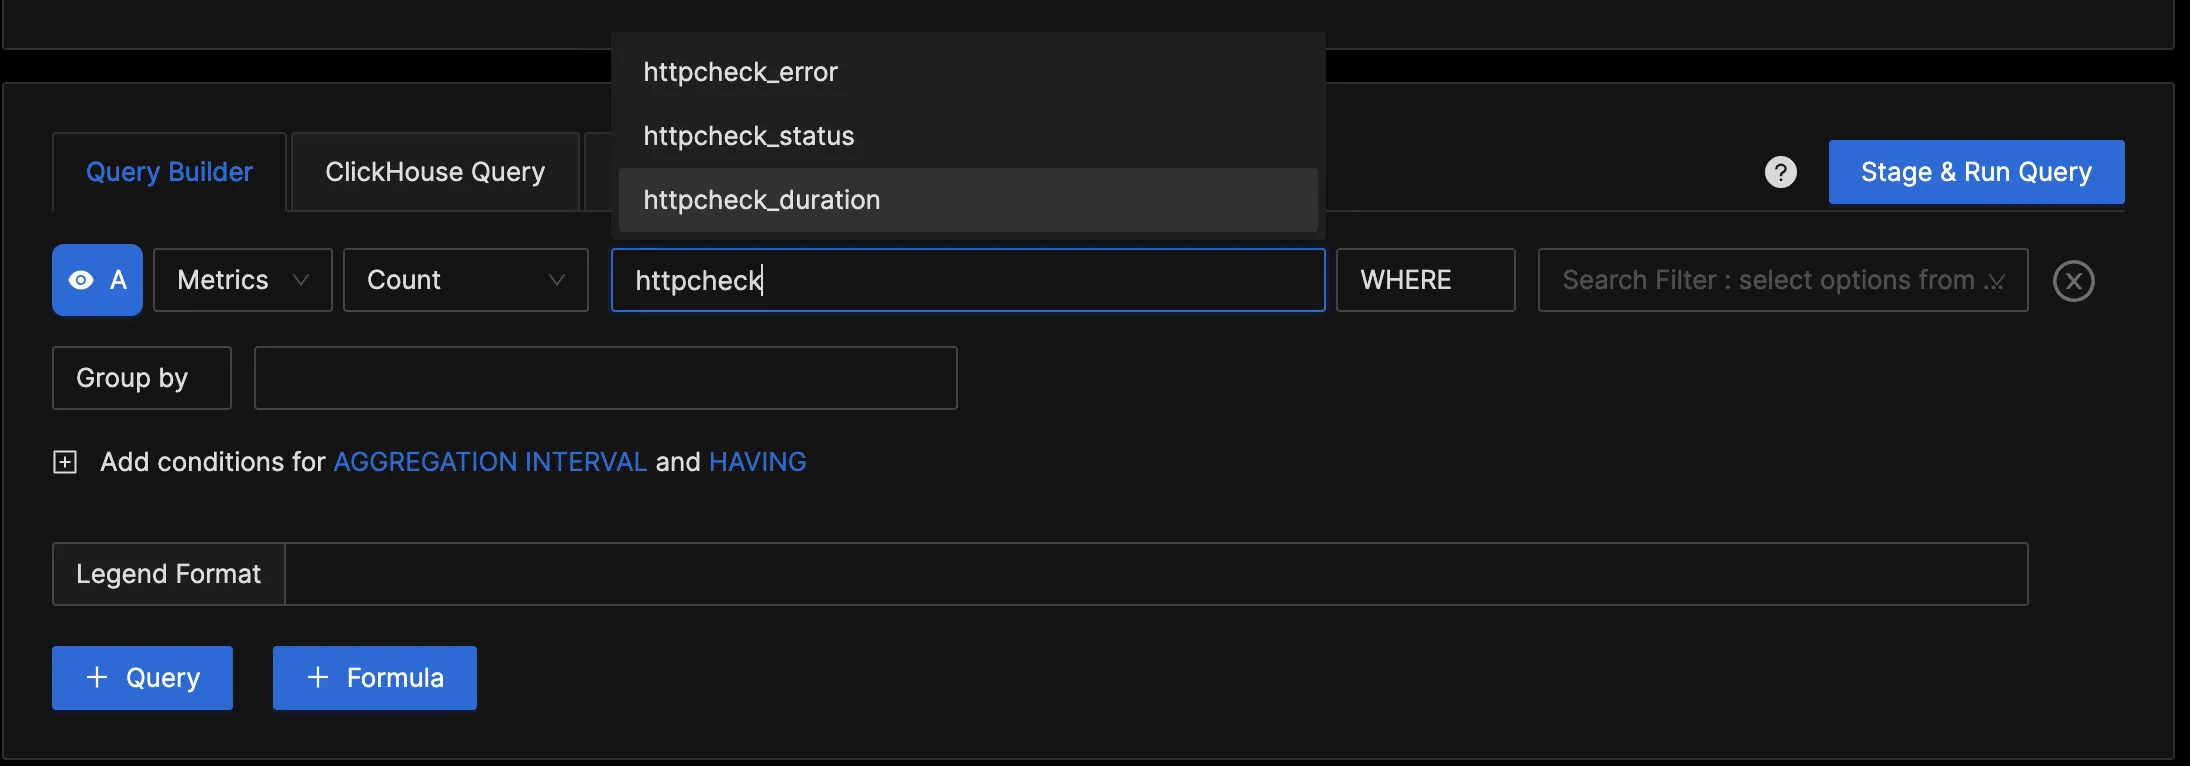
In the "Query Builder" tab, enter "http", and you should see various metrics collected by the httpcheck receiver. This confirms that the OpenTelemetry Collector is successfully collecting the http metrics and forwarding them to SigNoz for monitoring and visualization.
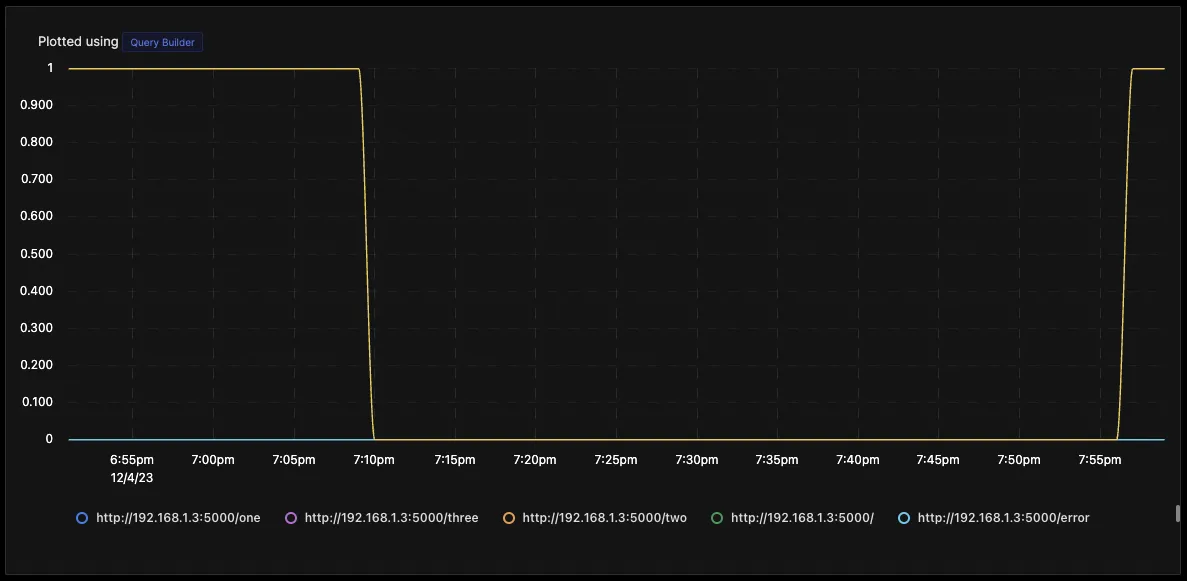
HTTP metrics sent to SigNoz
In SigNoz, you can monitor the health of HTTP endpoints by running queries against the httpcheck_status metrics. This metric is generated by the HTTP Check Receiver, which makes a request to the specified endpoint and generates a metric labeled for each HTTP response status class with a value of 1 if the status code matches the class.
So if you need the endpoints monitored, you can create a query with the where clause set to http_status_class = 2xx .
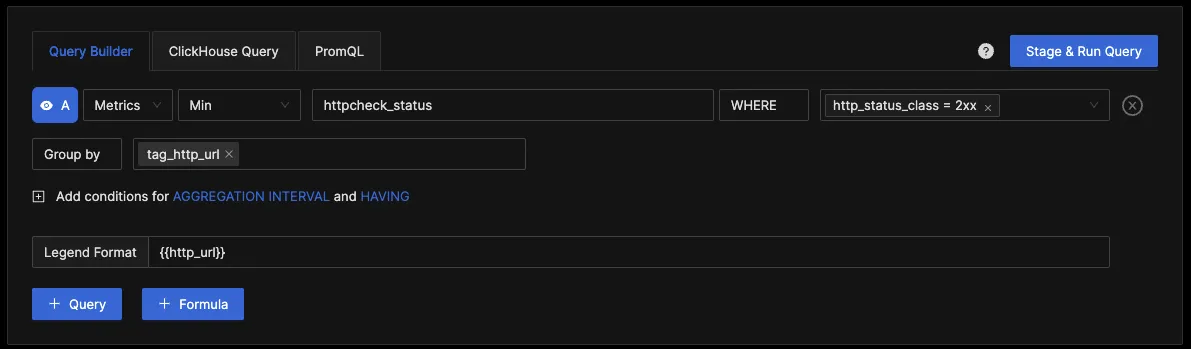
It will give you a chart where you can see all the URLs are monitored their value as 1 when they are up and 0 when they are down.
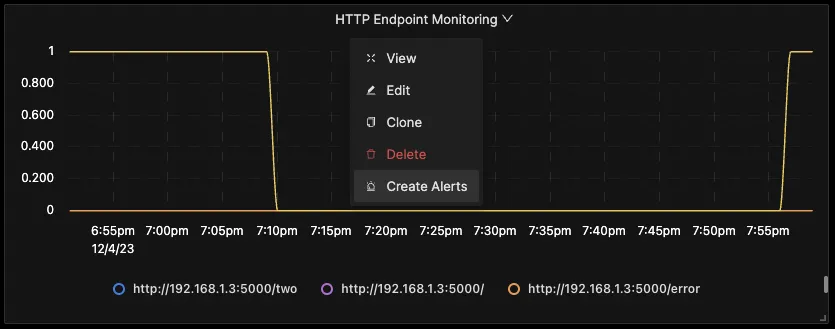
You can also create an alert for an endpoint going down and get it in your preferred notification channel. Click on drop-down at the top of the panel and then click on Create Alerts.
It will take you to the alerts page; from there, you can create the alerts.
Visit the SigNoz documentation to learn more about creating dashboards and running queries.
Metrics and Resource Attributes for HTTP receiver supported by OpenTelemetry
The following metrics and resource attributes for the HTTP receiver can be collected by the OpenTelemetry Collector.
Metrics
These metrics are enabled by default. Each of them can be disabled by applying the following configuration:
metrics:
  <metric_name>:
    enabled: false
| Metrics | Description | Metrics Name | Metric Type | Value Type | Unit | Aggregation Temporality | Monotonic |
|---|---|---|---|---|---|---|---|
| HTTP Check Duration | Measures the duration of the HTTP check | httpcheck.duration | Gauge | Int | ms | - | - |
| HTTP Check Error | Records errors occurring during HTTP check | httpcheck.error | Sum | Int | {error} | Cumulative | False |
| HTTP Check Status | Records the status of the HTTP check (1 for success, 0 for failure) | httpcheck.status | Sum | Int | 1 | Cumulative | False |
You can visit the HTTP Check receiver GitHub repo to learn more about these metrics.
Attributes
Resource attributes are a set of key-value pairs that provide additional context about the source of a metric. They are used to identify and classify metrics and to associate them with specific resources or entities within a system.
The below attributes are enabled by default for the HTTP receiver.
| Name | Description | Values |
|---|---|---|
| http.url | Full HTTP request URL. | Any Str |
| http.status_code | HTTP response status code | Any Int |
| http.method | HTTP request method | Any Str |
| http.status_class | HTTP response status class | Any Str |
You can see these resource attributes in the OpenTelemetry Collector Contrib repo for the HTTP receiver.
Advanced Health Check Monitoring Techniques
As systems grow more complex, advanced monitoring techniques become necessary:
- Synthetic transactions: Simulate user interactions to test end-to-end functionality.
- Watchdogs: Implement separate processes that monitor and restart failed components.
- Orchestrator integration: Leverage platforms like Kubernetes for automated health management.
- Circuit breakers: Implement failure detection mechanisms to prevent system-wide cascading failures.
Tools and Technologies for Health Check Monitoring
A variety of tools are available for implementing health check monitoring:
- Open-source platforms: SigNoz, Prometheus, Grafana, and Nagios offer powerful monitoring capabilities.
- Cloud-native solutions: AWS CloudWatch, Google Cloud Monitoring, and Azure Monitor provide integrated monitoring for cloud environments.
- Commercial tools: DataDog, New Relic, and Dynatrace offer comprehensive monitoring suites.
When choosing a monitoring solution, consider factors such as:
- Integration with your existing infrastructure
- Scalability to match your system's growth
- Customization options for your specific needs
- Cost-effectiveness for your budget and requirements.
Conclusion
In this tutorial, you monitored an HTTP endpoint, collected metrics using the OpenTelemetry collector, and sent them to SigNoz for monitoring and visualization.
Visit our complete guide on OpenTelemetry Collector to learn more about it.
OpenTelemetry is becoming a global standard for open-source observability, offering advantages such as a unified standard for all telemetry signals and avoiding vendor lock-in. With OpenTelemetry, instrumenting your applications to collect logs, metrics, and traces becomes seamless, and you can monitor and visualize your telemetry data with SigNoz.
SigNoz is an open-source OpenTelemetry-native APM that can be used as a single backend for all your observability needs.
FAQs
What's the difference between health checks and other types of monitoring?
Health checks focus on the operational status of system components, while other monitoring types may track performance metrics, log data, or user behavior. Health checks are typically more frequent and lightweight, designed to quickly identify if a service is functioning correctly.
How often should health checks be performed?
The frequency of health checks depends on your system's criticality and resources. High-priority services may require checks every few seconds, while less critical components might be checked every few minutes. Balance the need for timely detection with the overhead of frequent checks.
Can health check monitoring impact system performance?
While health checks are designed to be lightweight, frequent or poorly implemented checks can impact performance. Optimize your health checks by keeping them simple, using appropriate intervals, and ensuring they don't consume excessive resources.
How do I determine the right metrics and thresholds for my health checks?
Start by identifying key indicators of your system's health, such as response time, error rates, or resource utilization. Set initial thresholds based on historical data and expected performance. Refine these over time based on real-world observations and feedback from your team and users.
Further Reading
