Jaeger vs SigNoz - Taking distributed tracing to the next level
Are you thinking of using Jaeger as a distributed tracing tool? What if there is a better alternative that does both distributed traces and metrics monitoring so that your engineering team does not have to use multiple tools.
In this article, we will explore how SigNoz is a better alternative than Jaeger as an observability tool. Jaeger is famous as an end-to-end distributed tracing tool. Jaeger was originally built by teams at Uber and then open-sourced. Distributed tracing is a mechanism to track transactions across services. When you have a distributed system based on microservices, tracing your transactions across services is a necessity. With distributed tracing, engineering teams can quickly identify issues instead of wasting time checking multiple logs and dashboards.
SigNoz is an excellent open-source distributed tracing tool. But it goes beyond. It is a full-stack APM and observability tool with a unified UI for metrics and traces. So you don't have to switch between tools like Prometheus(metrics) and Jaeger(traces) to debug issues. The product roadmap of SigNoz also has log management in its pipeline.
How is SigNoz better than Jaeger as an observability tool?
SigNoz can be your one-stop solution for application performance monitoring and observability needs. While Jaeger can be a good solution for distributed tracing, engineering teams often need access to metrics and traces for robust monitoring and quick debugging. The biggest advantage of SigNoz over Jaeger is that it does both metrics and traces. And that's only one of the reasons.
List of reasons why you should choose SigNoz over Jaeger:
- SigNoz provides unified UI for both metrics and traces
- Better user experience with out of box charts & visualization
- See metrics like latency, error rate etc. on traces for specific user groups
- Exceptions Monitoring
- Backend storage option of ClickHouse
- Alerts on metrics that are important for you
- Role-based access control for better team management
Let's explore in detail how these features of SigNoz make it a better choice than Jaeger for your engineering team's productivity.
SigNoz provides unified UI for both metrics and traces
Metrics are usually captured as time-series data and show statistics about the performance of specific services over a period of time. The statistics help developers understand the behavior of these services and how they are being used. Therefore, metrics monitoring is critical to keep your system's uptimes high. A good practice is to aggregate and visualize metrics within at most one minute.
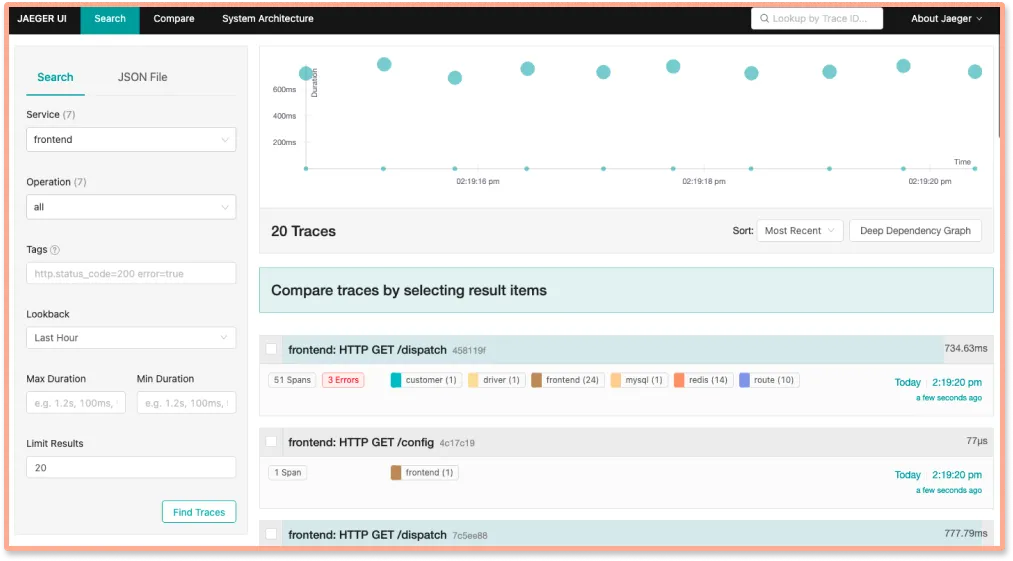
Jaeger is a distributed tracing tool and does not provide metrics.
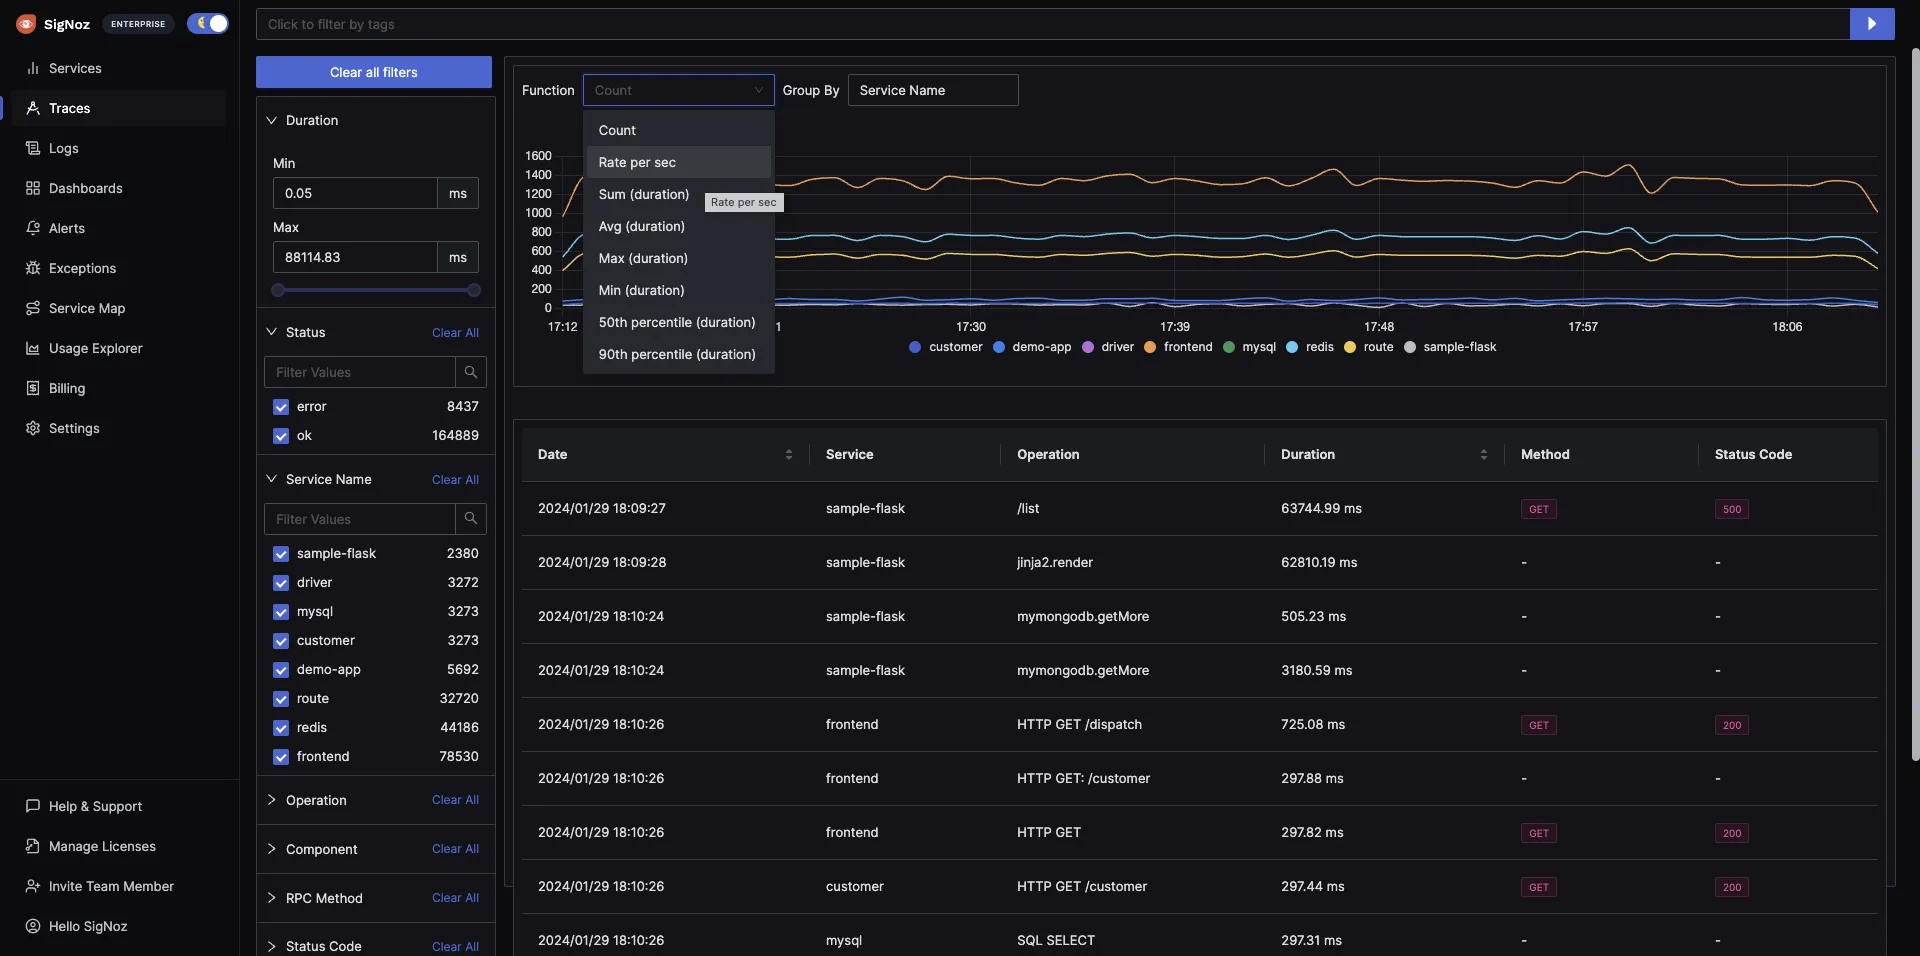
SigNoz, on the other hand, provides application metrics like the popular RED metrics:
- Requests per sec
- Error rate (%)
- Application latency like p50, p95, and p99
SigNoz also provides an easy way to track the top endpoints of your application, as shown in the dashboard below. You can see that SigNoz has a dedicated tab for metrics visualization. You can also track metrics for external calls and database calls.

Out of box charts and visualization with SigNoz
SigNoz is an open-source tool, but its genesis lies in the absence of a great user experience of current popular open-source alternatives. It can be easily compared to SaaS vendors like DataDog when it comes to UX and data visualization.
Below you can see how spans in a trace are visualized with flamegraphs and Gantt charts. A good visualization dashboard is designed with the intent to drive actionable insights fast. With a single-pane view of spans and details for selected spans, it's much easier for teams to identify issues in selected spans.

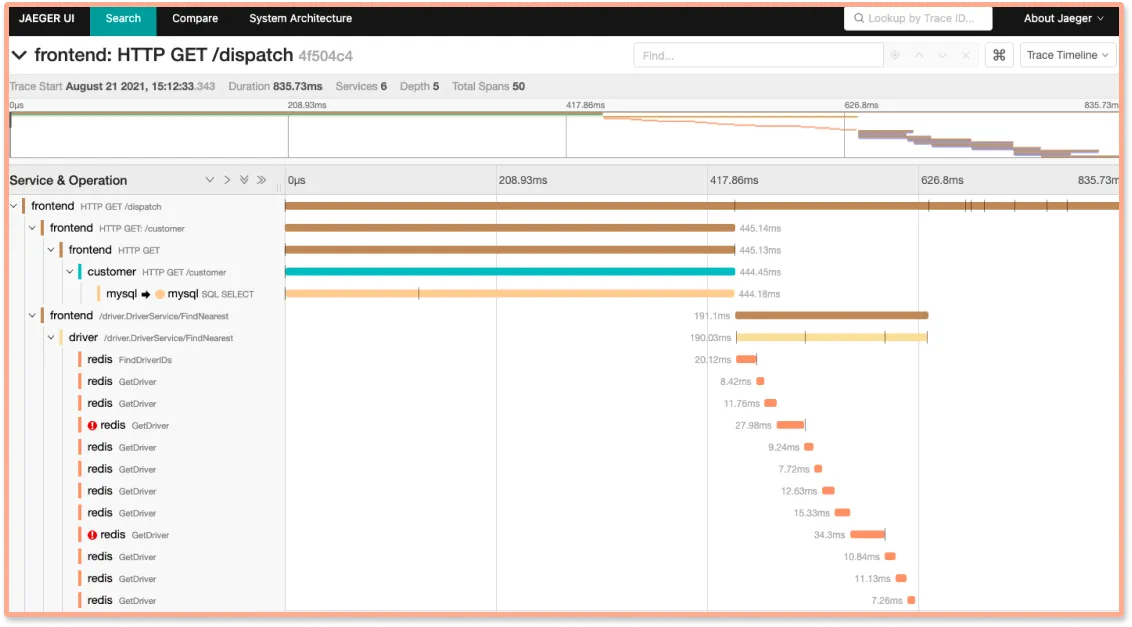
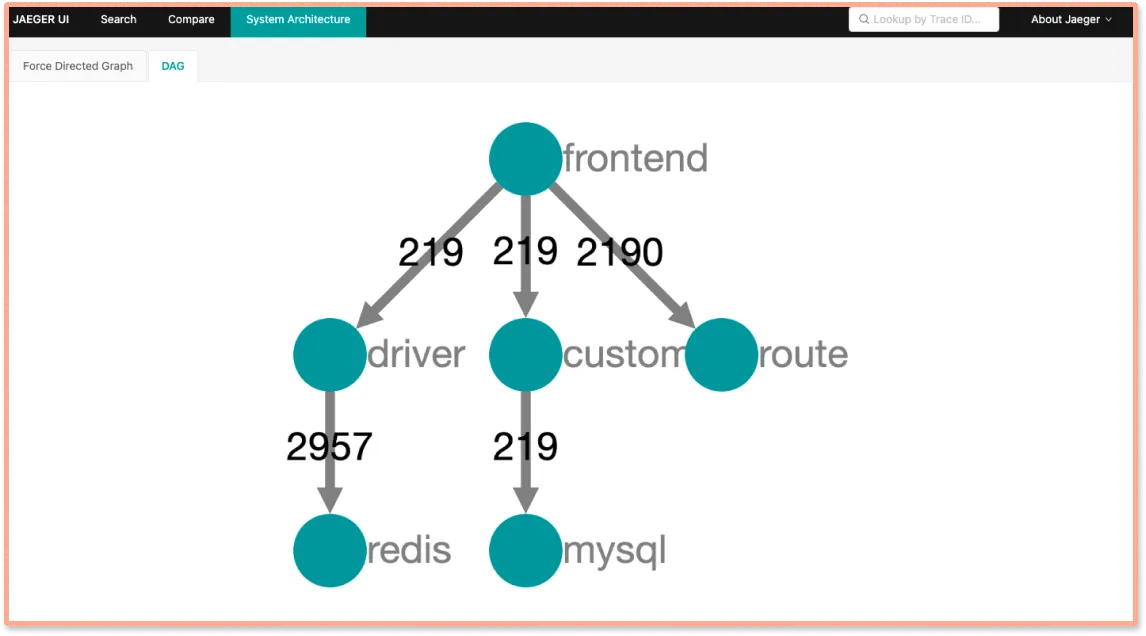
Jaeger does not provide Flamegraphs, and to view details of a span, you need to drill down on a selected span.
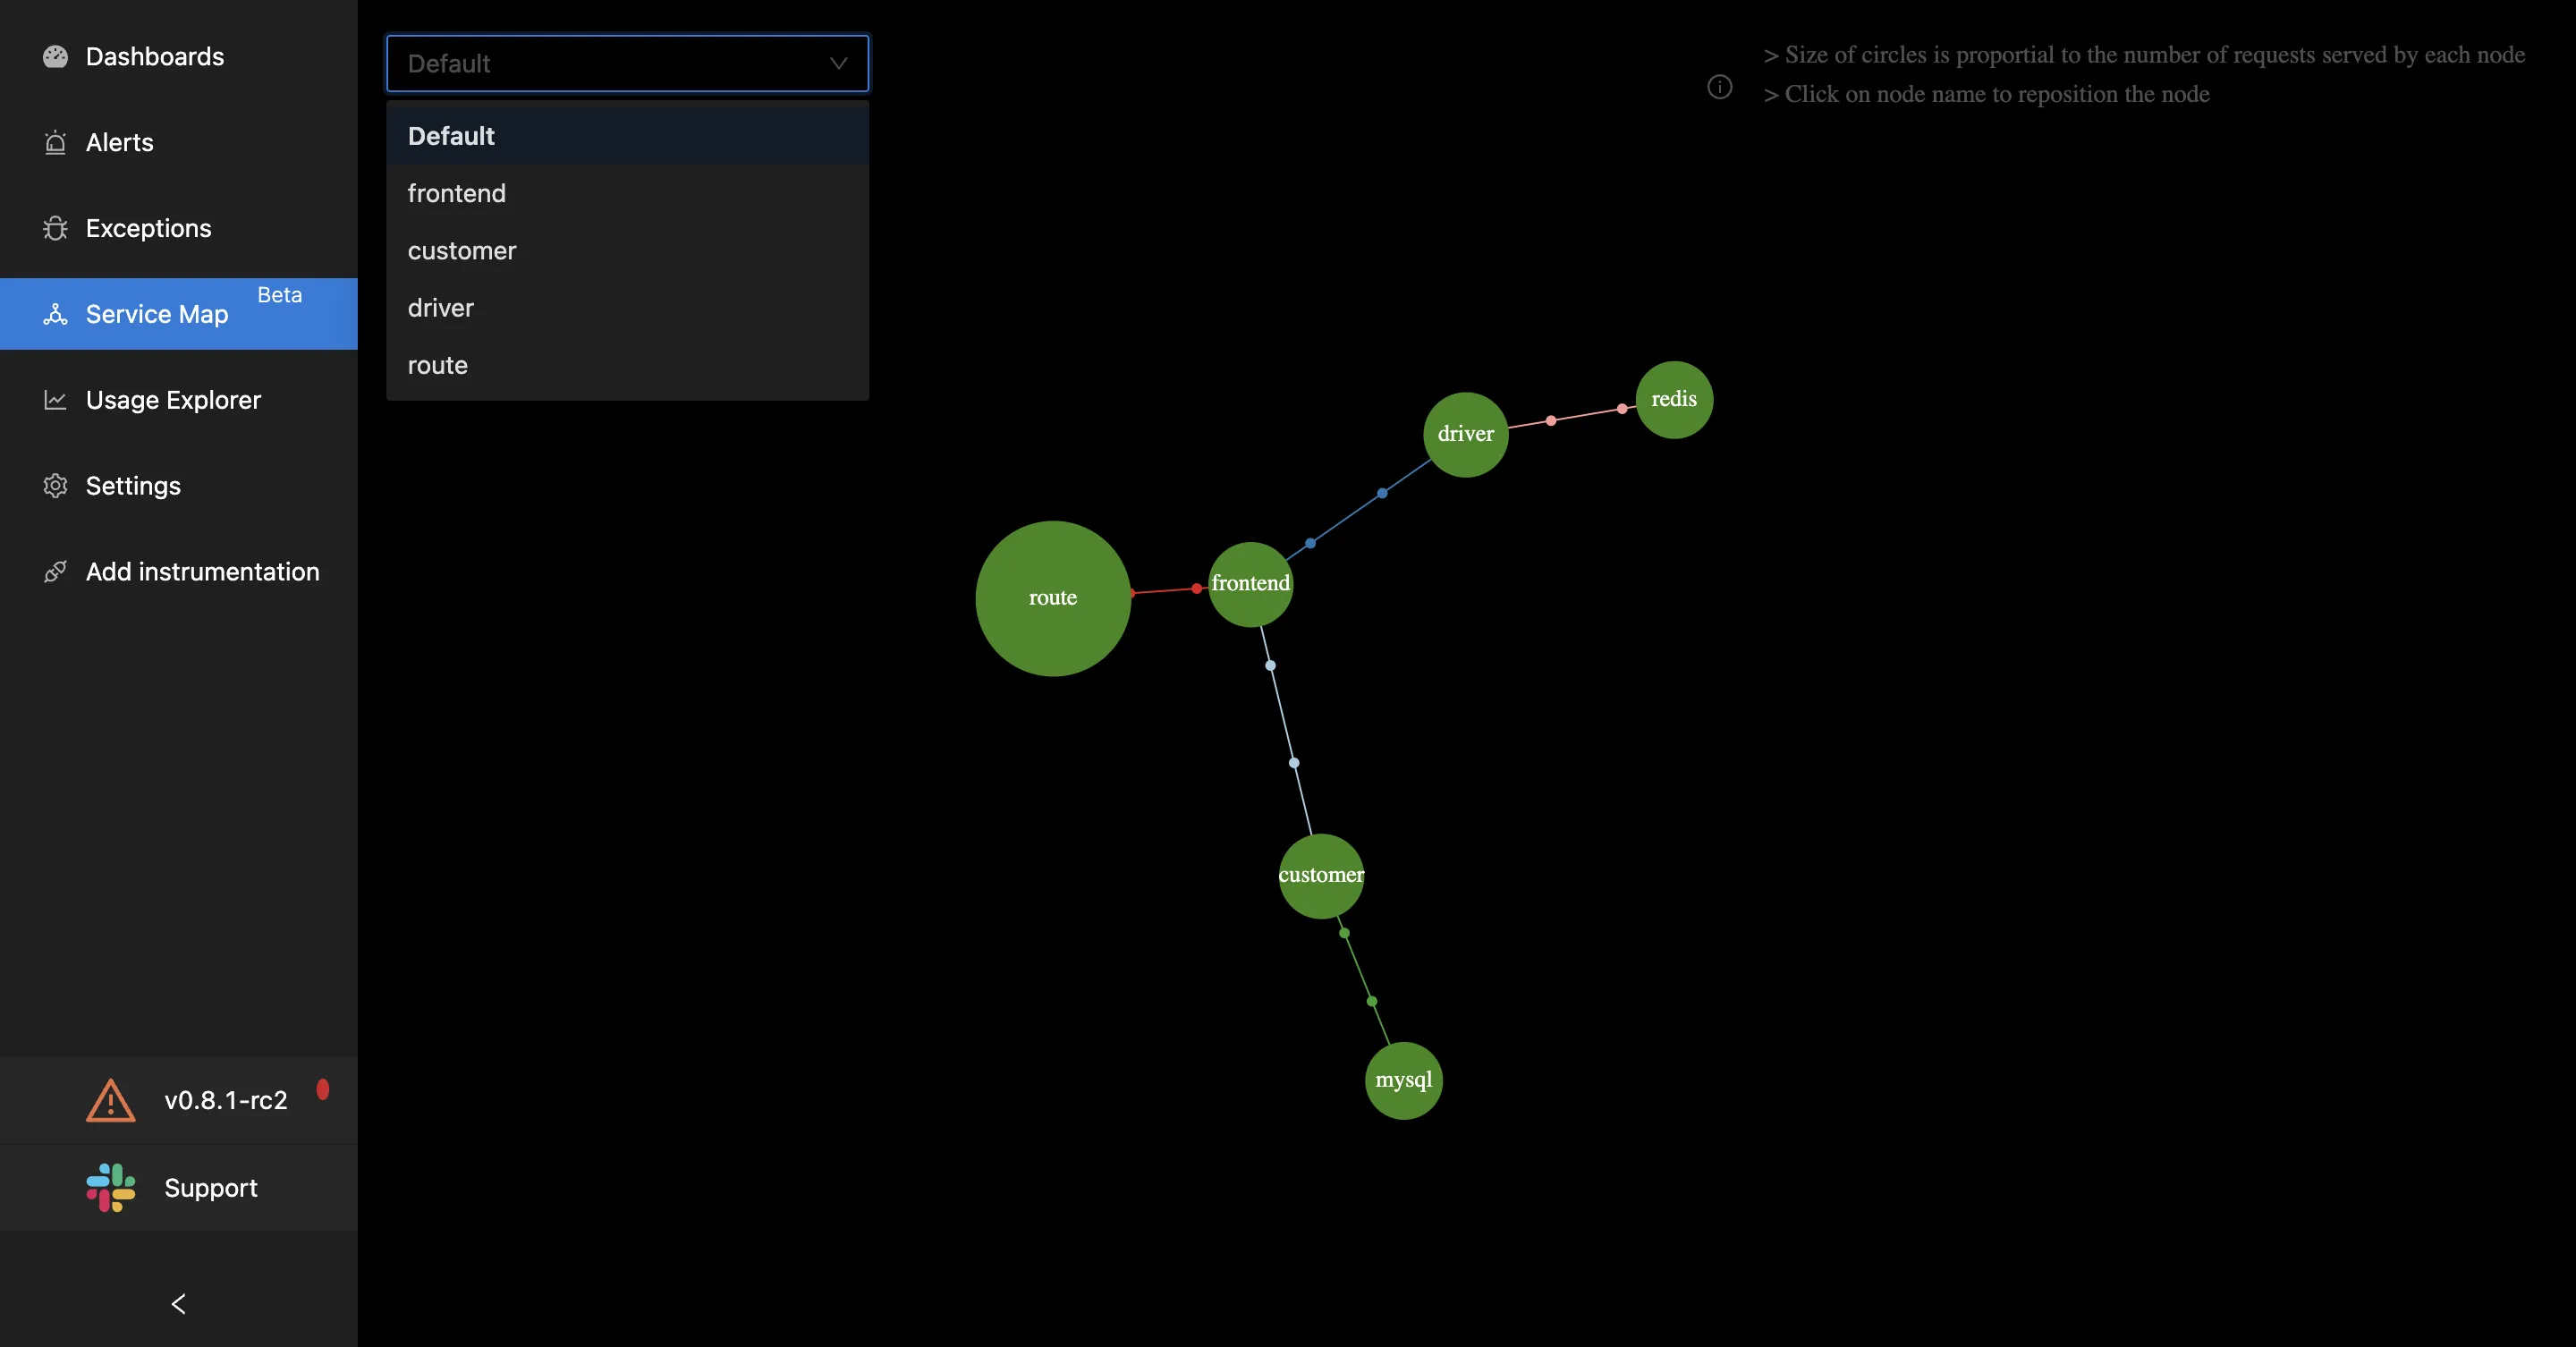
Currently in beta, SigNoz also provides interactive service maps which can automatically identify the dependency between your services. The size of each circle is proportional to the number of requests it is serving. The dots connecting the services are synced with the flow of requests between the services.
See metrics like latency, error rate etc on traces for specific user groups
A single trace tells you how a user request performed across services to serve the user what they wanted. And aggregated traces can help you identify which service or database is causing the latency affecting user's requests. And what if we told you, with SigNoz, you can see metrics for aggregated trace data related to particular attributes.
Let's break down what it means. Suppose you have a user category marked gold for customers in a particular segment for your application. Seeing how requests from a specific segment of users perform in your application can be critical to business metrics like growth or revenue. SigNoz allows you to filter traces with the help of tags. For example, you can filter traces where the customer type tag is set to gold.
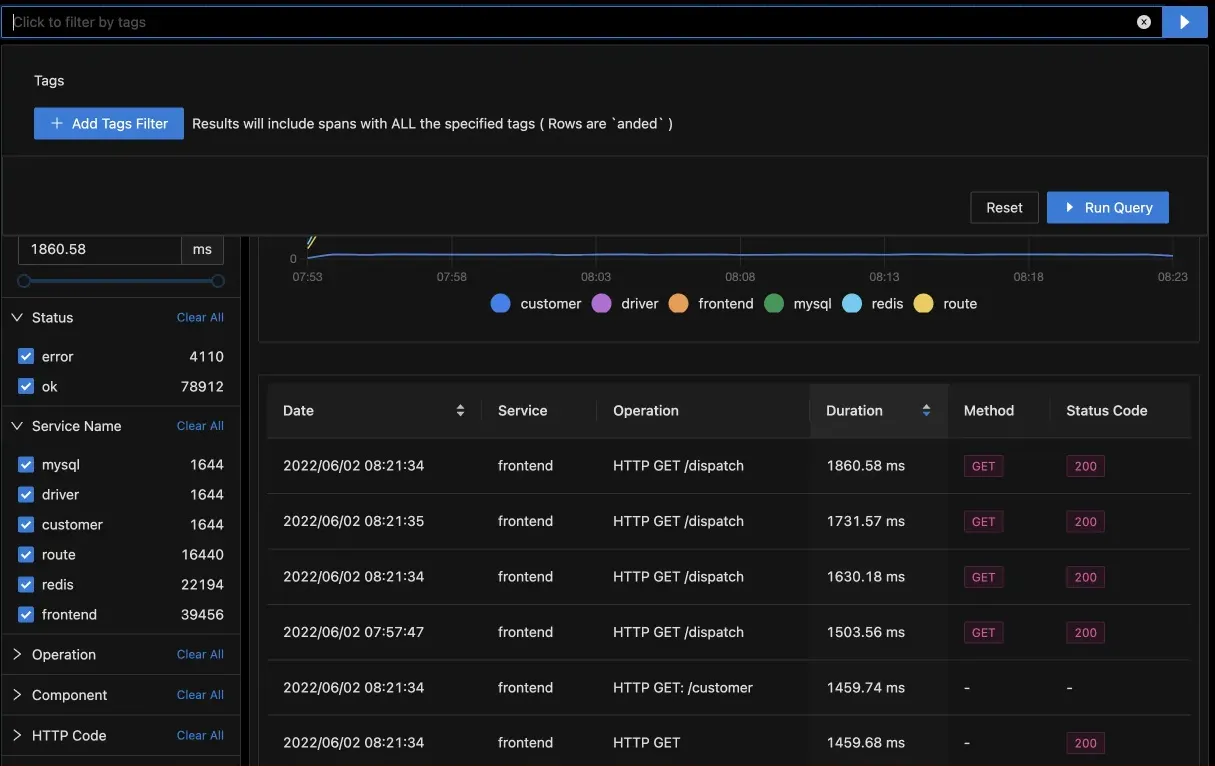
After filtering the traces, you can choose to visualize metrics like calls, duration, and error rate on the filtered traces. This insight can help you improve app's performance for specific user segments and use-cases. Jaeger does not provide such capabilities.
Exceptions Monitoring
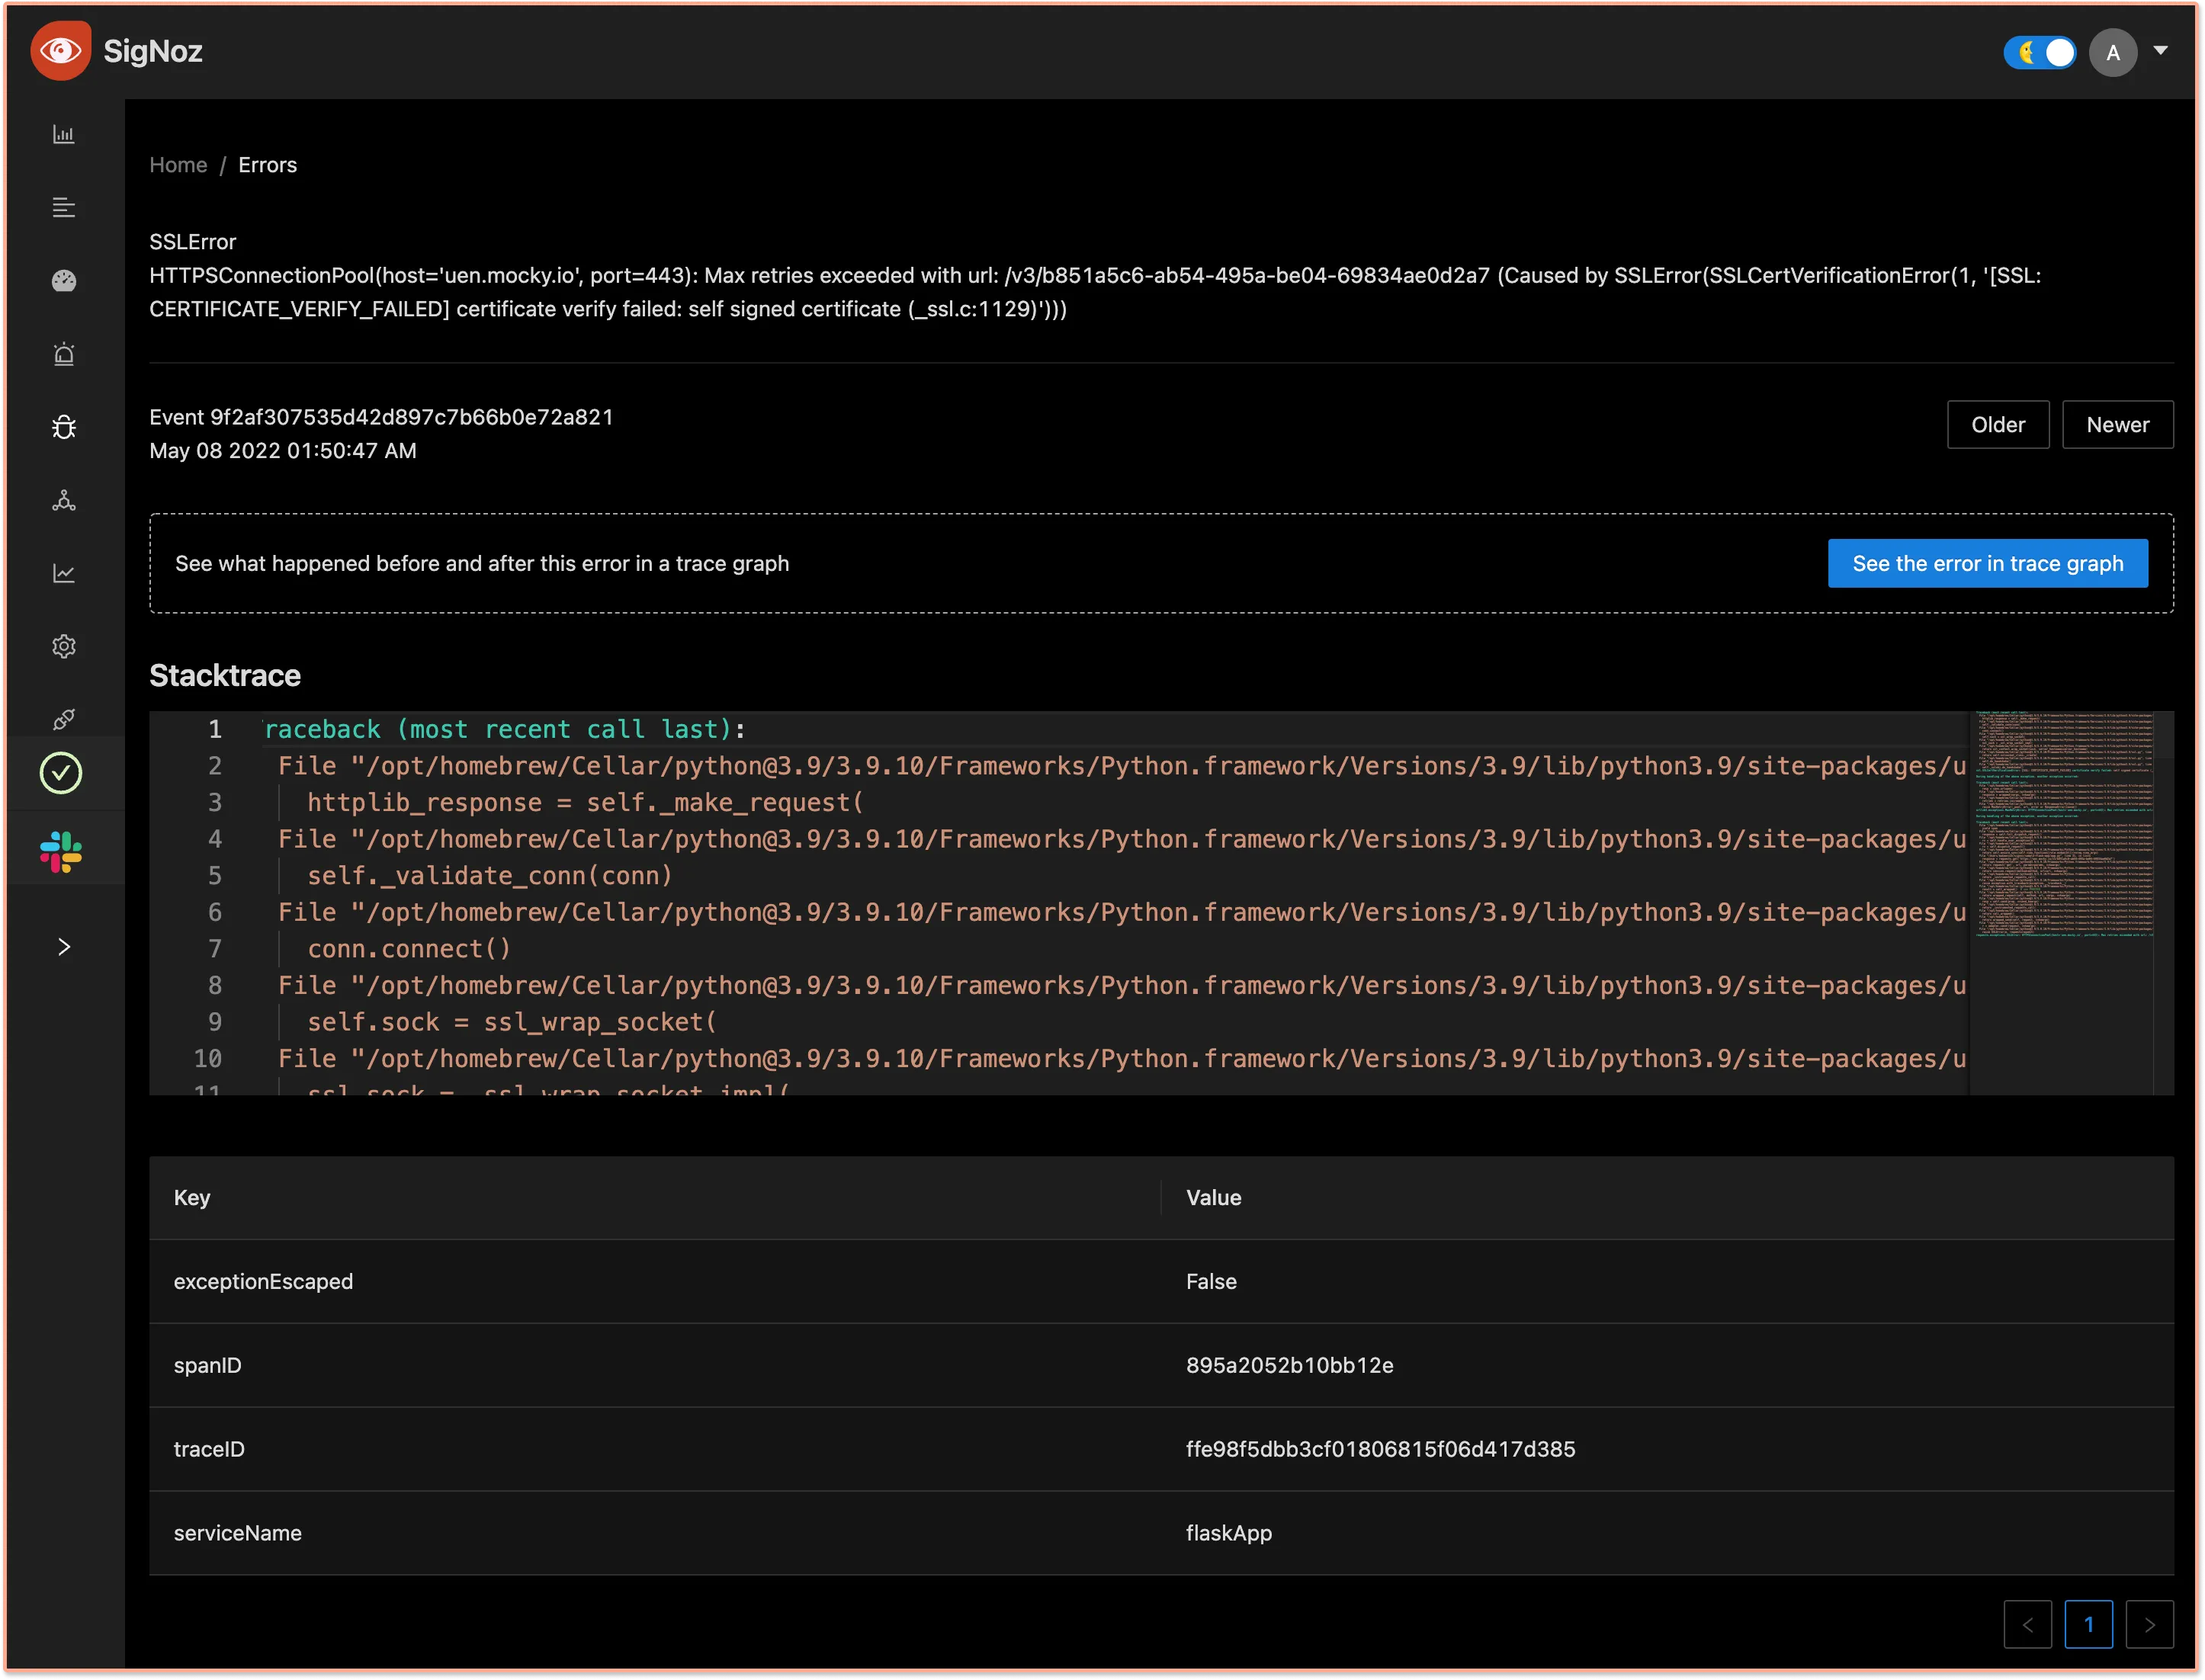
SigNoz comes with a tab for Exceptions monitoring. You can monitor popular exceptions like SSLError, ZeroDivisionError, MaxRetryError, etc., occuring in your application code at one place. We have also empowered our users to dig deeper into why these exceptions are happening.
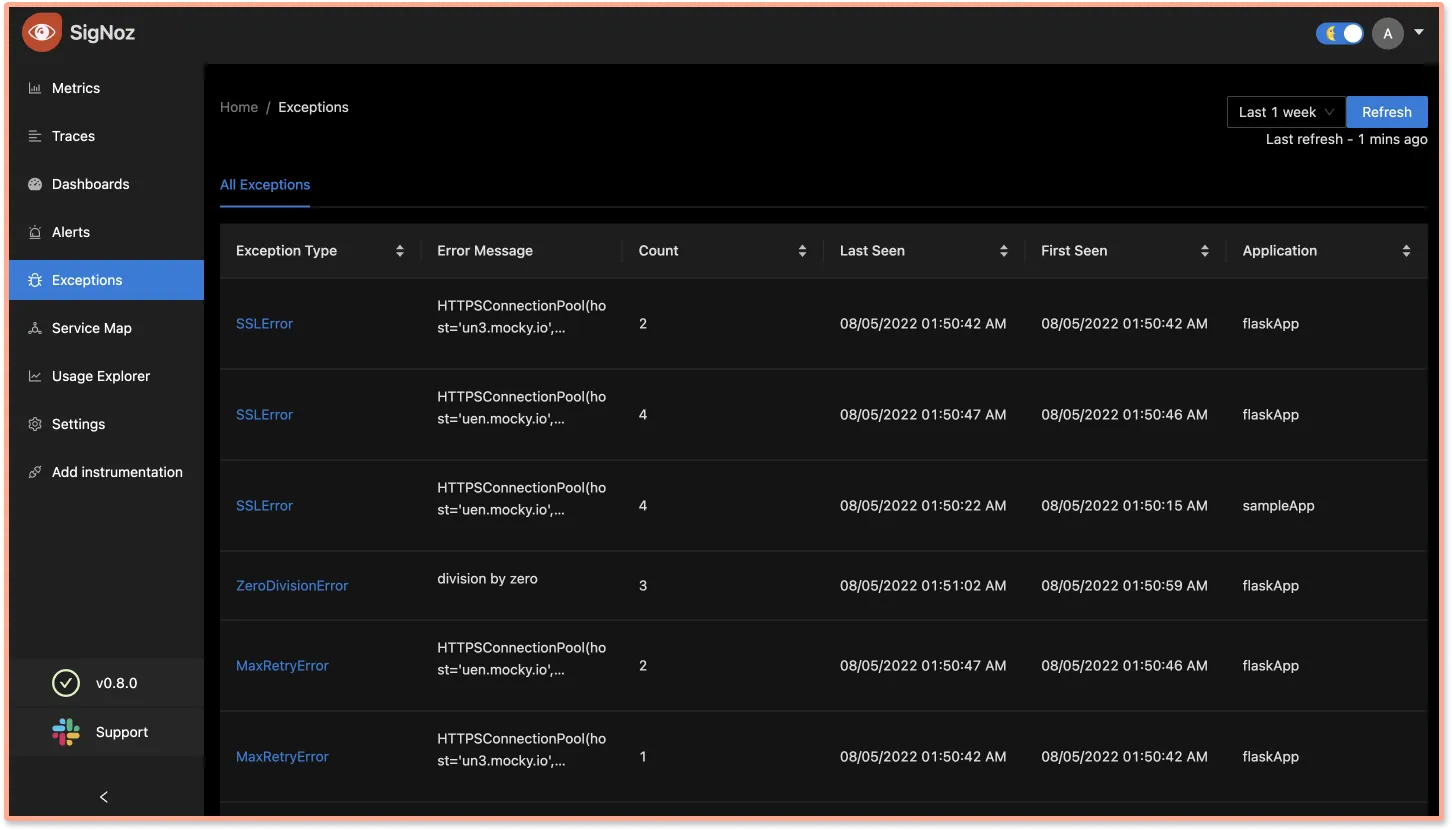
You can click on any exception to see its stacktrace and check what happened before and after the exception using our trace graphs. The trace graph enables our users to access more contextual data around why the exception occurred.
Backend storage option of ClickHouse
SigNoz uses ClickHouse for storing observability data.

ClickHouse is designed to be a very fast OLAP database. It is also low resource-intensive. For Jaeger, Cassandra and Elasticsearch are the primary supported storage backends.
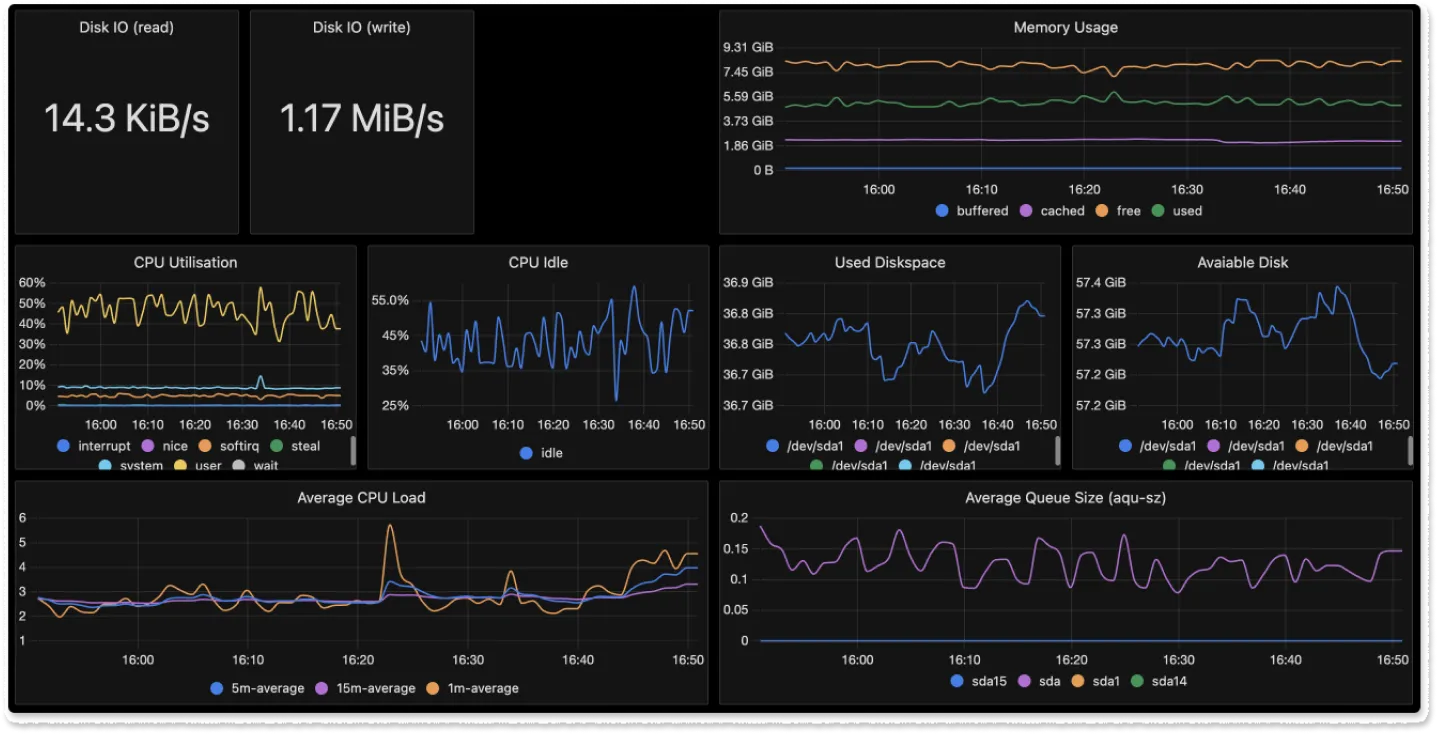
Custom Dashboards
SigNoz provides capabilities to create custom dashboards to monitor important components of your application stack like database, host metrics, and infrastructure.
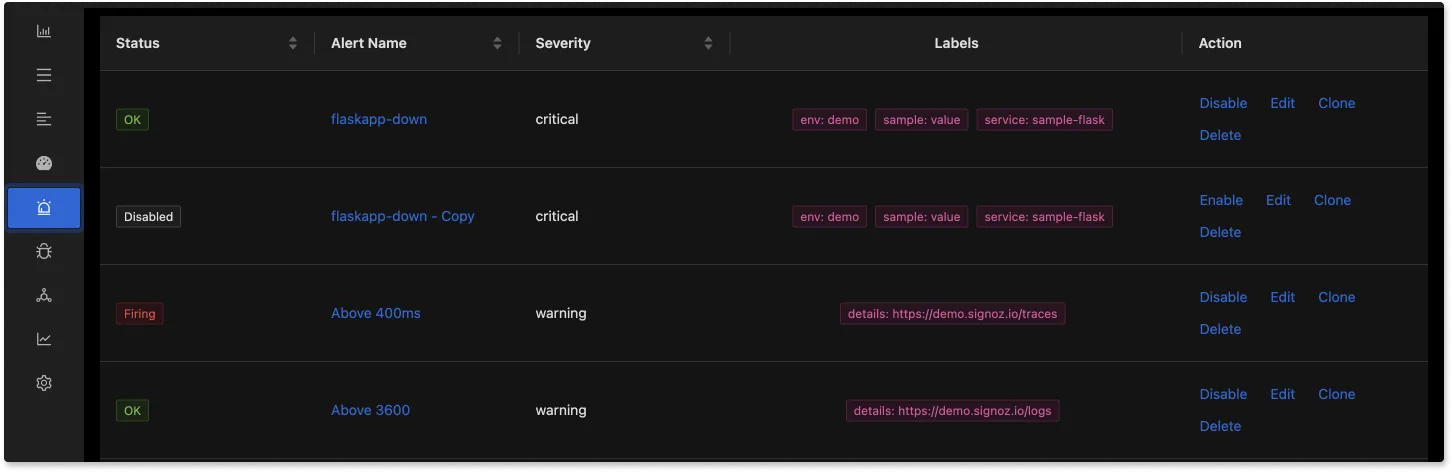
Alerts on metrics that are important for you
Using SigNoz, you can set alerts on metrics that matter to you. You can integrate alerts with popular channels like Slack and PagerDuty.
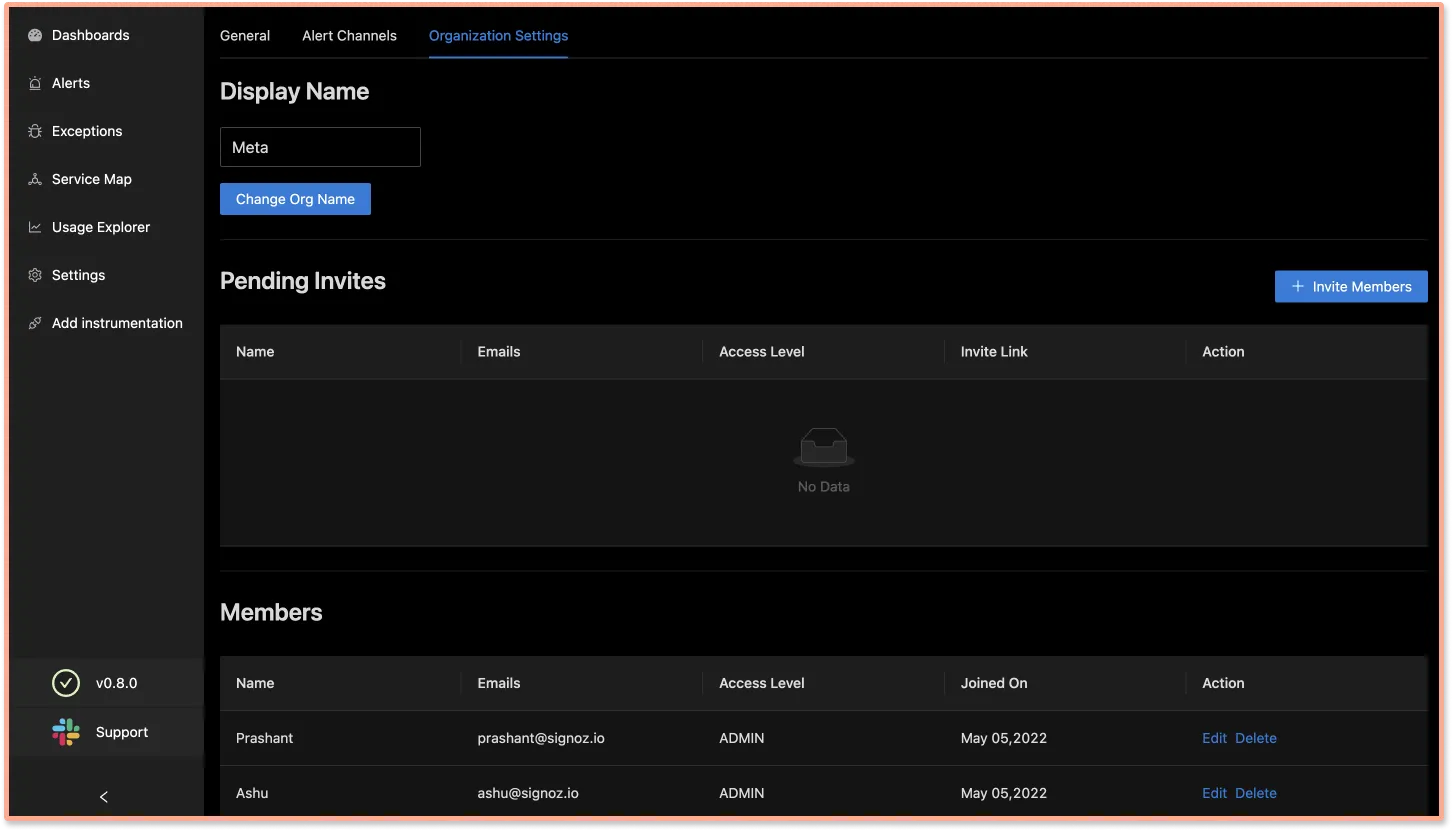
Role based access control for better team management
SigNoz comes with login, authentication, and org management. These features are critical for team collaboration and we have built some cool RBAC tools for org management. Jaeger does not support any such feature.
Org management will enable teams using SigNoz to collaborate better. There are three roles that our users can create with varying access levels:
- Admin
- Editor
- Viewer
Now that you have an idea of why you should choose SigNoz if you're considering Jaeger as a distributed tracing tool, let's see in brief two important things about SigNoz:
- How does SigNoz collects data?
- How to install and get started with SigNoz?
How does SigNoz collects data?
SigNoz uses OpenTelemetry for code instrumentation. Instrumentation is the technique of generating telemetry data(logs, metrics, and traces). OpenTelemetry is becoming the world standard for generating vendor-agnostic telemetry data. As SigNoz uses OpenTelemetry, you will never be locked in with your data. You can always shift to any analysis backend tool as most of the tools have started supporting OpenTelemetry formats of telemetry data.
How to install and get started with SigNoz?
You can get started with SigNoz using just three commands at your terminal.
git clone -b main https://github.com/SigNoz/signoz.git
cd signoz/deploy/
./install.sh
For detailed instructions, you can visit our documentation.

If you have any questions around SigNoz or need any help in setting things up, join our slack community and ping us in #support channel.

You can check out SigNoz's GitHub repo here 👇
If you want to read more about SigNoz 👇
Monitor Spring Boot application with OpenTelemetry and SigNoz
Monitor your Nodejs application with OpenTelemetry and SigNoz
