Latest Top 11 Log Monitoring Tools [Includes Open-Source]
For any software company, a log monitoring tool is a must for collecting, storing, and providing a centralized view of all logs from different applications and hosts for faster anomaly detection, incident resolution, and troubleshooting.
They can also help detect security threats and provide audit trails. They are effective in capacity planning, decision-making, and ensuring optimized performance. Logs can be of different types: syslog (or system logs), application logs, change logs, network logs, DNS logs, access logs, audit logs, container logs, and others. You need log monitoring tools to collect and analyze these logs for troubleshooting your application and infrastructure performance.
What is Log monitoring?
Log monitoring is the process of automatically collecting, analyzing, and managing logs generated by computers, applications, and other devices within an IT environment. It involves reviewing and interpreting log files to identify patterns, anomalies, or specific events that could indicate system health, security breaches, or performance issues. The goal is to ensure systems are running smoothly and securely, and to swiftly respond to any potential problems.
Top Log Monitoring Tools at a Glance
-
SigNoz: An open-source full-stack observability platform with ClickHouse-based storage for logs. Provides logs, metrics, and traces under a single pane of glass.
-
Splunk: A centralized log analysis tool with AWS integrations. It uses a drilling algorithm to find patterns and anomalies across log files.
-
SolarWinds Papertrail: A cloud-hosted log management tool.
-
ELK Stack: Open-source comprehensive solution. Has a scalable search engine for log storage and analysis, mature log shippers, and great visualizations.
-
Grafana Loki: A horizontally scalable log management solution. It’s great with 100% persistence to object storage, faster ingestion, and cheaper storage.
-
Mezmo: Formerly LogDNA, Mezmo is an easy-to-set-up log management tool that can aggregate all the logs from multiple AWS services.
-
New Relic: A full stack observability platform. It leverages machine learning platforms to surface outliers and speed troubleshooting automatically.
-
Logz.io: A version built on the ELK stack. It’s a cloud-based SaaS that provides real-time insights, automatic parsing of common log formats, and critical event resolution.
-
Datadog: Enterprise-ready full observability platform with centralized logging capabilities.
-
Dynatrace: A full stack observability platform with log management powered by AI. Its main focus is on APM.
-
Rapid7 Insight Ops: A log management tool with analytics service. It comes with log analysis tooling and REST API to automate searches, alerts, and log management.
1. SigNoz (Open-Source)
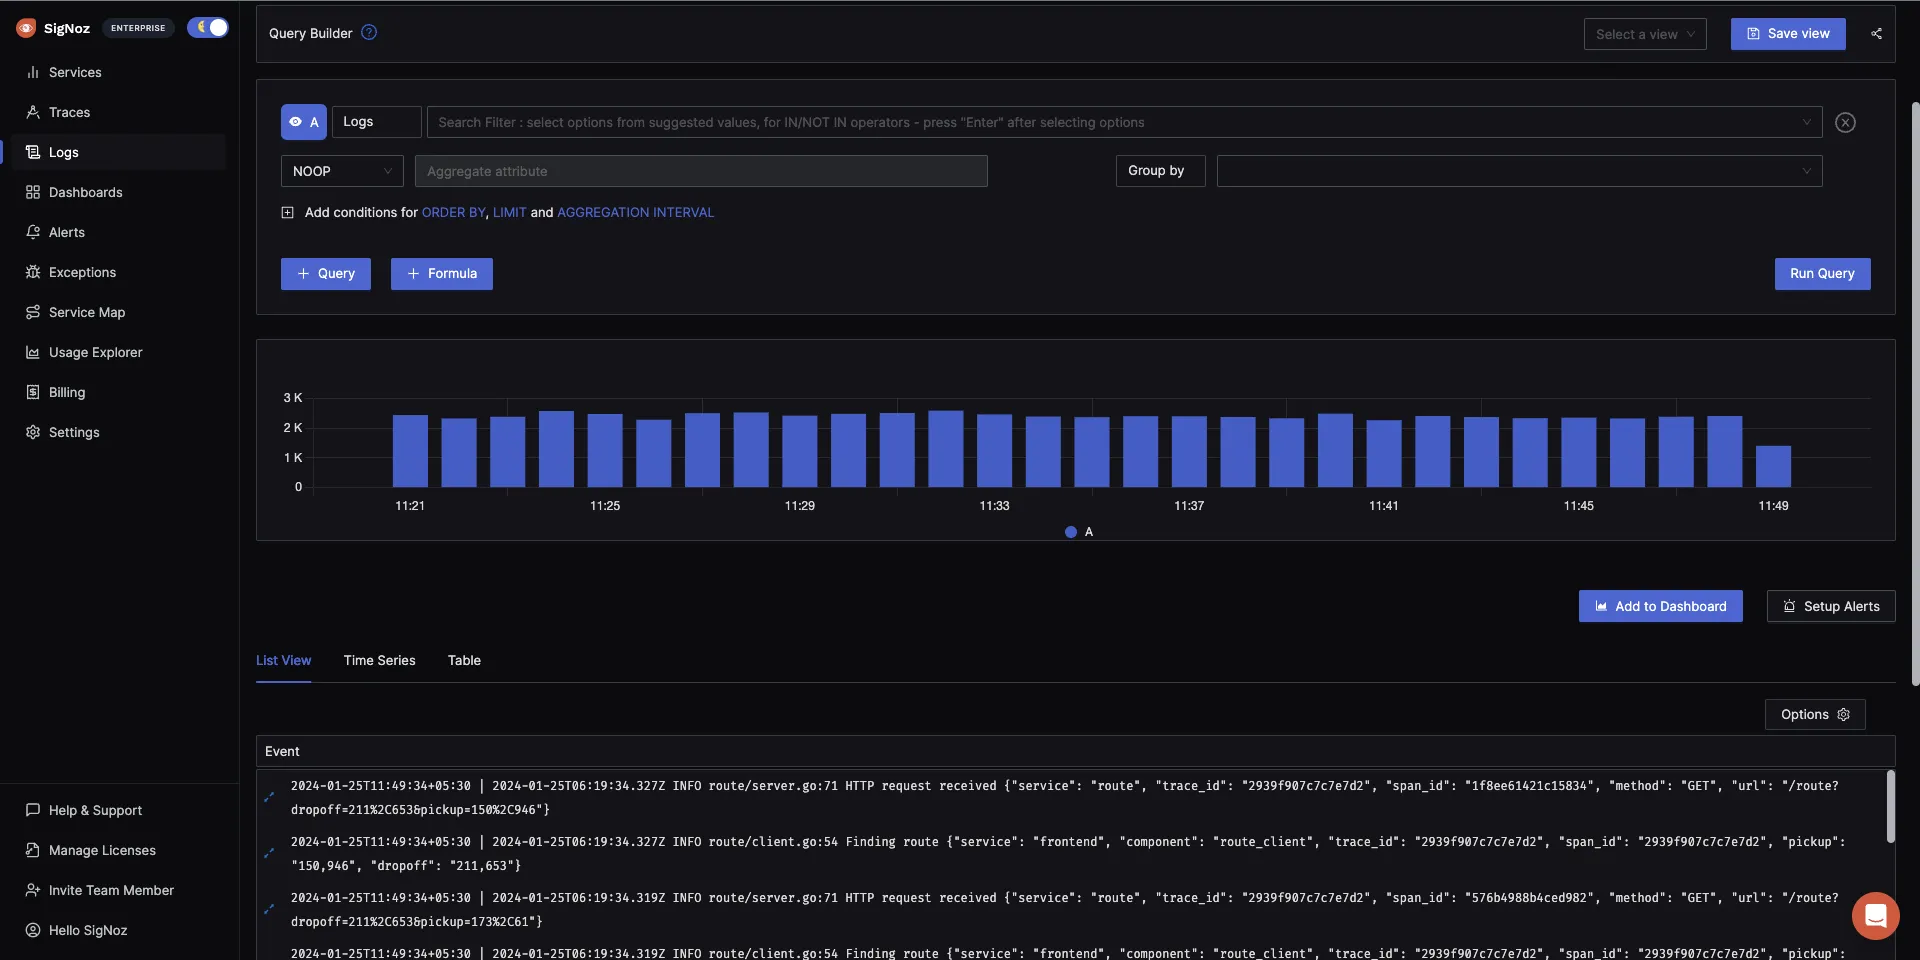
SigNoz is an OpenTelemetry-native APM platform where you can view logs, metrics and traces within a single dashboard for better correlation of signals. It can ingest, process and analyze data at any scale.
It has excellent support for any existing logging pipelines you have, including OpenTelemetry logs. In fact, it has a powerful query build to give you granular control over your data.
Features of SigNoz
- It uses columnar ClickHouse-based storage to store logs that support super-fast log analytics.
- You can leverage the query builder to write queries, apply filters, and run aggregates to get deeper visibility into your data and in-depth insights from it.
- You can build telemetry pipelines using SigNoz OTel Collector. To send data to SigNoz, integrate your pipelines with the collector, and you’re good to go.
| Pros | Cons |
|---|---|
| Open-source log management tool that allows you to build integrations and features. | Does not provide cloud SIEM |
| Uses ClickHouse columnar database for lightning-fast queries and aggregations. | Can have more integrations for ready-made dashboards |
| Provides support for other signals like metrics and traces with strong correlation | |
| Found to be 2.5x faster than ELK and consumed 50% less resources |
2. Splunk
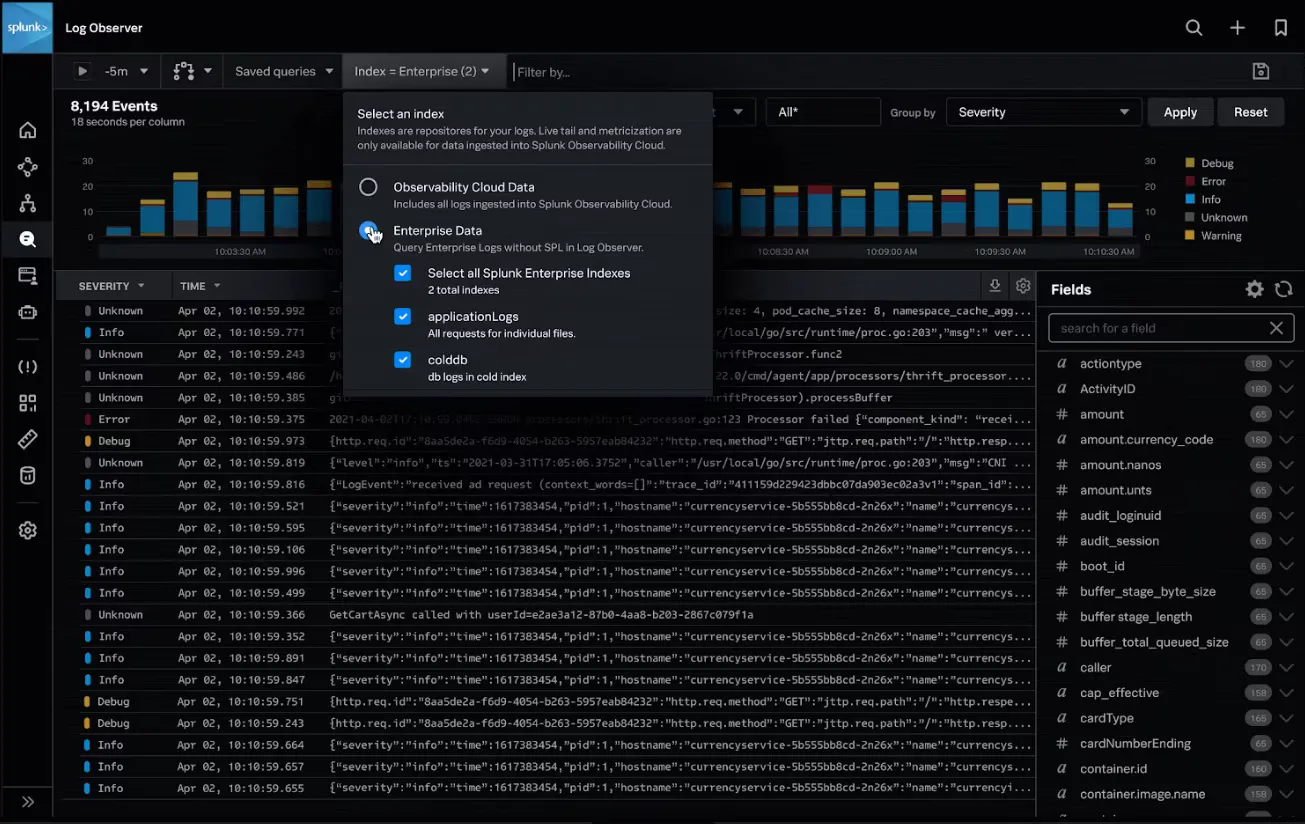
Splunk is a centralized log analysis tool that can help you resolve incidents faster with log filtering and aggregations. In fact, it can analyze log aggregates from a big service cluster and provide real-time visibility and improved GUI.
It supports seamless integrations with AWS solutions, Kubernetes, and other popular data sources. Moreover, it has a powerful query language to help you search and analyze everything. It’ll also automatically shift frequently accessed data to fast storage for easy accessibility.
Features of Splunk Log Manager
- It can identify and analyze logs of any type: unstructured, structured, sophisticated, multi-line.
- It uses a drilling algorithm to find patterns and anomalies across log files.
- Likewise, it has a robust monitoring system to help you stay on top of alerts and is perfect for enterprise-level customers.
| Pros | Cons |
|---|---|
| It has a single automated dashboard output for supporting visual reporting needs. | It can be expensive in comparison to other services. |
| It’s a part of an infrastructure monitoring system hence it’s an enterprise-ready solution. | A steep learning curve, especially while optimizing for speed, which can make tracking down problems an issue. |
| Its live-tail feature allows you to view, filter, and analyze logs in real time. |
3. SolarWinds Papertrail
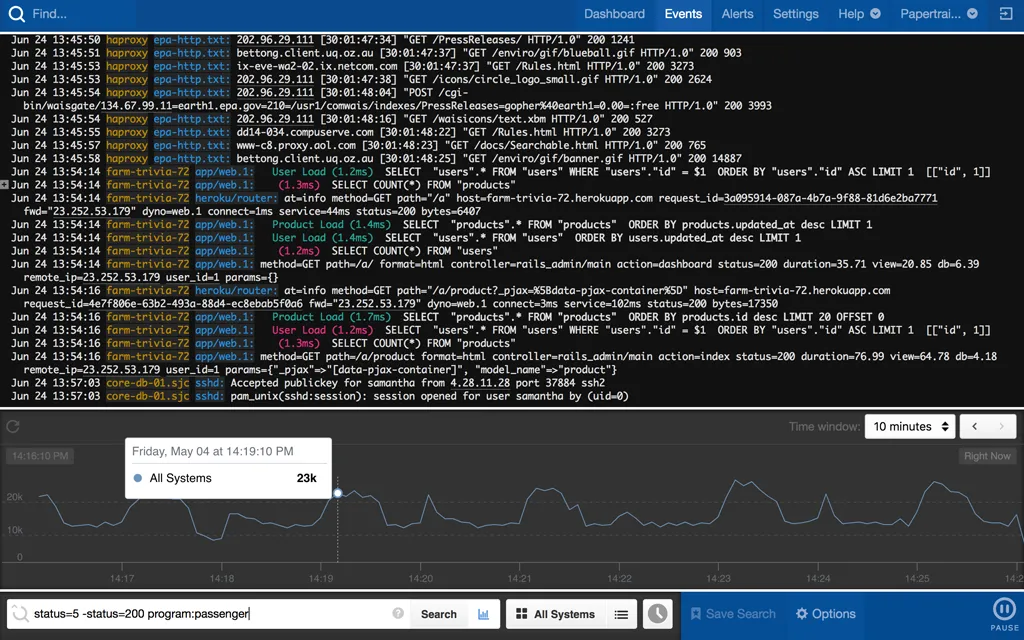
A cloud-hosted log management tool, SolarWinds Papertrail is great for fast troubleshooting and takes a few minutes to set up. In fact, you can consolidate all your logs with SolarWinds Papertrail’s simple and intuitive interface.
It has built-in archiving and can support you during spikes. You can send data over syslog and then use tail search for quick searches. You can also detect trends or spot weekly patterns.
Features of SolarWinds Papertrail
- It has a lightning-fast search for searching through thousands of logs.
- You can integrate Papertrail with popular tools and keep your data archived.
- Your team can enjoy visibility, even if they’re not too technical, without confusing SSH/RDP details.
| Pros | Cons |
|---|---|
| It comes with log velocity analytics for all aggregated logs and data. | You can only visualize log volume and no other data. |
| It’s affordable for low data volumes. | It lacks advanced log parsing and other useful features. |
| It has no learning curve, thanks to the adaptable UI. |
4. ELK (Open-Source)
ELK, short for Elasticsearch, Logstash, and Kibana, are three open-source software components that work as a centralized log management solution. You can collect, aggregate, analyze, and visualize log data generated by different devices and applications.
In addition to real-time visibility, alerting, and role-based access control, it’s great with advanced functionalities like security analytics. ELK can be useful for fraud detection, safety analysis, web analytics, and business intelligence.
Features of ELK Stack
- The ELK Stack supports flexible data processing as Logstash can define custom data processing pipelines.
- Kibana’s visualization dashboards and charts help to look up logs or spot trends extremely easily.
- Together, the three software components can handle large volumes of data.
| Pros | Cons |
|---|---|
| Elasticsearch’s default indexing makes search fast. | Difficult to scale if production support is missing. |
| Data is parsed and enriched before being stored. | Installation can be difficult. |
| No steep learning curve with a wide range of web tutorials. |
5. Grafana Loki (Open-Source)
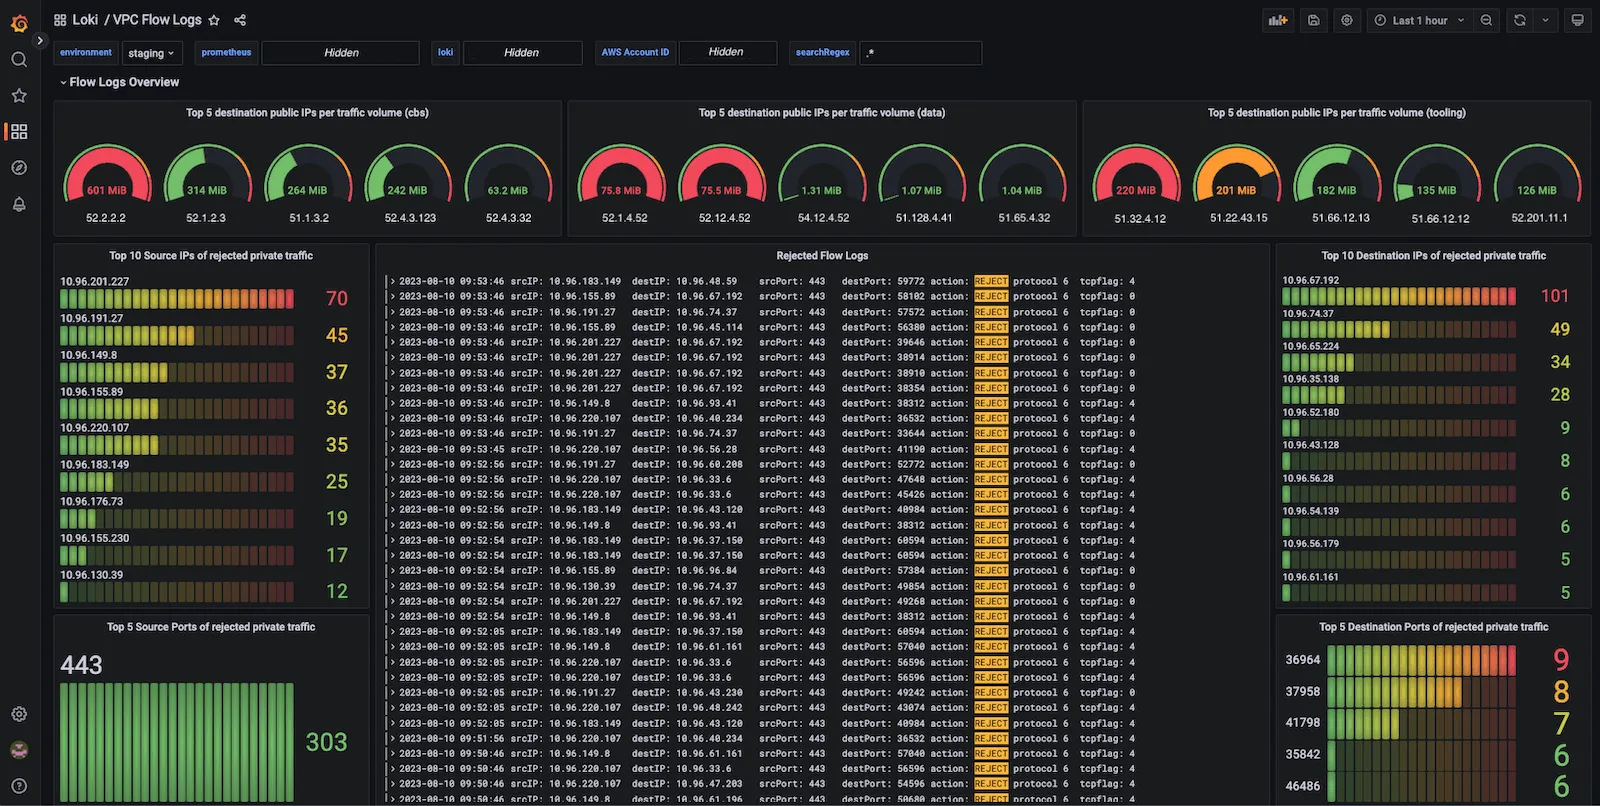
Grafana Loki is a multi-tenant log aggregation system that’s horizontally scalable and inspired by Prometheus. It maintains logs and metrics in the same UI and indexes a set of labels for each log stream.
You can index some labels and create a new architecture. Moreover, Ingester, its main write component, will store chunks of logs in memory so that they can be queried quickly. Once they start to get old, they will be stored in Cassandra, a key-values store, or Amazon S3, an object store. Querying old data is simple, with labels and timeframe.
Features of Grafana Loki
- Loki works by indexing metadata rather than entire log lines. You can then build metrics and generate alerts from here.
- It has no ingestion log formatting requirements, so you can also format it at query time.
- It integrates with Prometheus, K8s, and Grafana natively, so you can use a single UI to move across metrics, logs, and traces.
| Pros | Cons |
|---|---|
| You can filter logs easily based on your needs. | Data storage and data collection must be separately set up. |
| Requires less storage than log aggregation systems. | It can’t correlate across multiple data types as seamlessly as its competitors. |
| It’s simple to operate and incredibly cost-effective. |
6. Mezmo
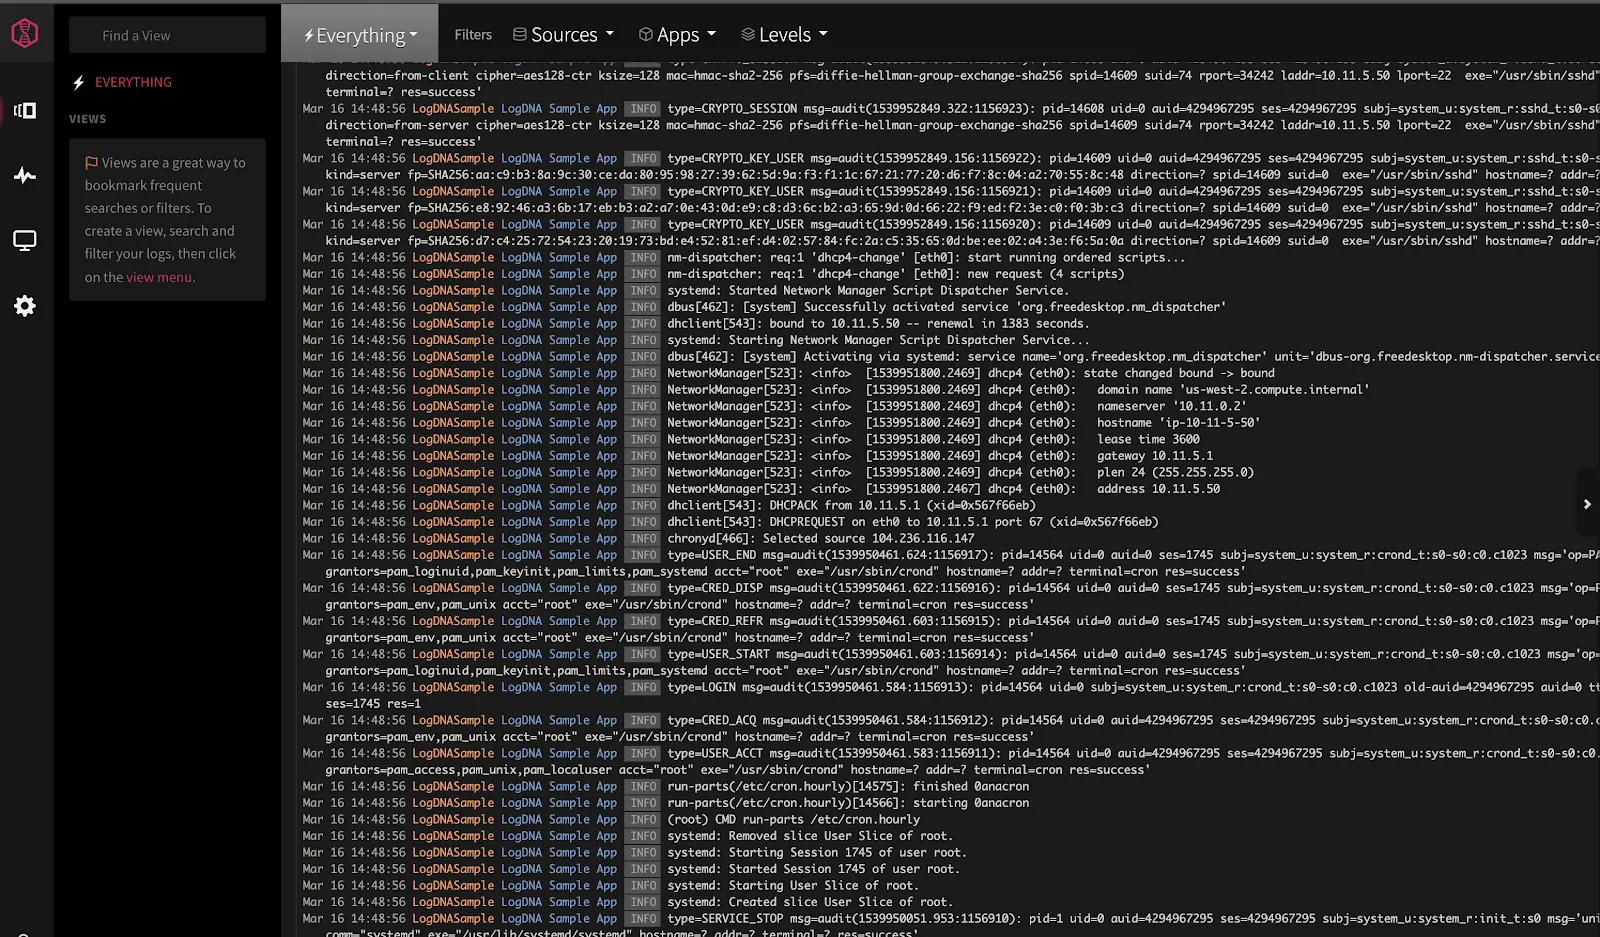
Formerly LogDNA, Mezmo is an easy-to-use log management tool that’s available as a service and an on-premise tool. It ingests data from multiple sources, organizes it into logs, and routes it to several teams and machines.
Mezmo supports agent-based and agentless log collection, via syslog and HTTP(S) plus full-text search. You can also visualize and build dashboards.
Features of Mezmo
- It supports intuitive and powerful querying.
- Mezmo, formerly LogDNA, can aggregate critical log events to help you spot patterns and trends.
- You can set up exclusion rules for logs you don’t want to store, or quick log data exploration to bring back log data that’s archived.
| Pros | Cons |
|---|---|
| It’s built to scale and can automatically parse common log formats. | Other performance monitoring isn’t supported. |
| You can use index rate alerting for quick alerts. | There have been complaints of indexing lag. |
| The pricing is quite competitive. |
7. New Relic
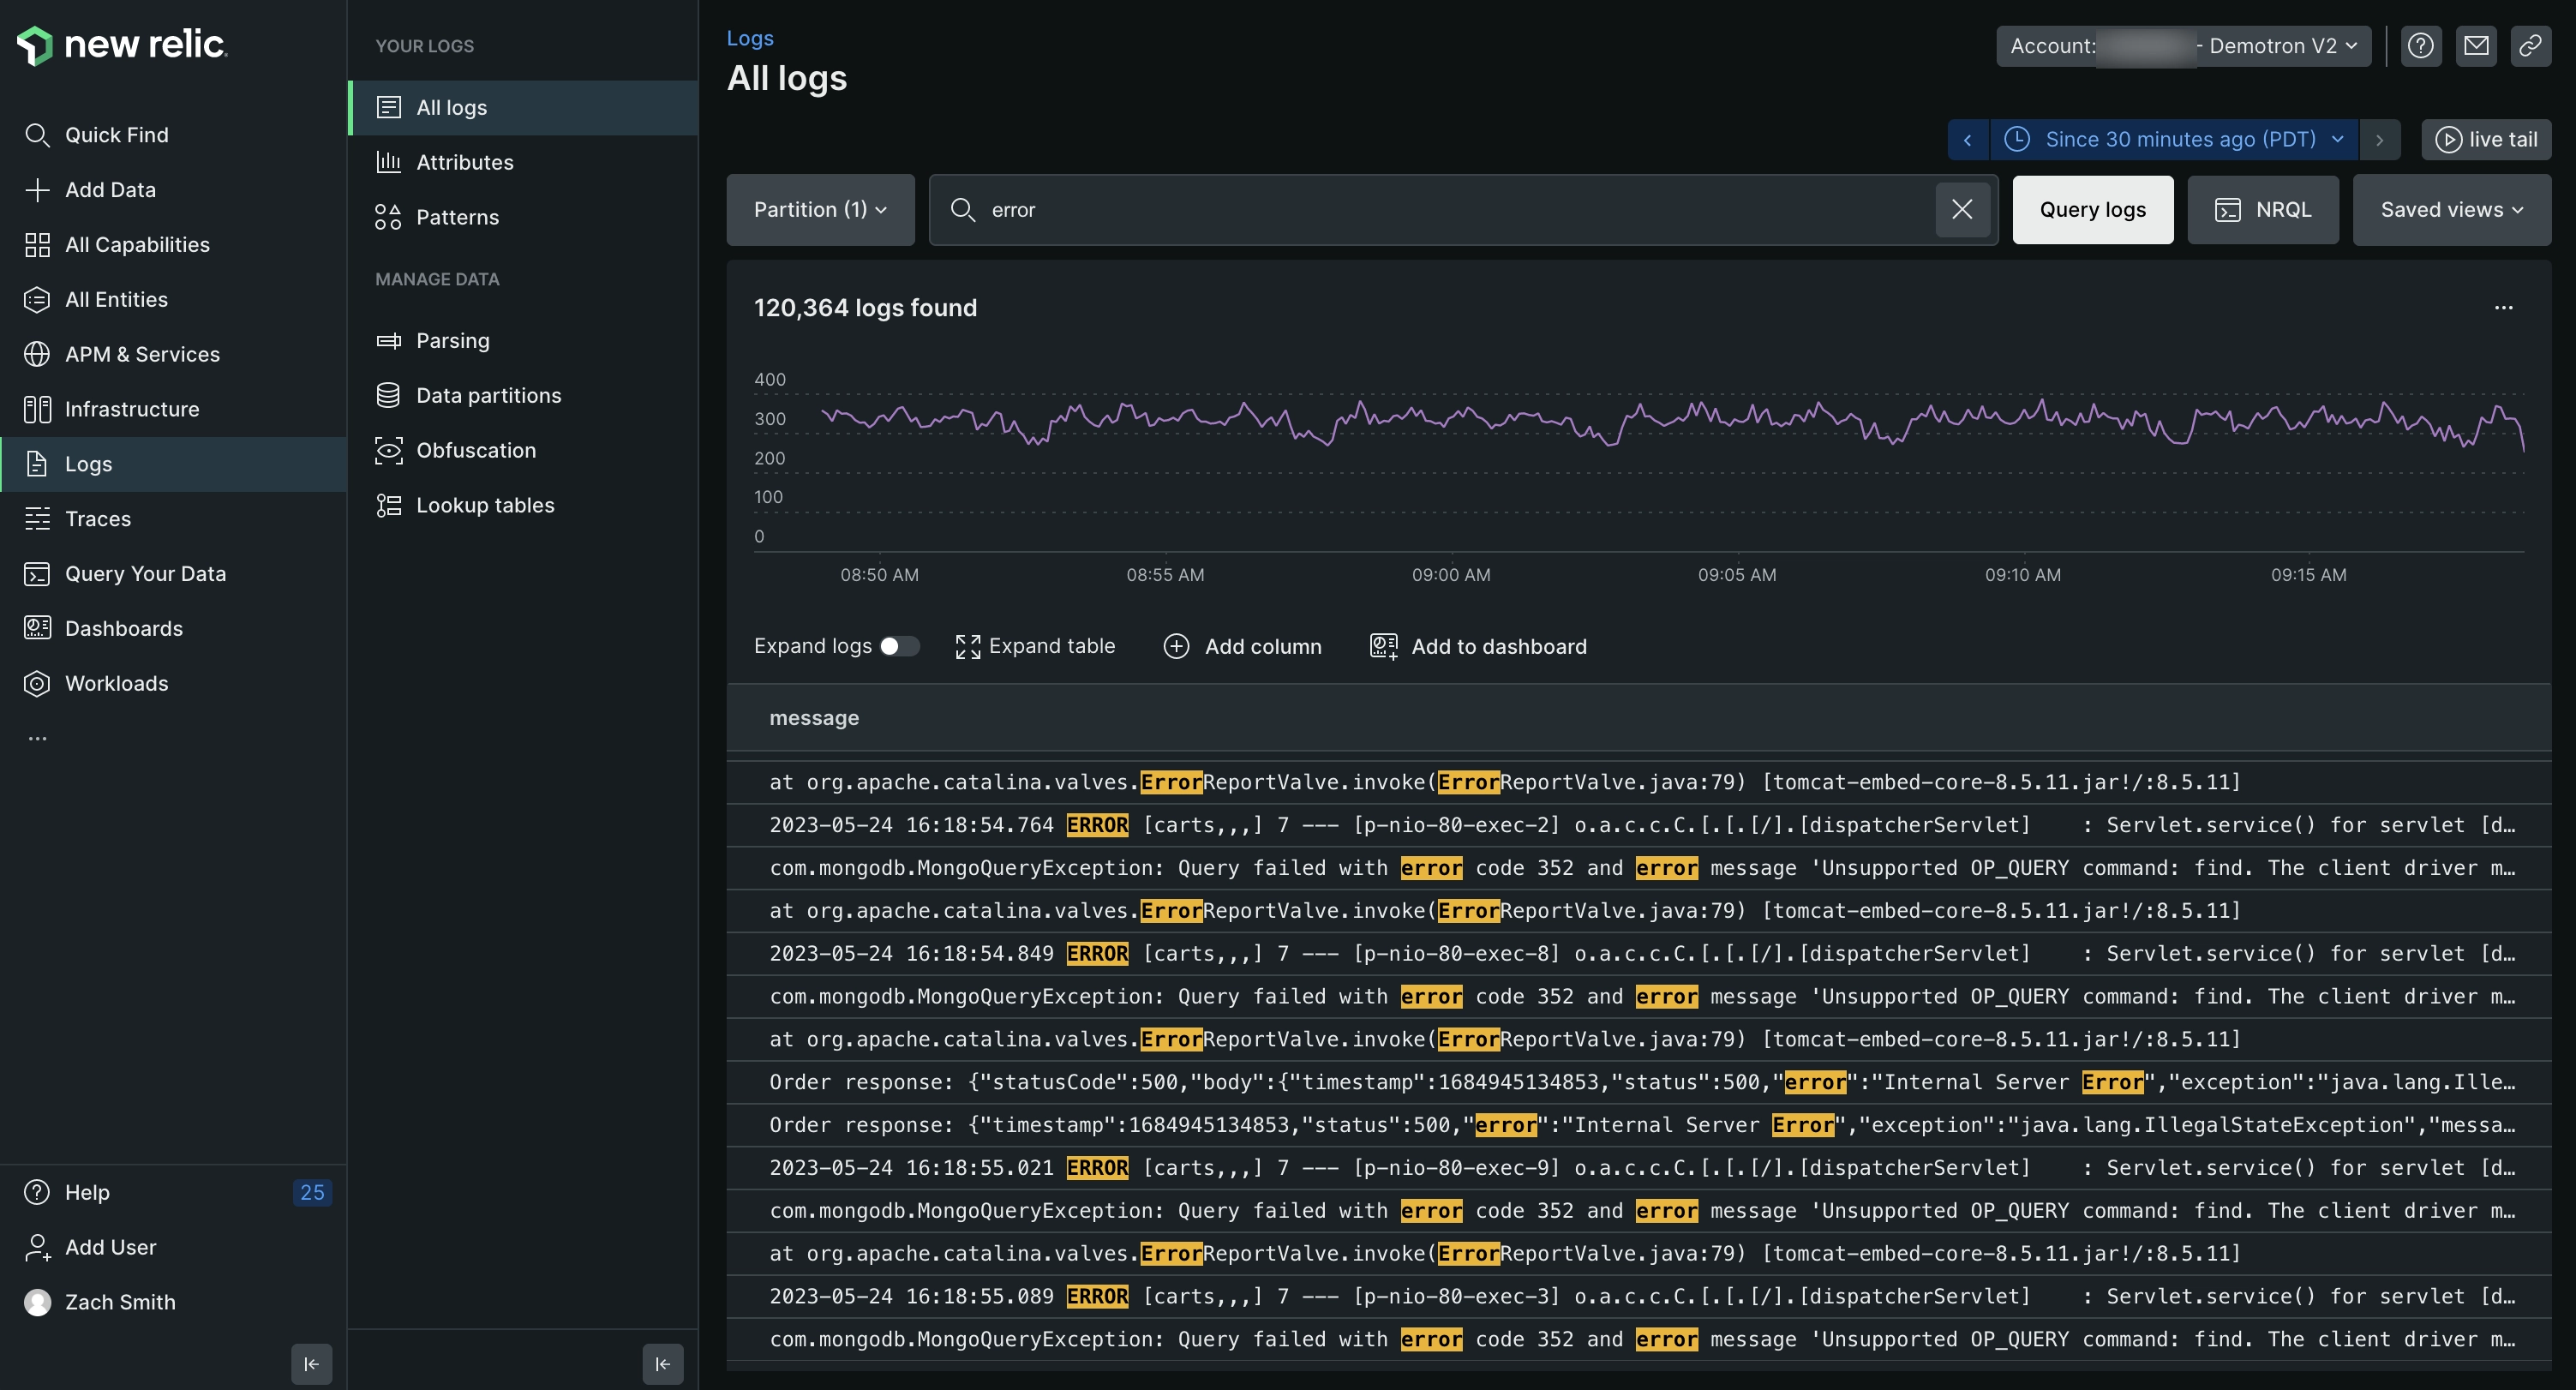
New Relic is a log management tool that has an open-source foundation, a simple setup process, and a near-instant search. In fact, you can enjoy deeper visibility and full contextual log information using New Relic.
It’s a programmable platform that supports fast troubleshooting and the option to explore millions of log messages in a click.
Features of New Relic Log Manager
- It is part of a central telemetry data platform with built-in functionality but also supports integration with third-party and open-source technologies.
- It uses machine learning to detect patterns and outliers in your log data.
- You can see curated logs by New Relic to pinpoint problems faster with an Excel-like interface.
| Pros | Cons |
|---|---|
| You can get automatic notifications through New Relic or Slack and PagerDuty by configuring alerts and dashboards. | It can require a steep learning curve, as the platform can be technical. |
| You can ingest any text-based data, and it’ll automatically scale to the volume you use. | Help resources are scanty. |
| It has a user-friendly GUI with dynamic reporting and site speed monitoring. |
8. Logz.io
Logz.io is an open-source observability platform that’s known for its machine learning and predictive analytics. This SaaS platform uses ELK stack as a service to analyze logs of any volume in the cloud. You can use this cloud-based platform to simplify critical event resolution.
You can get real-time insights, enjoy fast set-up, and reap the benefits of dynamic scaling and AWS-built data protection.
Features of Logz.io
- You can use Logstash to send data and Kibana to visualize logs.
- You can visualize the logs and metrics in a singular UI.
- Its cognitive analysis features help reduce errors by spotting them early on.
| Pros | Cons |
|---|---|
| It’s fully stacked, so doesn’t require managing. | On-premises service isn’t supported. |
| You can get access to pre-built dashboards to visualize log data. | Only the enterprise plan has API availability. |
| There are added features like automatic alerting. |
9. Datadog
Datadog is an observability SaaS platform with log management capabilities. You can process, search, and analyze logs at scale in a single view. In fact, analyzing log data will provide rich context.
Datadog’s centralized log management is great for complete visibility and rapid troubleshooting. You don’t have to master any complex query language. You can also set daily processing quotas.
Features of Datadog Log Manager
- You can log without limits, and it has useful features like live tail, live search, quick ingest, and archive.
- You can go more than standard retention by adjusting your retention and querying capacity independently.
- Datadog also works with a server-side processing pipeline for parsing and enriching logs.
| Pros | Cons |
|---|---|
| It automatically detects common log patterns. | This SaaS isn’t available on-premises. |
| You can easily archive logs to AWS/Azure/Google Cloud storage. | Cost can get expensive due to flexible pricing policies. |
| It supports native integration with Datadog metrics and traces. |
10. Dynatrace
Dynatrace is a log-management and analytics tool with its main focus on APM. It’s part of a larger monitoring tool that allows deep insights into your full application stack. However, its log monitoring capabilities include powerful alerting, AI-powered root cause analysis of issues, and real-time unified observability.
It’s perfect for enterprises that often need to rely on other infrastructure monitoring aspects. You can also optimize storage costs, take advantage of native Kubernetes integration, and isolate attack patterns frequently.
Features of Dynatrace
- You can retain logs from years to suit audit requirements and transform log fields to meet compliance needs.
- Dynatrace supports AI-powered baselining and anomaly detection for faster resolution.
- You can take advantage of AI-assisted analytics to diagnose cluster health as well as troubleshoot incidents.
| Pros | Cons |
|---|---|
| You can reduce MTTR by eliminating manual correlation across log lines. | Pricing might be expensive, especially when you’re scaling. |
| You can collect and parse data in real-time without indexing. | Steep learning curve and poor documentation. |
| AI automation can make simple or complex jobs attainable. |
11. Rapid7 InsightOps
Rapid 7 InsightOps, formerly Logentries, is a simple log management tool perfect for companies of all sizes. As it’s a part of a large infrastructure management tool, you can enjoy end-to-end visibility and an overview of all infrastructure analytics within a single console.
You can centralize all logs from on-premise systems or cloud-based systems. You can also use the REST API available to automate simple tasks to reduce alert detection times or incident resolution durations.
Features of Rapid7 InsightOps
- You can organize, search, and filter your logs using tags. You can also find contextual information about each log almost instantly.
- In fact, in addition to enhanced log analysis tooling, you can also leverage the Collector to sort your unstructured data automatically to a JSON format.
- It has a SQL-like query language to build queries. You can also use JSON & KVP, logical operators, and IP.
| Pros | Cons |
|---|---|
| You can automatically parse syslog and Apache logs and NGINX logs. | Rest API is in beta, so still needs improvement. |
| Has an intuitive UI for search and alert processing. | Data retention is usually available for 30 days. |
| It can deal with spikes faster and more effectively. |
Choosing the Right Log Monitoring Tool
Let’s take a quick look at the top questions you should consider when choosing the right log monitoring tool:
-
Collection: How good is the log monitoring tool at collecting data? Does it integrate natively with Kubernetes or Telemetry? Is data collection automated, or does it include frequent manual interventions?
-
Searchability: How good is the log monitoring tool at searching logs or filtering through them? Does it use tags to sort logs? Can it search archived or very old logs? Does it have advanced functionalities to reduce search time?
-
Analysis: How feature-rich is it when it comes to analyzing and visualizing your logs? How advanced are the visualizations, graphs, or charts? Does it share automated reports to help spot weekly trends or frequent patterns? Does it have anomaly detection to streamline analysis and support reduced log management times?
-
Security: How safe is your data in storage? Would your data be prone to leaks and breaches? What compliance methods or regulations does the log management tool abide by?
-
Advanced Features: Are you able to build complex queries for log management? Can you automate simple processes? Does it give you access to an API? Do they have an AI that actually helps troubleshoot log issues?
Conclusion
Proper log management is essential to improve data access as well as strengthening an organization’s security implications. When you collect and store logs in a centralized location, you’re able to detect anomalies and incidents faster. That’s crucial to ensuring faster resolution times and fewer downtimes. When choosing the right tool, consider functionality, ease of use, and pricing. Each tool has specific features designed to help you improve log management.
SigNoz can be a good choice as a log monitoring tool. Bigger companies like Uber and Cloudflare have shifted to columnar-based storage for logs, and SigNoz leverages that power to provide efficient log storage. It also provides an intuitive query builder to search through logs easily.
If you’re looking for an all-in-one OpenTelemetry solution that’s also open-source and easy to use, consider SigNoz. It’s a full-stack observability tool that takes care of traces, metrics, and logs in a single console.
Further Reading
SigNoz vs ELK vs Loki: The Battle of Open-Source Log Tools
