Metrics Explorer - Search, Query, and Analyze all your Metrics at one place
If you’ve ever found yourself staring at a dashboard dropdown, wondering, “What metrics am I even sending to my observability tool?”, you’re not alone.
For most engineering teams, answering even the most basic telemetry questions is about as hard as catching a Mewtwo. Frustratingly elusive and way more complicated than it should be, like:
- Which metrics are actively being ingested?
- What types are they (counter, gauge, histogram, etc.)?
- How many time series and samples are they generating?
- Which services, hosts, or integrations are pushing the most data?
We built Metrics Explorer to finally answer all of these questions instantly, and in one place.
Why Did We Build This?
Metrics Explorer was born out of direct user demand. Teams were onboarding new services, adding integrations, or troubleshooting alerts and their first question was always, “Is my metric even making it into SigNoz? If yes, what does it look like?”
Until now, the only way to find out was by building a dashboard and hoping you picked the right metric from a dropdown. Not exactly confidence-inspiring.
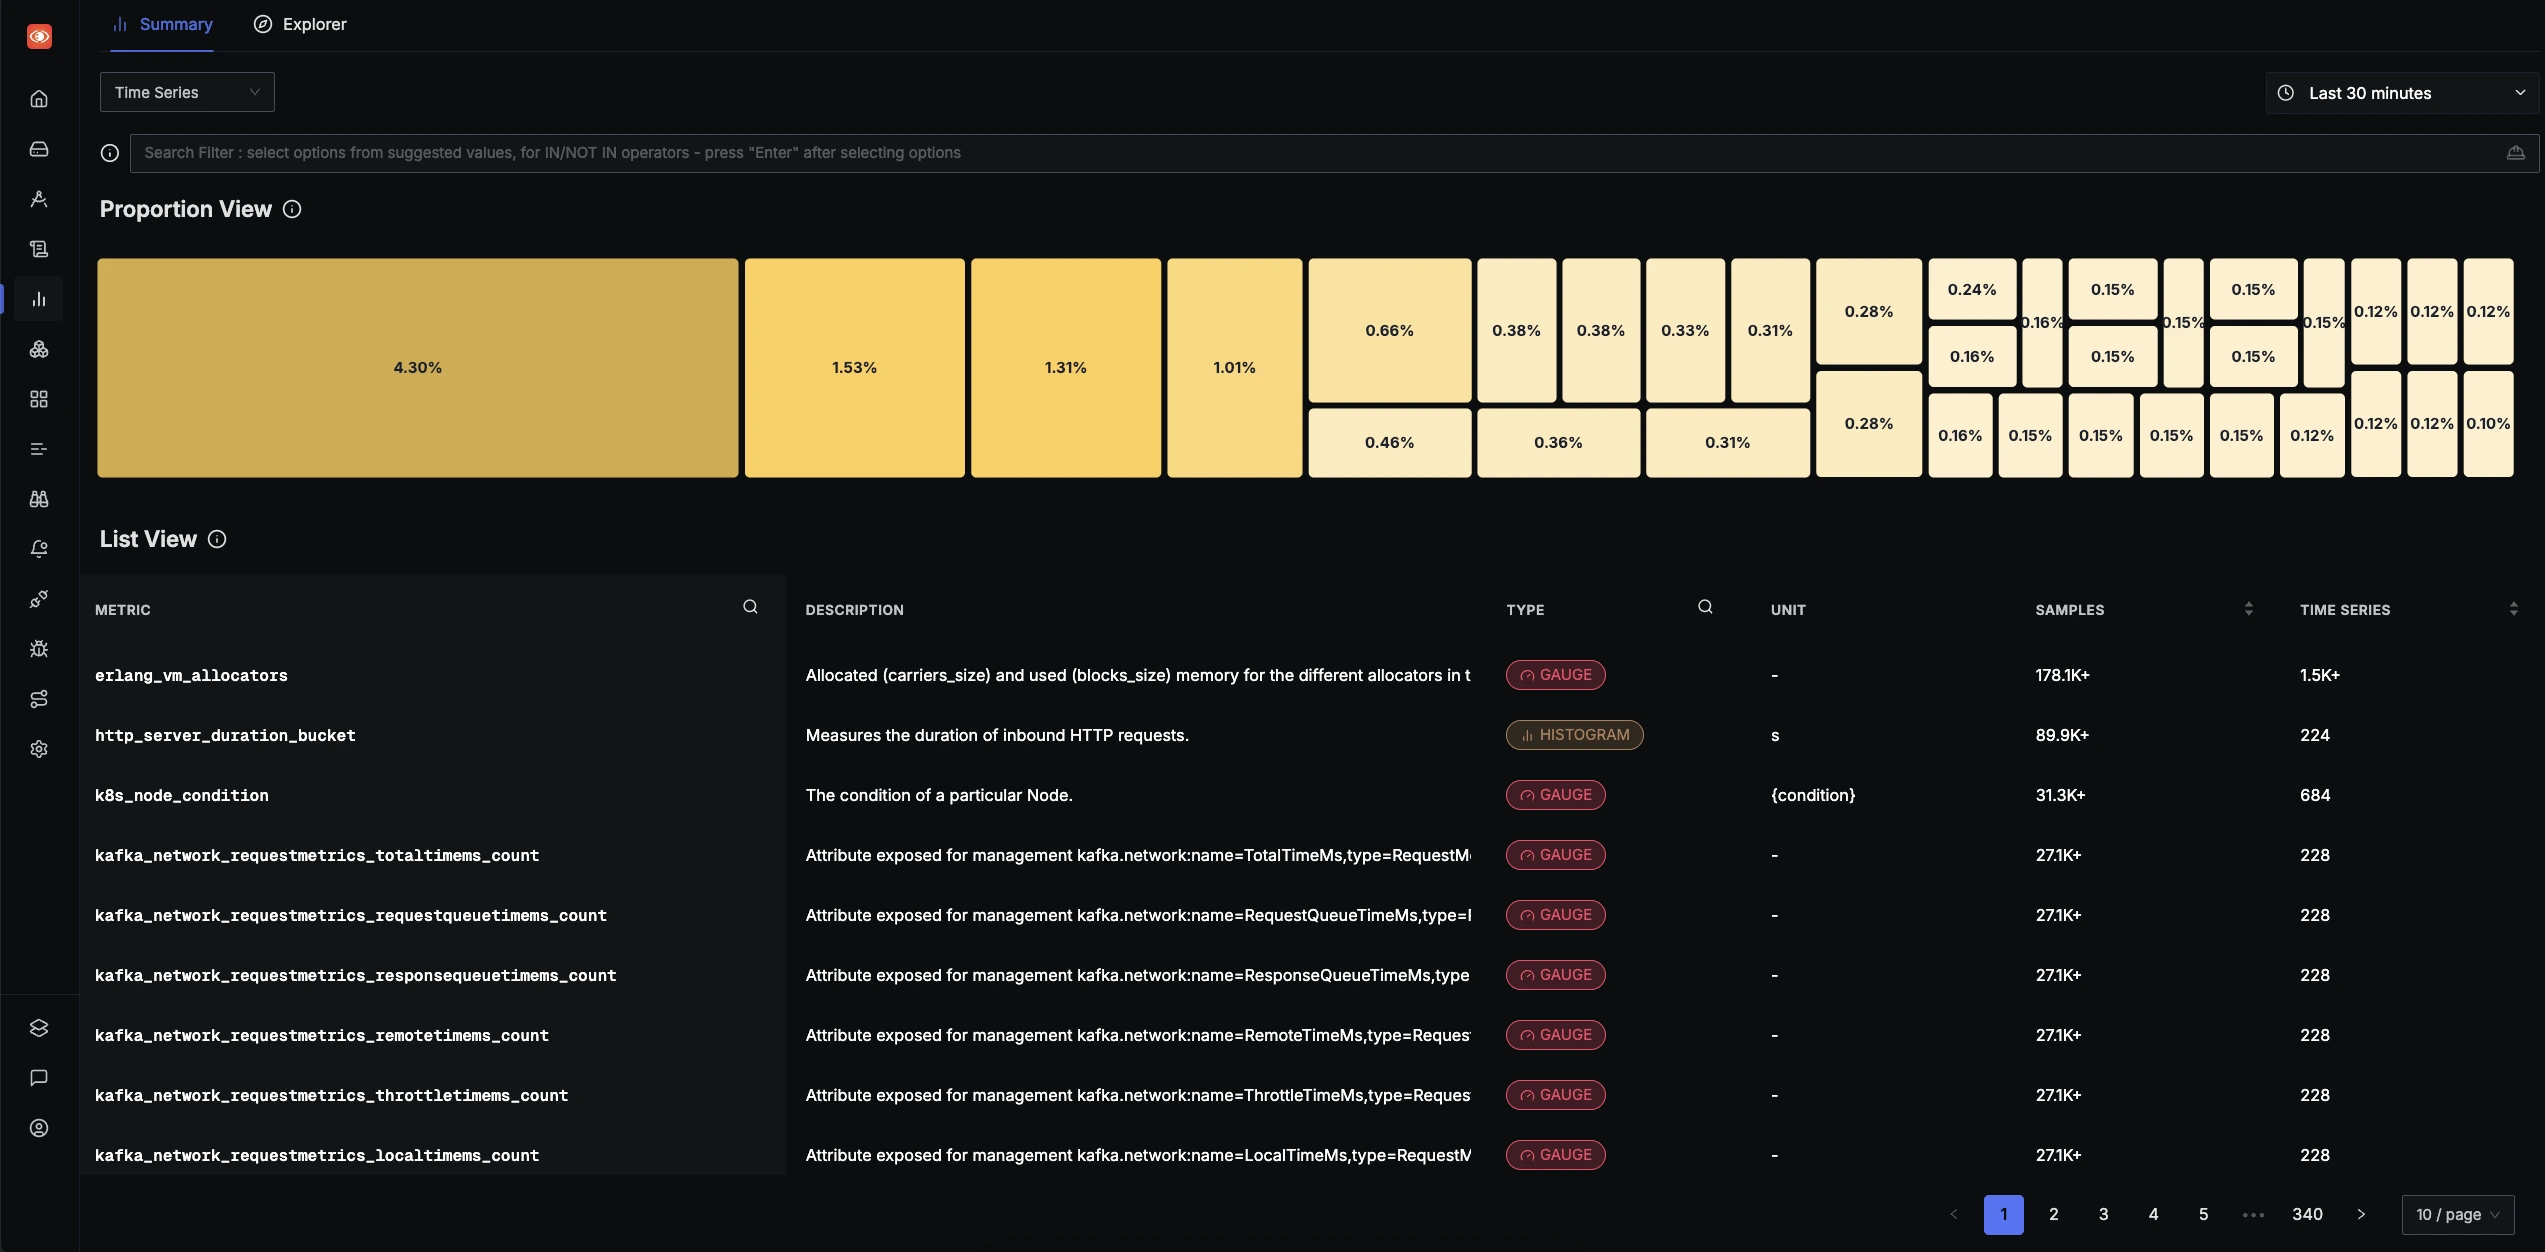
Now, with Metrics Explorer, you get a real-time, searchable summary of every metric flowing into your system, complete with types, sample counts, time series, and more.
What Can You Actually Do?
1. See Everything, Instantly

The summary view gives you a one-glance breakdown of all metrics currently being ingested. You’ll see:
- Metric names, types, and units
- Sample and time series counts (with breakdowns by service, host, or label)
- A “proportion view” showing which metrics are eating up most of your ingestion pipeline
2. Troubleshoot Faster

Ever get an alert and wonder, “What’s really going on?” Jump straight from an alert to Metrics Explorer. You can:
- Search for the affected metric
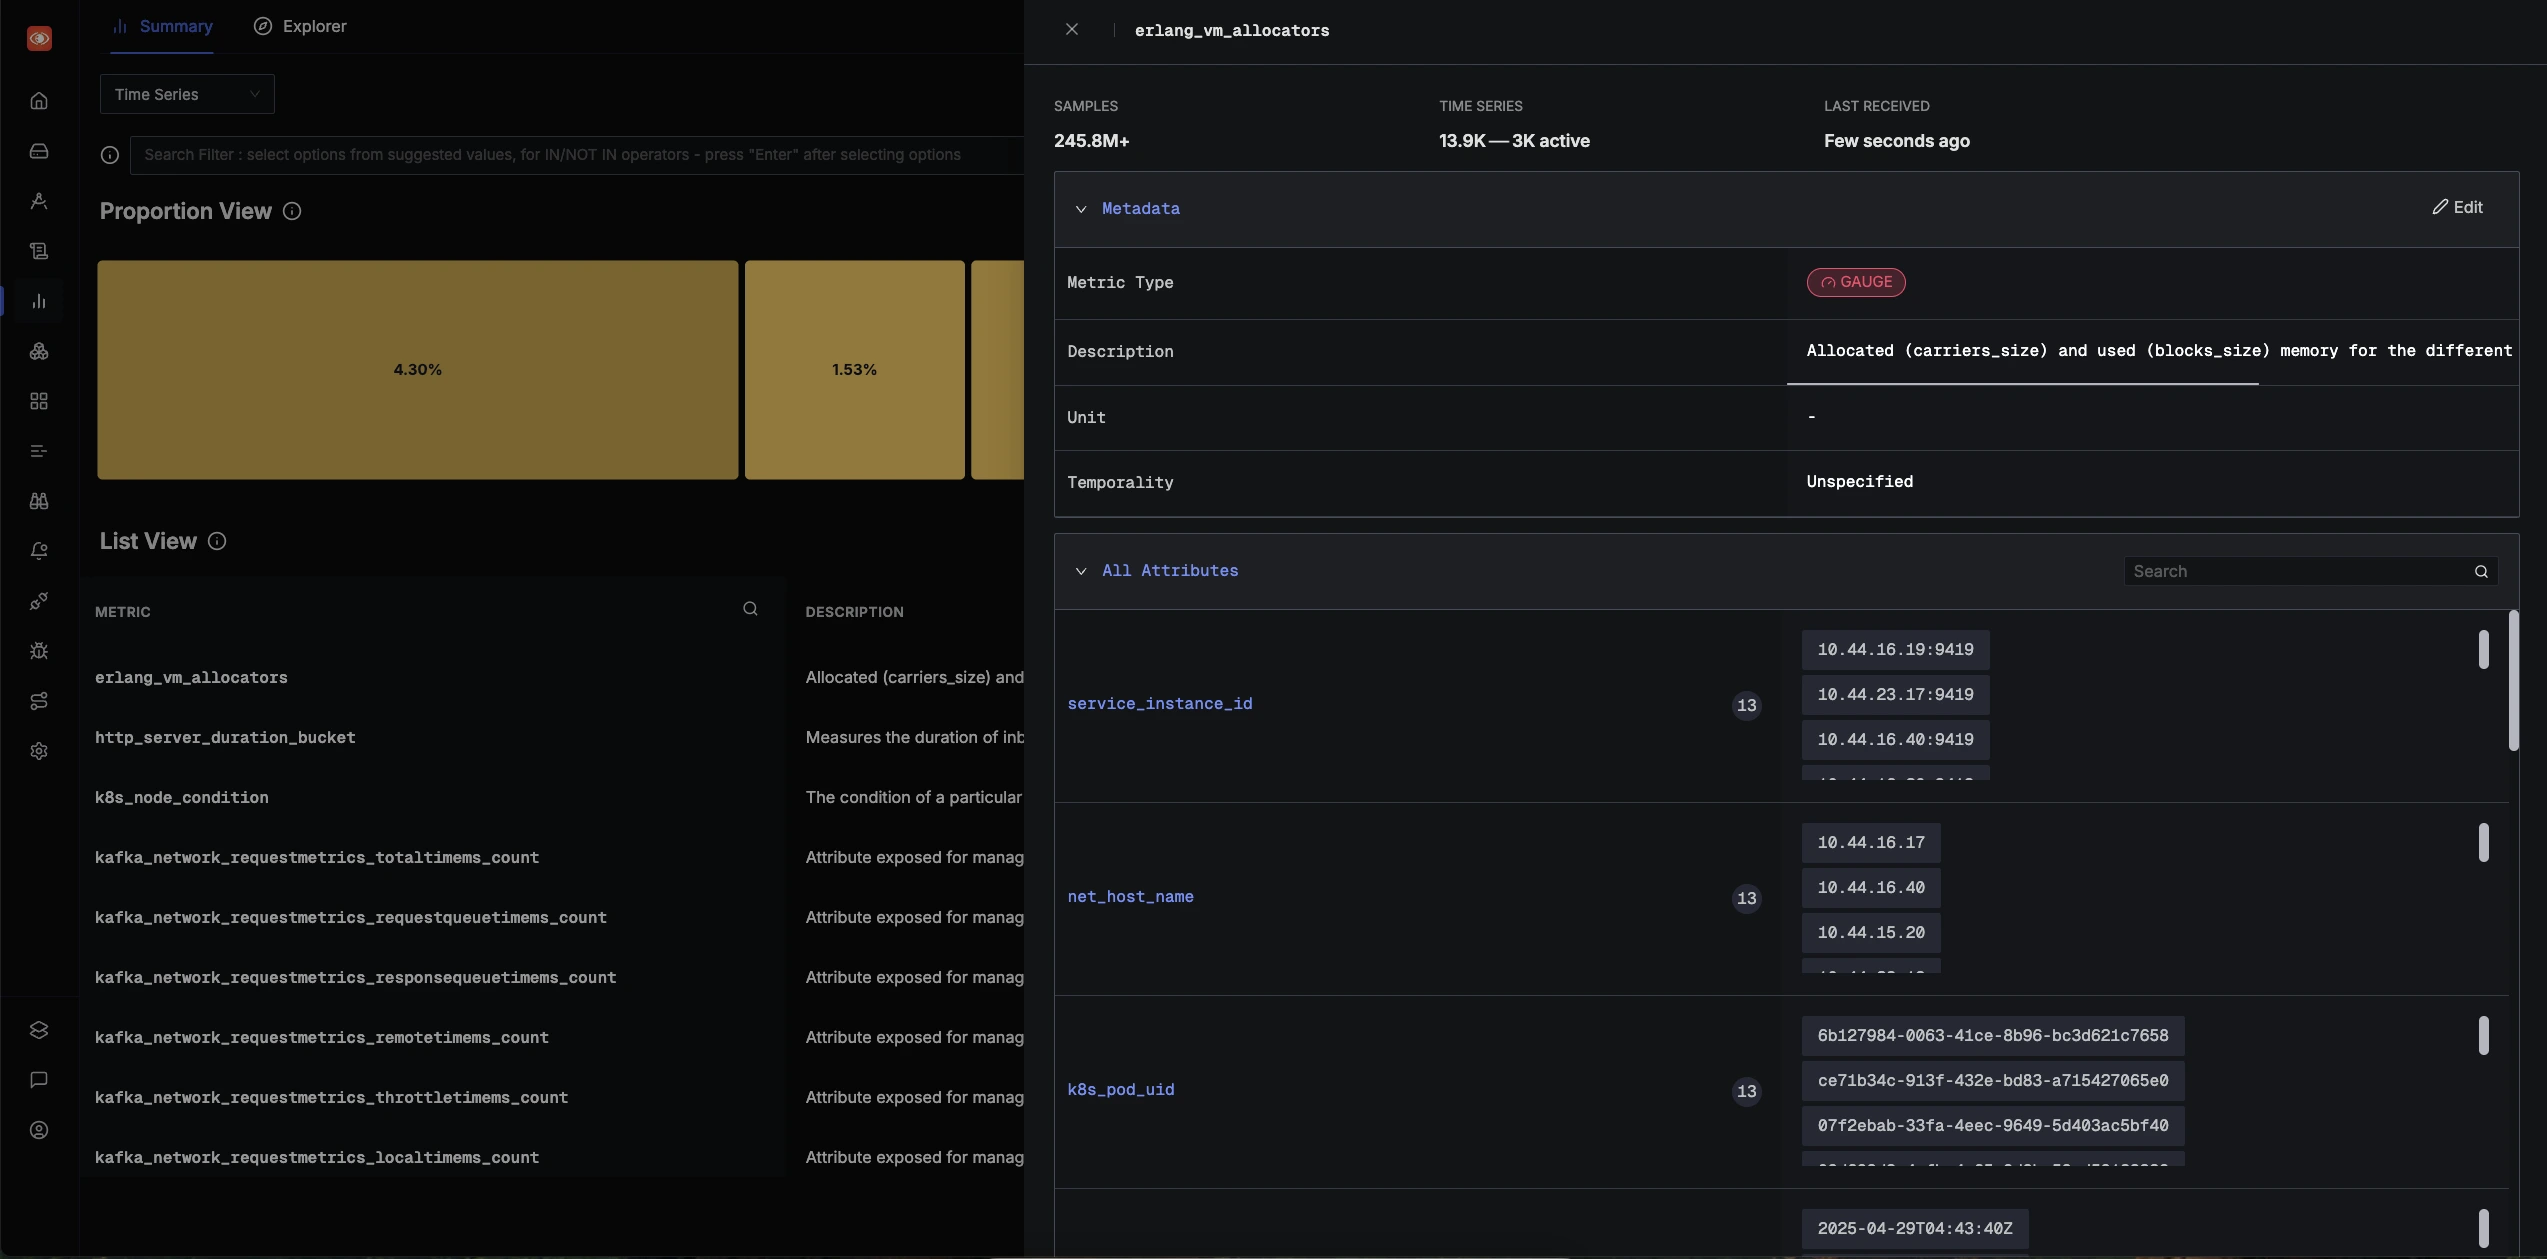
- See its recent activity, last received timestamp, and whether it’s still active
- Inspect metadata, labels, and even edit descriptions or units to match your team’s conventions
3. Playground for Queries

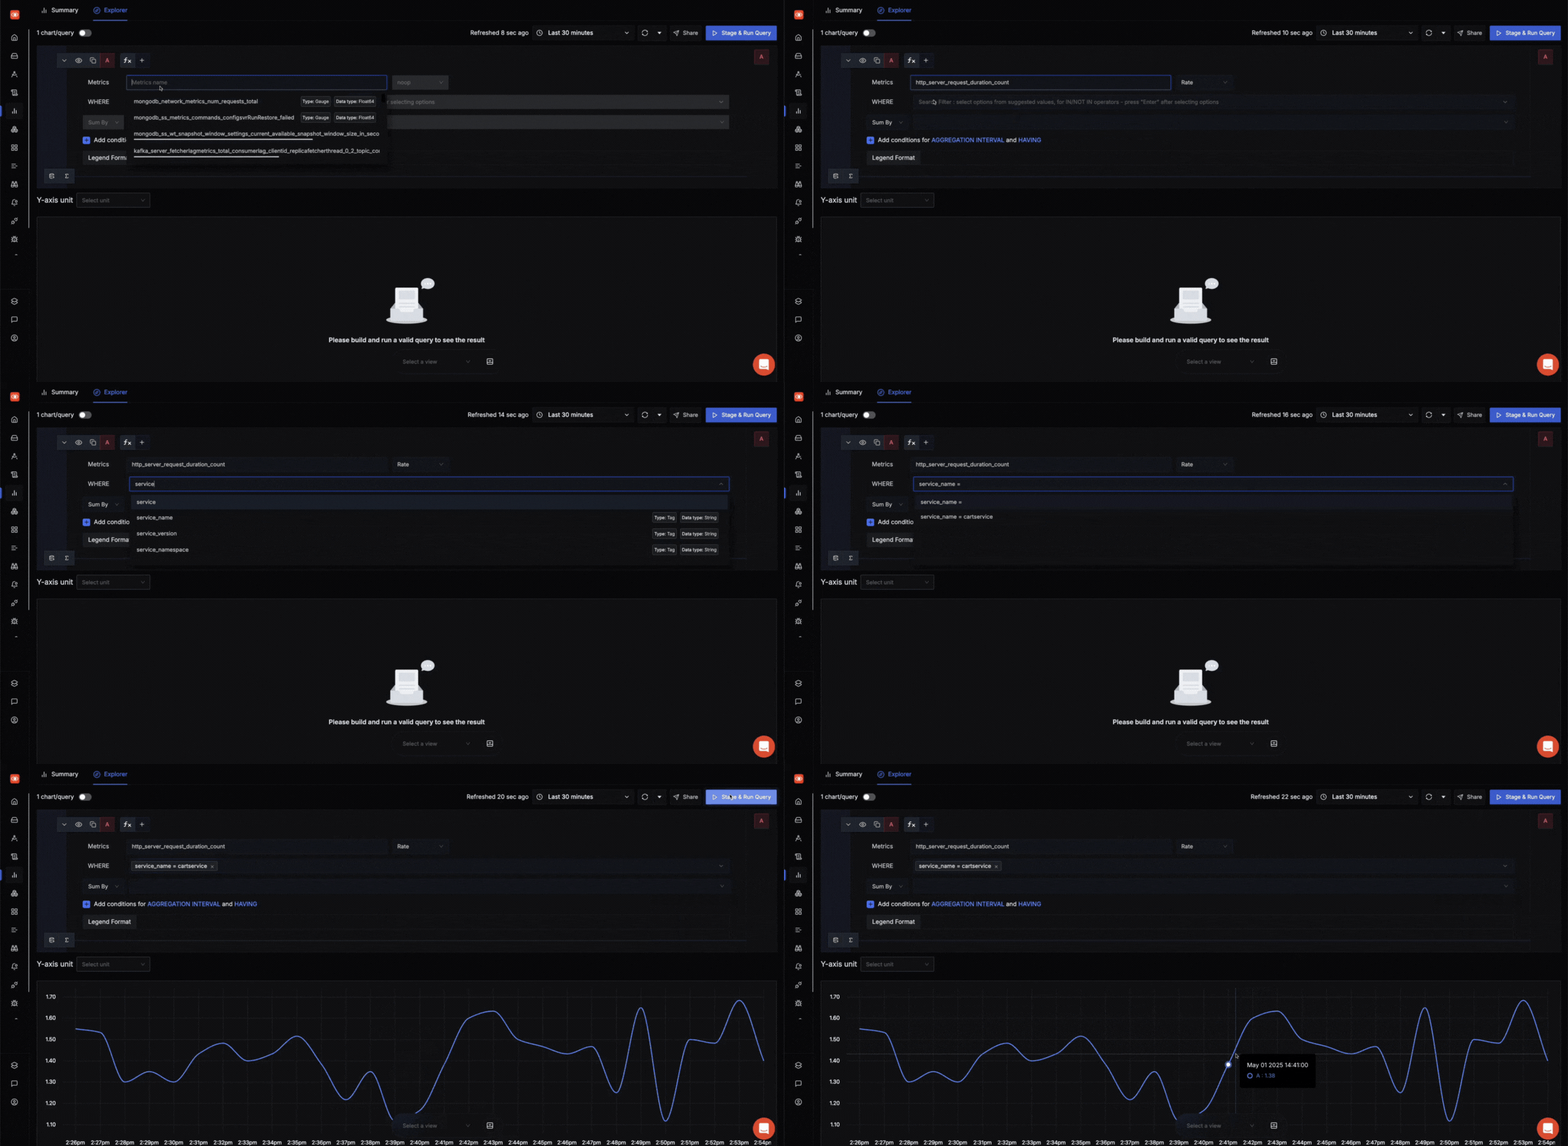
Before, your only option for exploring metrics was to build a dashboard. Now, Metrics Explorer acts as your rough notebook:
- Run ad hoc queries, compare multiple metrics side by side, and visualize them in real time
- Group, filter, and slice by any label or attribute-without writing a single dashboard panel
- When you find something useful, add it to a dashboard or create an alert in one click
4. Debugging and Optimization
Trying to reduce ingestion costs or optimize instrumentation? Metrics Explorer shows you which metrics are generating the most data, which are dead or misconfigured, and where you might be duplicating effort.
Real-World Use Cases
Onboarding a New Integration:
Just added AWS, Kubernetes, or a custom exporter? Instantly see which metrics are coming in, how often, and from which sources. No more guessing if your setup worked.
Alert Triage:
Got paged for a memory spike? Jump to Metrics Explorer, filter by the affected host or service, and correlate memory usage with other metrics like CPU or request latency-all in one view.
Instrumenting New Code:
Added new business metrics to your app? Search for them in Metrics Explorer to confirm they’re being ingested and look at their structure before you start building dashboards or alerts.
Engineering Decisions: Why This UX?
Building Metrics Explorer wasn’t just about surfacing data, it was about doing it at scale. Some of our customers push billions of samples and millions of time series per day. We had to design queries and interfaces that would be lightning-fast, even when users are in “incident mode” and need answers now.
We also added features like:
- Editable metric metadata (for when integrations send confusing names or types)
- Related metrics suggestions (coming soon), so you can debug in context, not isolation
- “Inspect Metric” mode, which guides new users through concepts like spatial and temporal aggregation
What’s Next for Metrics Explorer?
We’re just getting started. Two major upgrades are already in the works:
1. Related Metrics Recommendations
Soon, Metrics Explorer will automatically suggest related metrics based on what you’re investigating. For example, if you’re looking at a spike in system memory usage, the tool will surface metrics like HTTP server load or database call rates that often correlate with memory issues. This means you’ll spend less time guessing which charts to check, and more time actually solving the problem. The goal: help you debug faster by showing you the broader context around any metric you’re exploring.
2. Inspect Metric Mode
We know not everyone is a metrics expert. That’s why we’re building an “Inspect Metric” mode, which acts as a guided playground for understanding complex concepts like spatial and temporal aggregation, time series breakdowns, and metric metadata. New users will be able to see exactly how different aggregation functions work, experiment with their own data, and get step-by-step guidance for building dashboards that actually answer their questions
Try It Out
Metrics Explorer is now live in SigNoz. If you’re onboarding, debugging, or just curious what’s actually flowing into your observability stack, this is the tool we wish we’d had years ago. 
If you have ideas or run into issues, drop us a note on Slack, GitHub, or email. Bring your questions, your weirdest metrics, and let’s explore together.
Launch Week 4.0
Check out all updates of Launch Week 4.0.
