How to achieve Observability for Microservices-based apps using Distributed Tracing?
Modern digital organizations have rapidly adopted microservices-based architecture for their applications. Microservices-based apps have components designed around business capabilities serving a specific purpose. It enables smaller engineering teams to own specific services that lead to increased productivity.
But componentization also leads to complexity. Today’s modern internet-scale businesses have hundreds or thousands of microservices. It’s impossible for a single team or a person to have an idea about how user requests get processed in their entirety.
Operating and troubleshooting an enterprise-scale microservices-based application is challenging, and that’s where the need for observability comes in.
Let’s have a brief overview of observability.
What is Observability in Microservices?
Two major forces behind the rise of distributed systems like microservices are:
- Cloud computing
Cloud providers now provide everything on-demand. Serverless and Lambda functions have become very popular among organizations to scale fast. - Containerization
Containerization technologies like Docker and Kubernetes make it very easy to spin up new services and scale them on-demand.
Observability is a term from control theory, which states that a system is observable if the internal states of the system can be determined by examining its output.
But what does observability mean for distributed systems based on microservices-based applications? There is a lot of debate over the definition of observability when applied to distributed IT systems.
Microservices-based apps are challenging when it comes to troubleshooting performance issues. You can’t predict all the states of the system, and it’s difficult to identify the root cause of performance issues. Making your microservices observable means, you have the visibility to solve these performance issues.
The inputs and outputs of the microservices application should give us enough data to identify bottlenecks quickly.
In the long term, the goal is to predict the behavior of microservices using data captured by observability tools. Currently, the three major data points that are said to form the pillars of observability are
- Logs
- Metrics
- Traces
For microservices-based apps, traces or distributed tracing is a critical tool that creates a central overview of the distributed system. Let’s first see what the challenges are in implementing observability for microservices.
Challenges in Implementing Observability for Microservices
Compared to monoliths, microservices-based applications are riskier. If a user request is touching 20 components to complete a request, and if each component of the microservice succeeds in 99.9% of the cases, then the application as a whole can succeed in only 98% of the cases.
Hence, we need to know what happens to the user request as it goes through each microservice of the application. We also need to know how the different microservices interacted with each other to process a user request.
Traditional monitoring tools struggle with monitoring microservices, as they were meant to monitor single application instances. While the metrics collected by them are important, it does not give the context required to debug issues in a microservices-based application.
But what are the common questions that need to be answered for microservices-based applications? Let’s go through a few of them.
-
How much time did the request take to traverse each microservice?
-
What is the sequence of calls that were made during a user request?
-
What did each microservice do for completing a request?
-
Which component was the performance bottleneck?
-
What was the deviation from the normal behavior of the system?
All of these questions require contextual data that distributed tracing provides. Microservices observability with distributed tracing enables application owners to reconstruct how their systems interact to process user requests.
Distributed Tracing for Microservices Observability
Distributed tracing reconstructs the whole path of a user request as it goes through different components in a microservices-based application. It does so by passing a context object along the execution path of a user request.
The propagation of context correlates events in a sequential flow that depicts the causal relationship between the events in a single user request. The two important data points that distributed tracing captures for user requests are:
- Time taken by a user request to traverse each component of a microservices-based application
- The sequential flow of the request from its start to the end
Read our guide on Distributed Tracing
This creates a request-centric view of how the different components of a distributed system interact together to process a request. It enables us to answer questions about how our microservices are performing and helps us to identify the bottlenecks.
Each logical part of the user request journey is broken down into its components and is represented by spans. A trace is made up of a single or multiple spans. The first span is known as the parent or root span which represents the end-to-end user request. The subsequent calls are known as child spans. The picture below represents a distributed trace with parent and child spans.
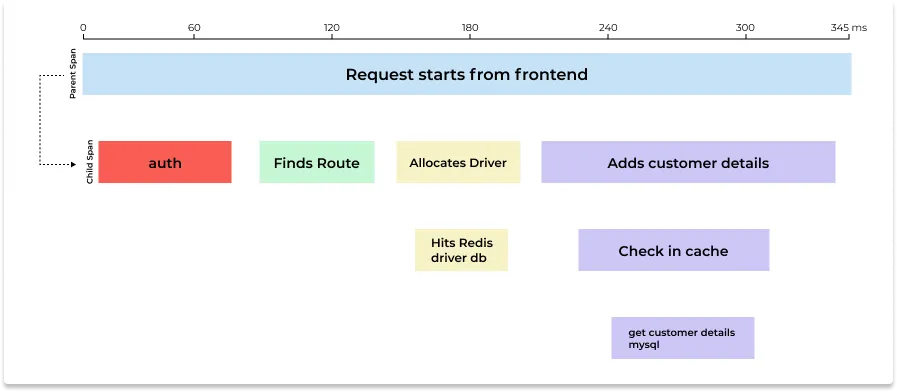
The questions that we discussed in the previous section can be easily answered with the above representation of traces.
-
How much time did the request take to traverse each microservice?
The start and end time is recorded for each span, which can then be used to find out the time taken by the request to traverse each microservice. -
What is the sequence of calls that were made during a user request?
The parent-child relationship shows a clear causal relationship between the calls that happened during a user request. -
What did each microservice do for completing a request?
The tracing infrastructure also records a lot of event attributes at various trace points in the code. The contextual data include things like the URL of the HTTP request, host name, method name, etc. This data can be used to identify exactly what’s going on in each microservice. -
Which component was the performance bottleneck?
You can identify easily where the request took maximum time and optimize it if there is a scope. -
What was the deviation from the normal behavior of the system?
Trace data can also be aggregated to see the average behavior of your microservices. You can use this data to identify the outliers for debugging.
Getting started with Distributed Tracing for Microservices
In order to get started with distributed tracing, you need to enable your application to generate tracing data. Thankfully, there are solutions available in the market for it. SaaS vendors provide agents that can be integrated with your application code to generate tracing data.
But organizations are now moving towards an open-source standard called OpenTelemetry for generating tracing data. It is a set of APIs, SDKs, tooling, and integrations designed to create and manage telemetry data such as traces, metrics, and logs. OpenTelemetry client libraries can be used to generate tracing data.
You can then select a backend of your choice to store and visualize the tracing data for analysis. SigNoz is an open-source APM that is built natively on OpenTelemetry.
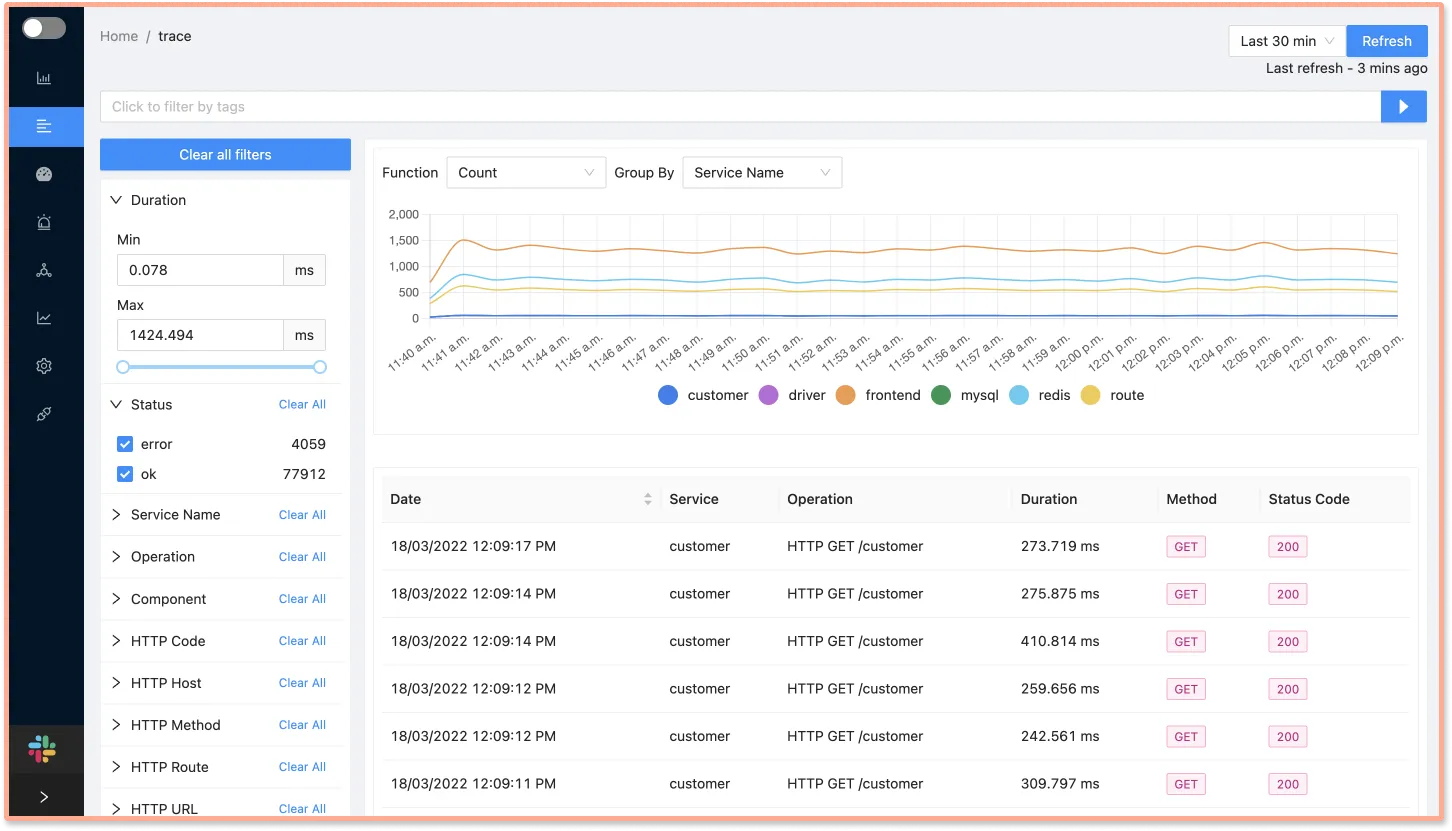
SigNoz comes with out of box visualizations for your tracing data. The Traces dashboard of SigNoz provides you with powerful filters that can be used to analyze your tracing data.
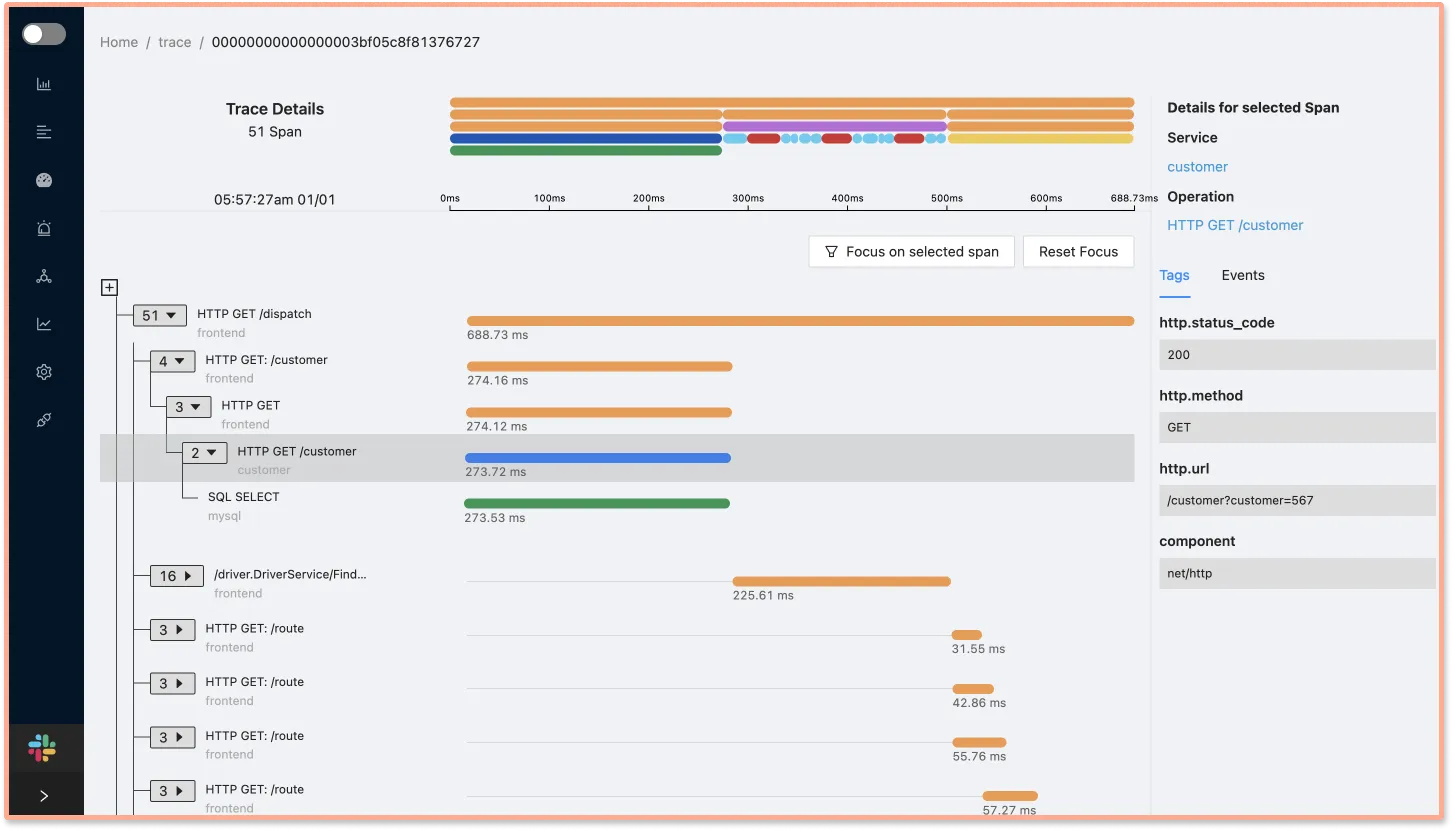
You can also view a selected span(a single logical unit of work that is a part of trace) as part of the entire request with the help of Flamegraphs and Gantt charts.
SigNoz can be installed on macOS or Linux computers in just three steps by using a simple install script.
The install script automatically installs Docker Engine on Linux. However, on macOS, you must manually install Docker Engine before running the install script.
git clone -b main https://github.com/SigNoz/signoz.git
cd signoz/deploy/
./install.sh
You can visit our documentation for instructions on how to install SigNoz using Docker Swarm and Helm Charts.

Further Reading
Examples of Distributed Tracing
More articles on Distributed Tracing
