MongoDB Monitoring | Beginner’s Guide to MongoDB performance monitoring
In this guide, we will discuss the different aspects of MongoDB performance monitoring. MongoDB provides a set of tools and command-line utilities to monitor MongoDB instances. But first, you need to know what metrics should be monitored. Once you understand the performance metrics, you can create workflows and processes to keep a check on your MongoDB cluster’s health and performance.
What is MongoDB?
MongoDB is a popular document-oriented NoSQL database suitable for both structured and unstructured data. NoSQL databases provide more flexibility than RDBMS for storing unstructured and semi-structured data. MongoDB is one of the most popular NoSQL databases, with good reason.
It supports rich query language, data aggregation, and filtering capabilities. Embedded data models in MongoDB reduce disk I/O usage leading to high performance. It also supports clusters with a minimum of three nodes for high availability, and the database can be scaled horizontally across hundreds of nodes.
Based on your use case, you can select any one of the three offerings of MongoDB:
-
Community Edition
Free community edition licensed under SSPL (Server Side Public License). It’s a self-hosted version where the user takes care of deployments and handling scale. -
Enterprise Advanced
Self-hosted paid version with advanced features and support. -
Atlas
Cloud-based offering of database as a service. It is one of the most popular ways of getting started with MongoDB.
MongoDB can run on most platforms, including Windows, macOS, and different flavors of Linux. You can deploy MongoDB as:
-
Standalone
The standalone installation is done for a single machine. Though not preferred for production environments, it is good for development and learning purposes. -
Replica Set
A replica set provides data redundancy and high availability. Replica set deployments provide safeguards from connectivity issues and disk failures, which improves reliability. -
Sharded Deployment
Sharded deployment is preferred in organizations where the scale of data is huge. The data gets distributed across shards which improve throughput.
Why monitor MongoDB?
Database errors and latency can impact user experience adversely. Database administrators need to ensure that databases are running in fine health with adequate infrastructure resources. MongoDB provides multiple in-built tools and utilities to access information about instance health. You need to monitor MongoDB instances because of the following reasons:
- Understand query performance bottlenecks
- Understand database capacity to meet the demand
- Observe the overutilization of infrastructure resources
- Understand cluster health and performance
Important MongoDB performance metrics to monitor
Database Operations
The rate of operations indicates the speed and activity levels of the database. Monitoring your read and write operations can help you to do capacity planning, avoid resource saturation, and spot performance bottlenecks. You can use MongoDB utility mongostat to access operational metrics. The following types of MongoDB database operations are usually monitored:
-
command
Keeps a track of database commands processed per second. Commands are different from CRUD operations and data queries. They are used for database management, security, and replication. -
query
The number of query operations per second -
update
The number of update operations per second -
delete
The number of delete operations per second -
getMore
The number of get more operations per second.getMoreis used in conjunction with commands that return a cursor. -
insert
The number of insert operations per second
You can aggregate query and getMore metrics to get the total number of read operations on the database. Write operations include insert, update, and delete.
All these metrics are monitored at an instance level. For a MongoDB cluster, you need to monitor the rate of database operation for your primary as well as secondary nodes.
Operation Execution Time
Query performance can be monitored by tracking the latency in operation execution. Read and write operation times can indicate whether the queries need to be optimized further. Usually, read operation time above 100 ms is considered slow, and there is a scope for query optimization. You can also work on optimizing expensive operation queries.
Clients or Connections
The number of active clients performing read and write operations is another important metric to monitor. You can get the number of active clients using the serverStatus command from the MongoDB shell. The serverStatus command provides a globalLock.activeClients document that reports about client connections.
Number of active clients is reported at the global lock level. MongoDB allows operations to lock at the global, database, or collection levels to ensure consistency. The following fields in the output provide information on the number of connections:
-
globalLock.activeClients.readers
The number of active client connections performing read operations. -
globalLock.activeClients.writersThe number of active client connections performing write operations.
Resource Utilization
Database operations consume memory, and data storage needs space. Even if you’re running your database on the cloud, you need to optimize your database for resource utilization as resources cost money. Following are some key metrics that you should monitor about MongoDB resource utilization.
Disk Utilization
Disk utilization is a good indicator of overall disk health. MongoDB gives maximum and average utilization percentage of all drives.
Memory Utilization
Memory metrics include metrics for resident and virtual memory (for WiredTiger storage engine). Resident memory denotes the number of megabytes of physical memory used by the mongod process, while virtual memory denotes the number of megabytes of virtual memory used by the mongod process.
System CPU Usage
System CPU usage of all processes in a MongoDB node needs to be monitored. High CPU usage can lead to slow database queries.
Queues
MongoDB maintains a queue for read and write operations waiting for a lock. High queue length in MongoDB might indicate unoptimized query operation and can make the database slow. The mongostat command provides a rolling one-second update on read and write operations waiting for a lock.
Replication and Oplog Metrics
A MongoDB replica set cluster generally consists of three nodes with one primary and two secondary nodes. In MongoDB clusters, the flow of data is unidirectional. There is only one primary node per cluster which sends data to secondary nodes. A cluster can either be a replica set or a sharded cluster.
Replica set
A replica set is used for data redundancy and high availability. It’s a group of MongoDB servers that hold the same copy of data.
Sharded Cluster
A sharded cluster is mainly used for horizontal scaling, where data is distributed across many servers.
By default, MongoDB Atlas provides a cluster with a replica set. Following are the main performance metrics for replication:
Replication lag
Replication lag is defined as the number of seconds the secondary node is behind the primary node in making a copy of the data. High replication lag indicates that the secondary node is not able to replicate data fast enough. There can be multiple reasons behind high replication lag - network latency, disk throughput, concurrency or just large write operations on your MongoDB database.
Oplog Window
Oplog (Operation Log) is the main component of MongoDB database that facilitates replication. All data changes in the primary node are saved in the Oplog for cluster replication. Oplog window refers to the approximate amount of time data changes are available in primary’s Oplog. You can also refer to it as the time difference between the oldest and newest entries in your Oplog.
If a secondary node lags more than the Oplog window, it won’t be able to copy data as the data gets overwritten, and will require a full resync. The Oplog window is not a constant value, and keeps on fluctuating based on database operations. And that’s why you need to monitor it, and preferably set alerts too.
Opcounters for replication
Just like Opcounters for primary node, you also need to monitor database operations for your secondary nodes.
Replication Headroom
You can also monitor the replication headroom to ensure secondary nodes can always copy data from the primary. It is the difference between primary’s replication oplog window, and secondary’s replication lag. If the replication headroom is continuously decreasing, then that means data changes in the Oplog has high probability of getting overwritten.
MongoDB in built tools & utilities for monitoring
MongoDB provides a number of utilities and tools to monitor instance and cluster health. Apart from information about instance health, you can also monitor operational parameters to get a sense of database activity. A robust monitoring framework can help you diagnose failures in advance and take steps to avoid them.
MongoDB comes in different flavors, and sometimes it can get confusing which tool or utility to use for monitoring. Here’s a breakdown of all tools and utilities that MongoDB provides.
Free Cloud Monitoring
MongoDB offers free cloud monitoring for its community edition in version 4.0 and above. Once enabled, you will get a unique URL where you can see your monitored data. The data includes:
- Operation execution times
- Memory usage
- CPU usage
- Operation Counts
You can enable free cloud monitoring for your locally run MongoDB by running the following command from Mongo shell.
db.enableFreeMonitoring()
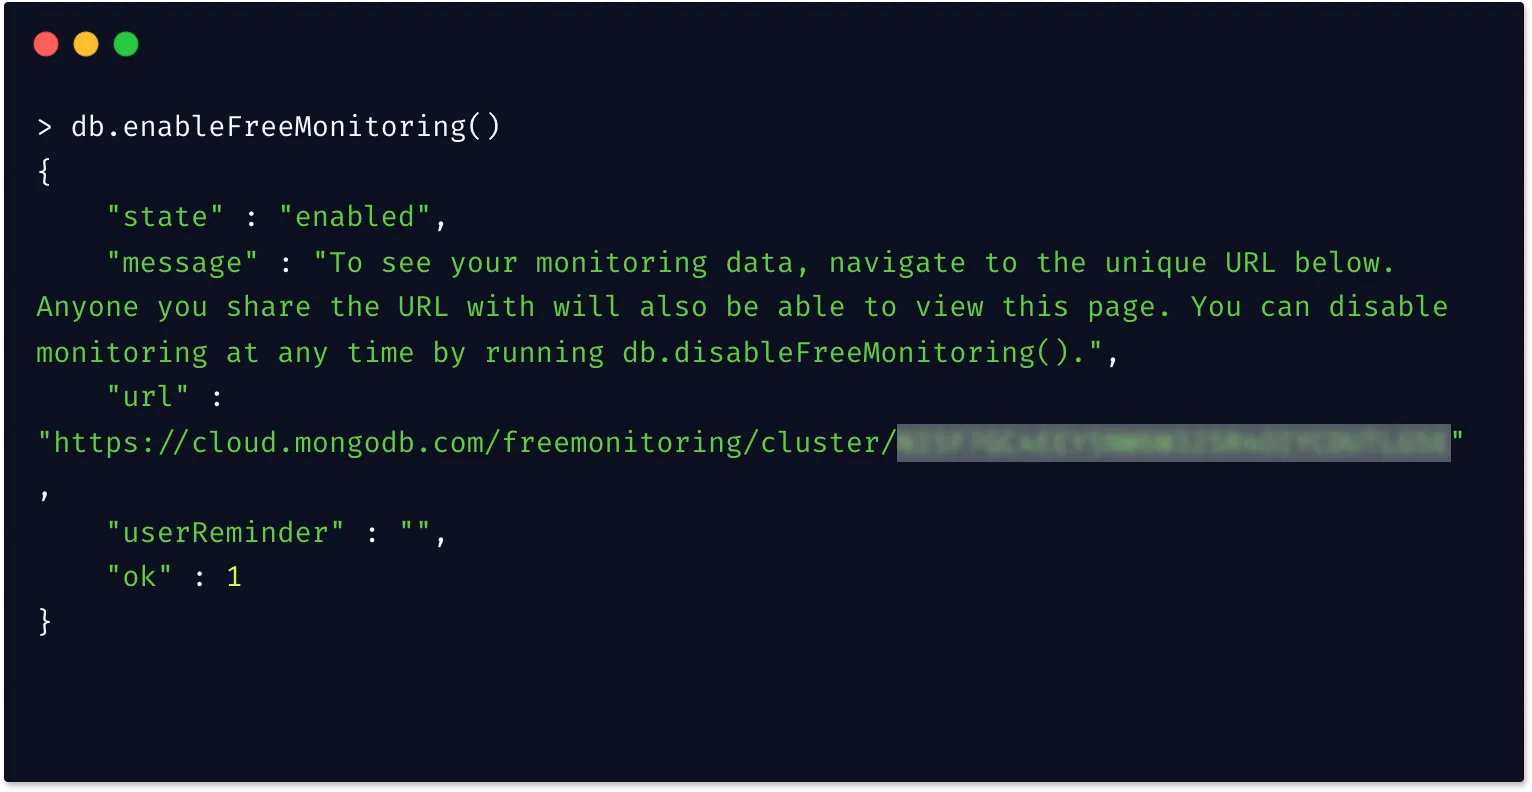
You can disable cloud monitoring using the below command:
ds.disableFreeMonitoring()
Utilities
MongoDB ships with two powerful utilities that give a real-time snapshot of database activity: counter for type of queries being executed and read and write activity per collection. Let’s look at both utilities in brief:
-
mongostat
Themongostatcommand returns the count of database operations likeinsert,query,update, anddeletein one-second intervals. It can be run directly from the command line. Note that you will need advanced privileges to run this command. If you have enabled authentication, you will need to authenticate with your username and password to run the command.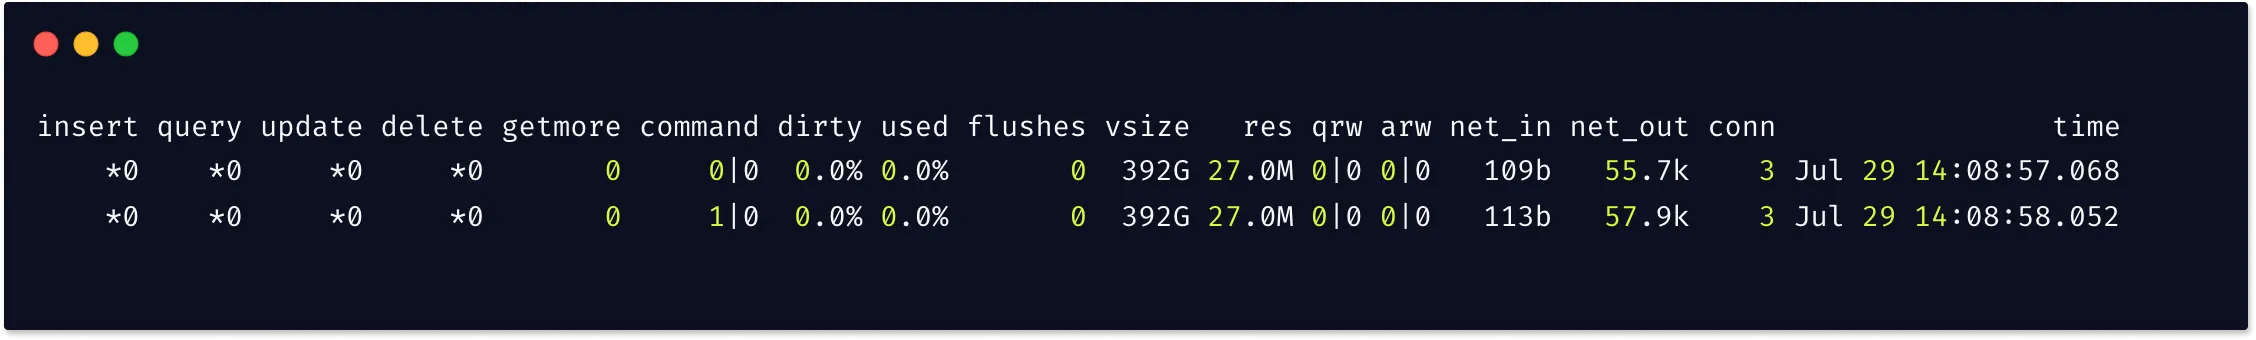
-
mongotop
Themongotopcommand returns information on read and write activity of all collections in the database. During peak load, themongotopcommand can be used to identify which collections have the most database activity.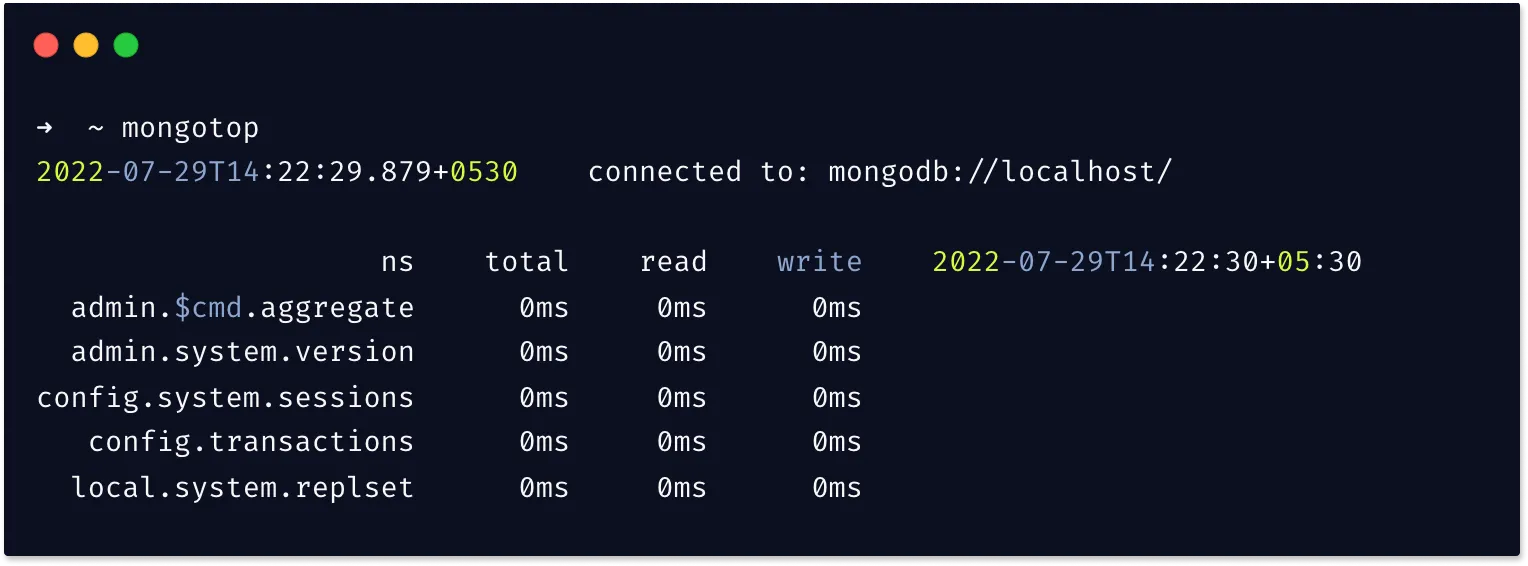
Database Commands
Apart from the above utilities, you can run certain database commands to get statistics about the database. Let’s have a brief overview of these commands:
-
serverStatus
TheserverStatuscommand returns a lengthy output about the status of the database, resource usage, connections, and queries. You can run this command as follows from your MongoDB shell:db.serverStatus()The output has many sections like
connections,globallock,indexstats,network, etc. It’s a useful command when you want detailed information about server usage.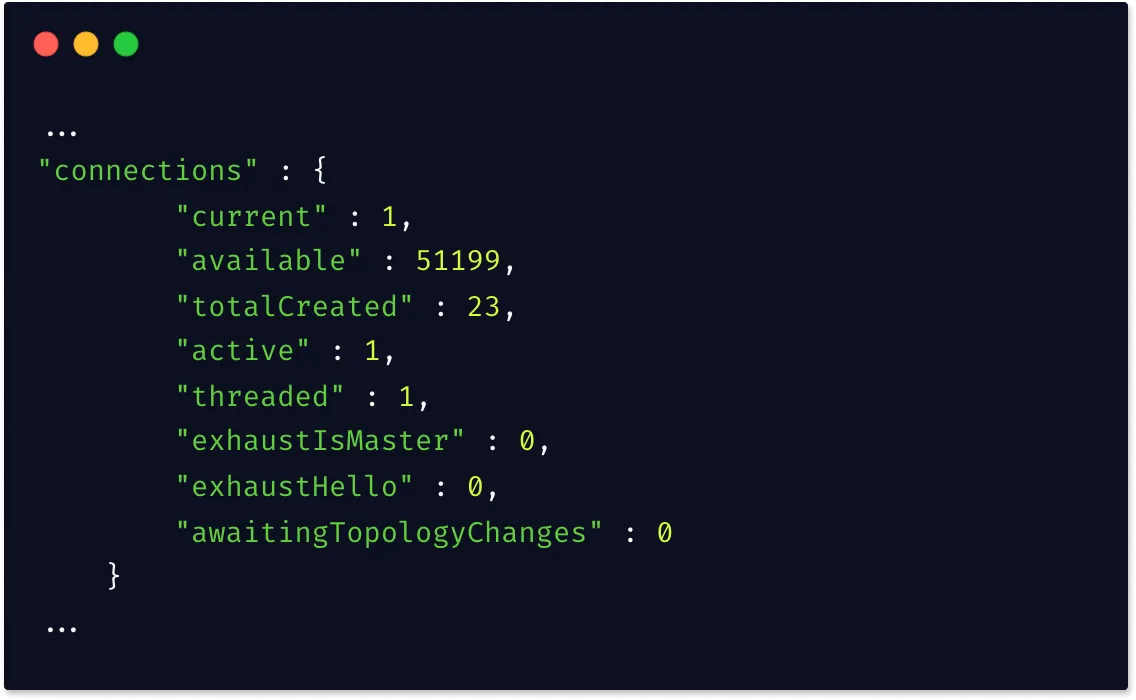
Snapshot of connections section with serverStatus command. -
stats
Thestatscommand outputs concise stats with some important metrics about the current database. You can use thestatscommand as follows from your MongoDB shell:db.stats()Here’s a snapshot of the output of
statscommand.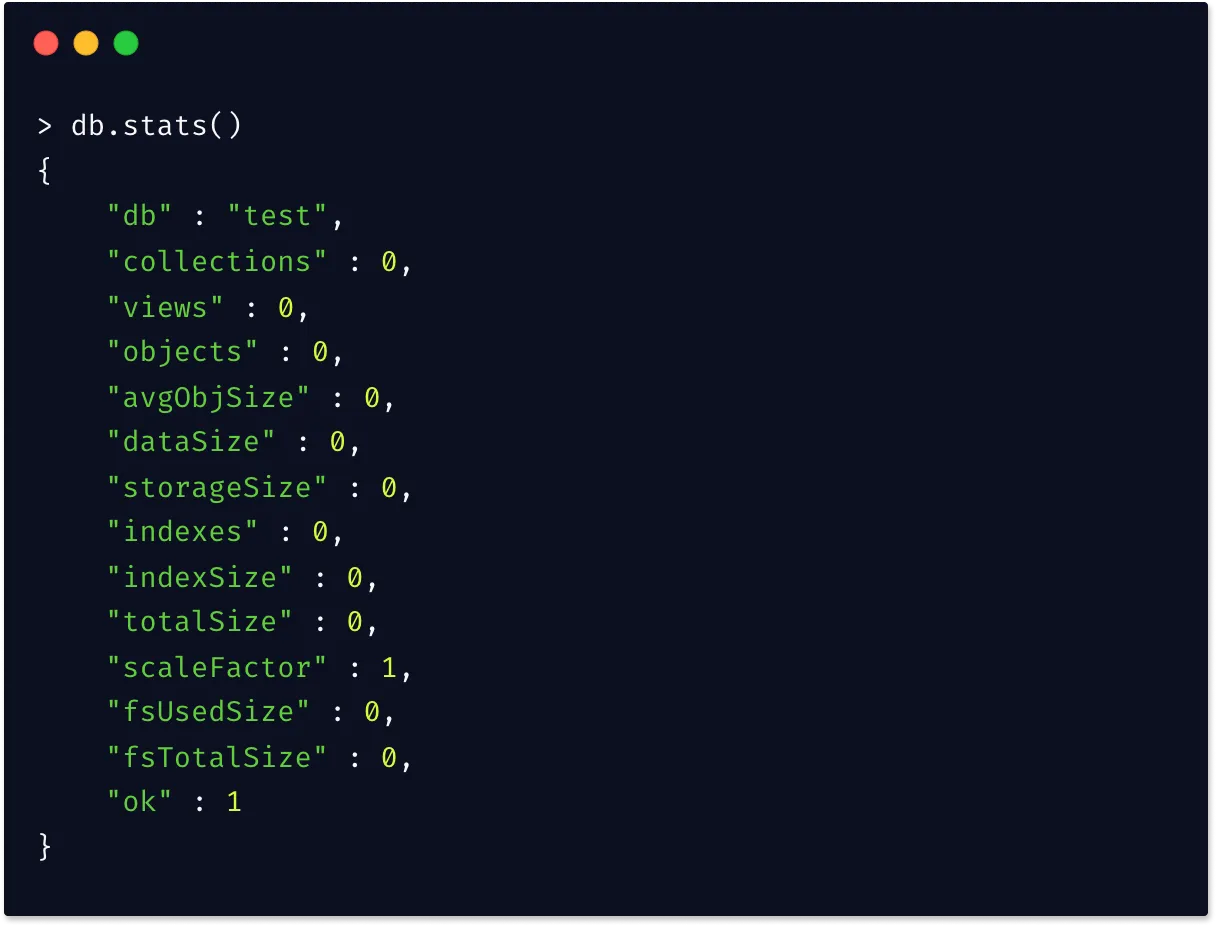
Hosted MongoDB monitoring tools
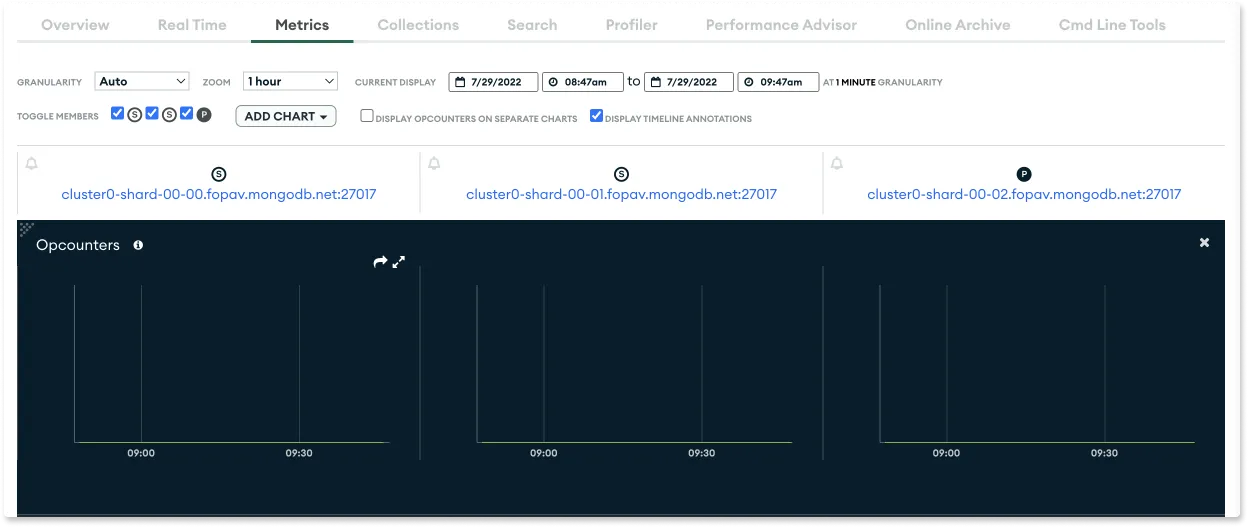
MongoDB Atlas comes with its suite of monitoring tools to make it easier to manage your MongoDB deployments. The tool reports metrics for all the nodes in the cluster with useful charts on the total number of operations, network usage, and connections.
Similarly, the managed hosted version of MongoDB known as Enterprise Advanced comes with Ops Manager that monitors deployments and enables alert setting on collected data.
Final Thoughts
In this post, we went over some key MongoDB monitoring metrics. MongoDB provides a number of in-built tools to access performance snapshots. It is helpful in case of quick check-in or debugging. But you need a dedicated monitoring system to keep track of how your MongoDB instances are performing over time.
A monitoring tool that allows you to store, query, and visualize MongoDB monitoring metrics can help you debug performance issues quickly. For modern applications based on a distributed architecture, it is also important to correlate your MongoDB metrics with the rest of the application infrastructure.
You can set up MongoDB monitoring using open source APM - SigNoz. SigNoz is built to support OpenTelemetry, which is becoming the world standard for instrumenting cloud-native applications.
In the following post, we guide you on how to setup MongoDB monitoring using OpenTelemetry and Signoz:
