Set up application monitoring for your Node JS app in 20 mins with open source - SigNoz
In this article, learn how to setup application monitoring for Node.js apps with our open-source solution, SigNoz.
Node.js tops the list of most widely used frameworks by developers. Powered by Google's V8 javascript engine, its performance is incredible. Ryan Dahl, the creator of Node.js, wanted to create real-time websites with push capability. On Nov 8, 2009, Node.js was first demonstrated by Dahl at the inaugural European JSconf. Node.js has now become a critical component in the technology stack of large-scale enterprises. But like any technology, it has its own set of limitations.
Node.js is a dynamically typed single-threaded programming language. There is a lot of freedom for the interpreter and runtime to make decisions that can easily lead to memory leaks and high CPU loads. This can lead to performance issues, loss of resources, and potential downtime. Hence, it is crucial to monitor your Node.js apps for app performance metrics.
SigNoz is an open-source application monitoring and observability platform which can be installed within your infra. There's no need to go through any sales team or complex onboarding process to start monitoring your application with SigNoz. In this article, let's take a look at how it can be deployed with Docker in a sample Node.js application.
Let's divide this tutorial in 2 parts:
- Installing SigNoz
- Creating & setting up a sample Node.js app for monitoring
Part 1 - Installing SigNoz
You can get started with SigNoz using just three commands at your terminal.
git clone -b main https://github.com/SigNoz/signoz.git
cd signoz/deploy/
./install.sh
For detailed instructions, you can visit our documentation.

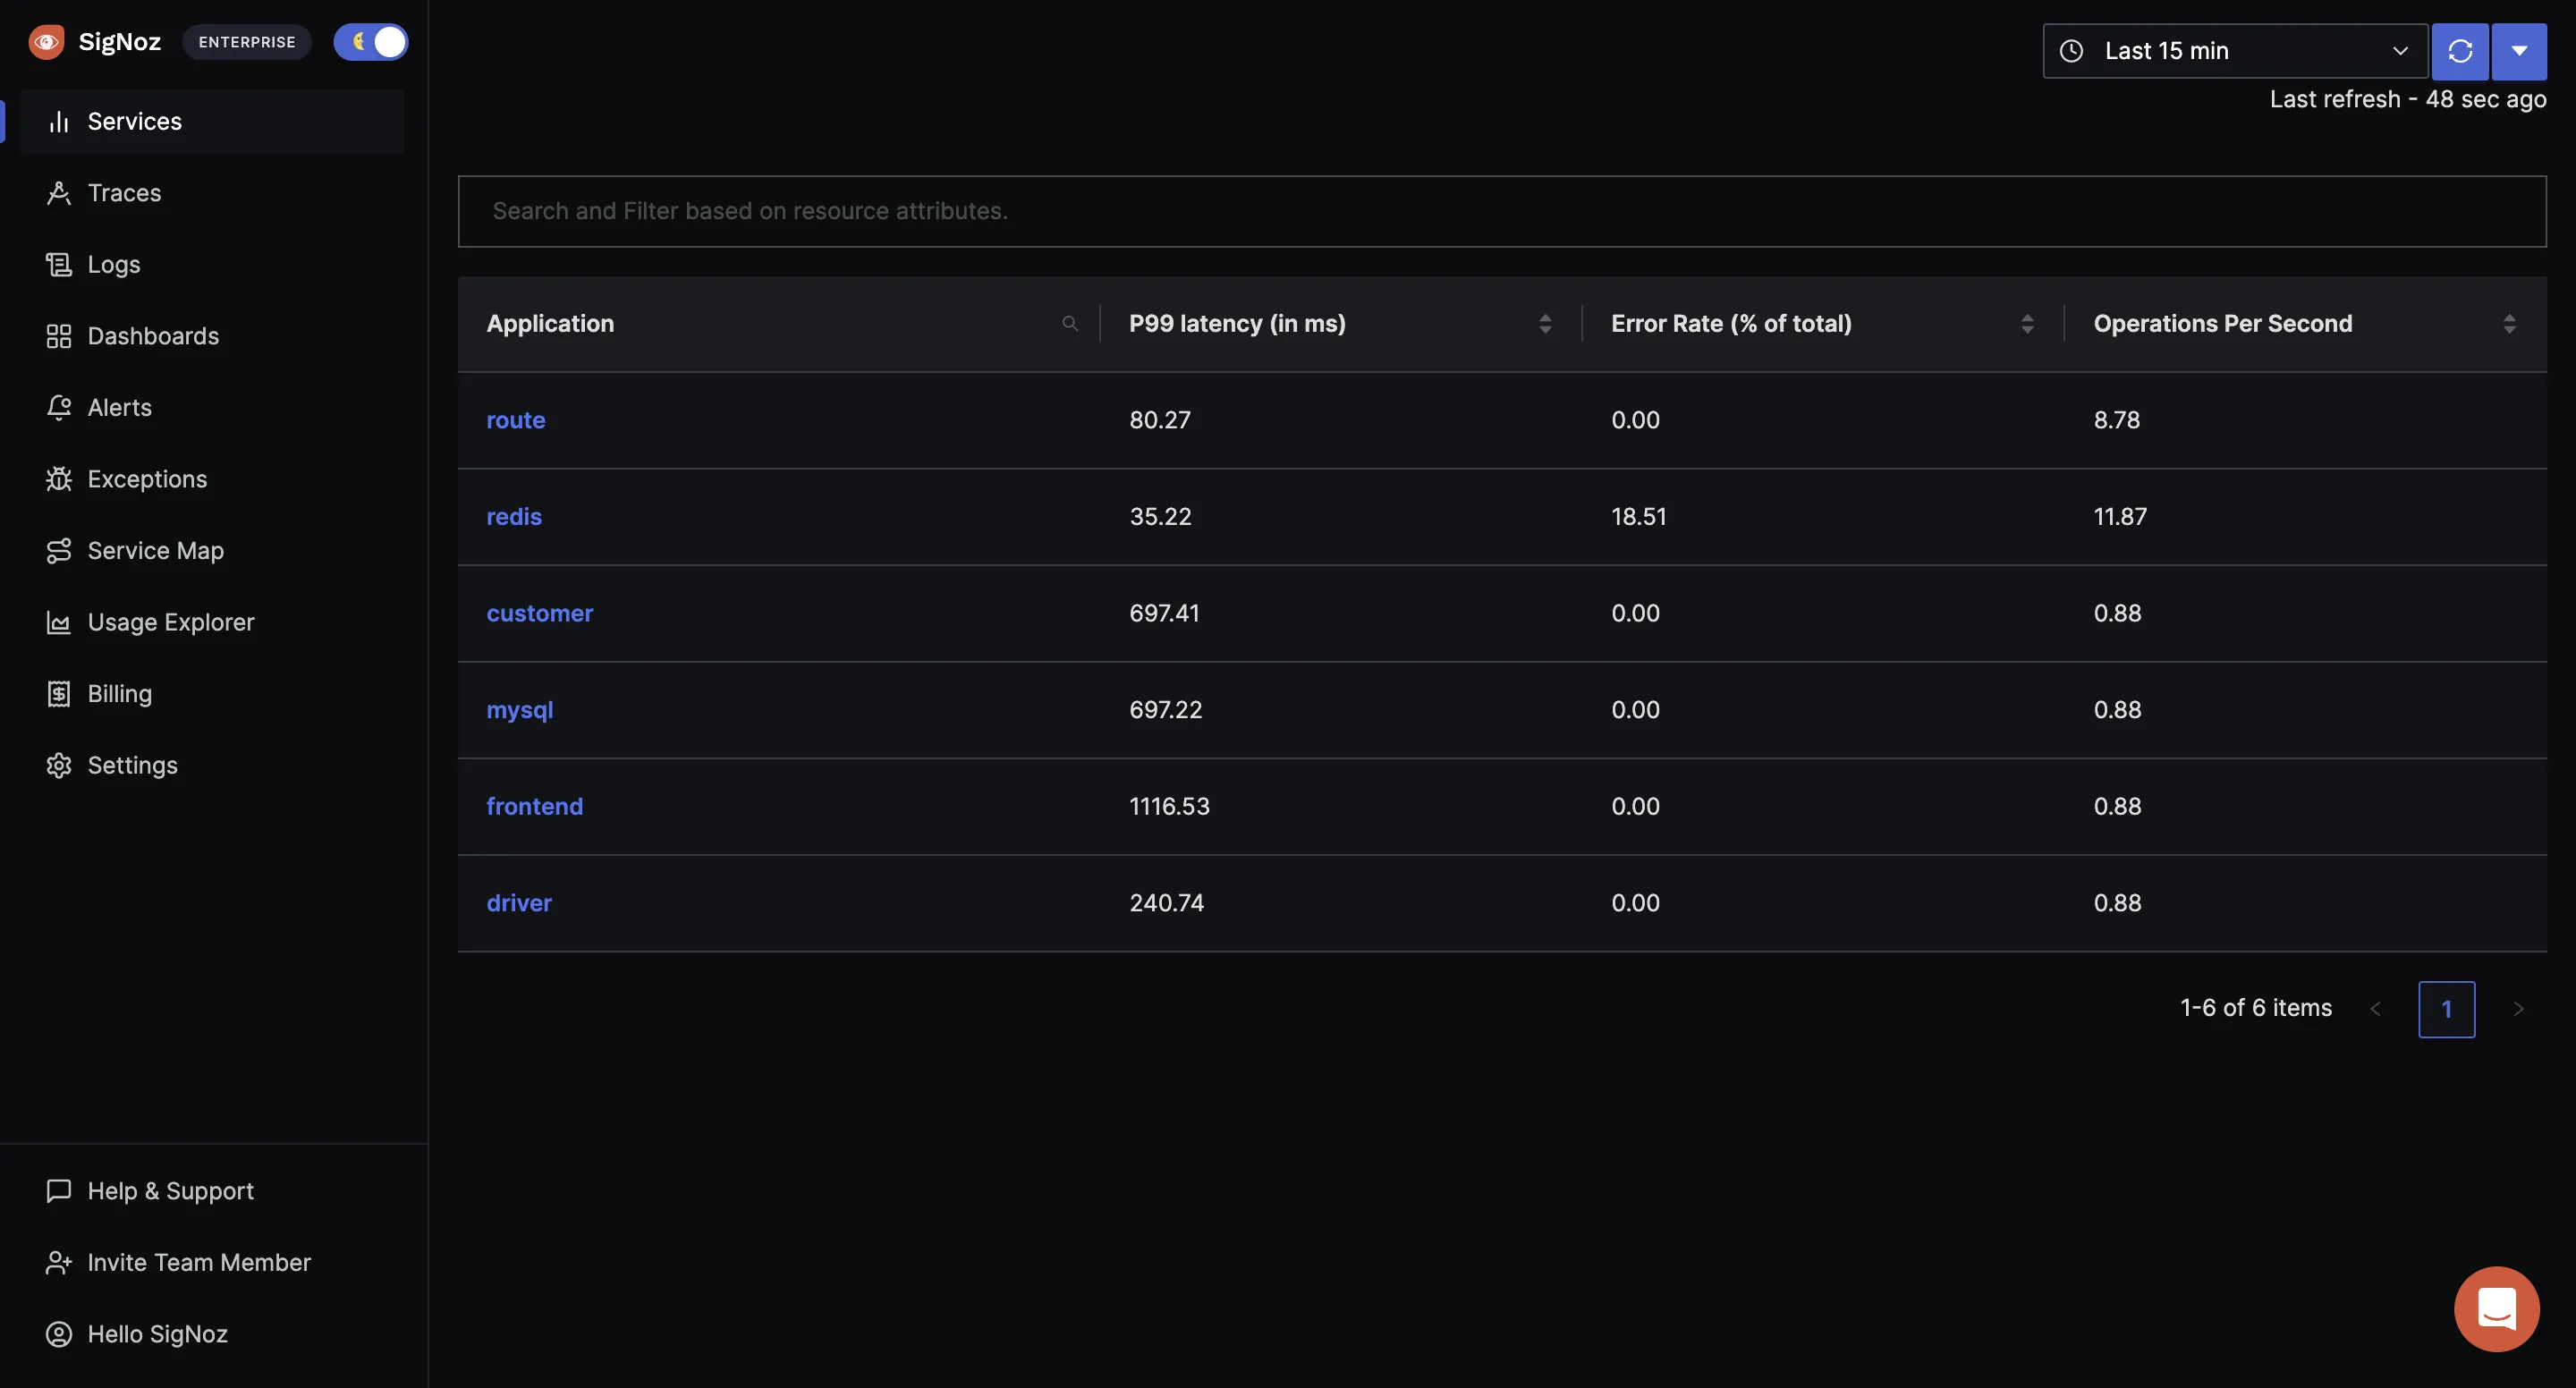
When you are done installing SigNoz, you can access the UI at: http://localhost:3301
The application list shown in the dashboard is from a sample app called HOT R.O.D that comes bundled with the SigNoz installation package.
Now comes the part where you can instrument your own sample app and get the metrics reported through SigNoz.
Part 2 - Creating sample Nodejs application
You need to ensure that you have Node.js version 12 or newer. You can download the latest version of Node.js here. For the sample application, let's create a basic 'hello world' express.js application.
If you do not want to follow these steps manually, you can directly check out the GitHub repo of the sample application. You can run the app directly after cloning it and start sending data to SigNoz. The code is already instrumented with OpenTelemetry libraries.
But, it would be better if you follow these steps to understand what's happening.
Check if node is installed on your machine by using the below command:
node -v
Steps to get the app set up and running:
-
Make a directory and install express
Make a directory for your sample app on your machine. Then open up the terminal, navigate to the directory path and install express with the following command:npm i express -
Create index.js
Create a file calledindex.jsin your directory and with any text editor setup your 'Hello World' file with the code below:const express = require("express"); const cors = require('cors') const PORT = process.env.PORT || "5555"; const app = express(); app.use(cors()); app.use(express.json()) app.all("/", (req, res) => { res.json({ method: req.method, message: "Hello World", ...req.body }); }); app.get('/404', (req, res) => { res.sendStatus(404); }) app.listen(parseInt(PORT, 10), () => { console.log(`Listening for requests on http://localhost:${PORT}`); }) -
Check if your application is working
Run your application by using the below command at your terminal.node index.jsYou can check if your app is working by visiting:
http://localhost:5555/Once you are finished checking, exit the application by using
Ctrl + Con your terminal.
Set up OpenTelemetry and send data to SigNoz
-
Install OpenTelemetry packages
You will need the following OpenTelemetry packages for this sample application.npm install --save @opentelemetry/sdk-node npm install --save @opentelemetry/auto-instrumentations-node npm install --save @opentelemetry/exporter-trace-otlp-httpThe dependencies included are briefly explained below:
@opentelemetry/sdk-node- This package provides the full OpenTelemetry SDK for Node.js including tracing and metrics.@opentelemetry/auto-instrumentations-node- This module provides a simple way to initialize multiple Node instrumentations.@opentelemetry/exporter-trace-otlp-http- This module provides the exporter to be used with OTLP (http/json) compatible receivers.<Admonition"> If you run into any error, you might want to use these pinned versions of OpenTelemetry libraries used in this <a href = "https://github.com/SigNoz/sample-nodejs-app/blob/master/typescript/auto-no-code/package.json" rel="noopener noreferrer nofollow" target="_blank">GitHub repo</a>. </Admonition>
-
Create
tracing.jsfile
Instantiate tracing by creating atracing.jsfile and using the below code.// tracing.js 'use strict' const process = require('process'); const opentelemetry = require('@opentelemetry/sdk-node'); const { getNodeAutoInstrumentations } = require('@opentelemetry/auto-instrumentations-node'); const { OTLPTraceExporter } = require('@opentelemetry/exporter-trace-otlp-http'); const { Resource } = require('@opentelemetry/resources'); const { SemanticResourceAttributes } = require('@opentelemetry/semantic-conventions'); const exporterOptions = { url: 'http://localhost:4318/v1/traces' } const traceExporter = new OTLPTraceExporter(exporterOptions); const sdk = new opentelemetry.NodeSDK({ traceExporter, instrumentations: [getNodeAutoInstrumentations()], resource: new Resource({ [SemanticResourceAttributes.SERVICE_NAME]: 'node_app' }) }); // initialize the SDK and register with the OpenTelemetry API // this enables the API to record telemetry sdk.start() // gracefully shut down the SDK on process exit process.on('SIGTERM', () => { sdk.shutdown() .then(() => console.log('Tracing terminated')) .catch((error) => console.log('Error terminating tracing', error)) .finally(() => process.exit(0)); });OpenTelemetry Node SDK currently does not detect the
OTEL_RESOURCE_ATTRIBUTESfrom.envfiles as of today. That’s why we need to include the variables in thetracing.jsfile itself.About environment variables:
service_name: name of the service you want to monitorenvironment: dev, prod, staging, etc.http://localhost:4318/v1/tracesis the default url for sending your tracing data. We are assuming you have installed SigNoz on yourlocalhost. Based on your environment, you can update it accordingly. It should be in the following format:http://<IP of SigNoz backend>:4318/v1/tracesRemember to allow incoming requests to port 4318 of machine where SigNoz backend is hosted.
-
Run your application
Now when you run your application, OpenTelemetry captures telemetry data from it and send it to SigNoz.node -r ./tracing.js index.jsYou can check your application running at
http://localhost:5555/. You need to generate some load in order to see data reported on SigNoz dashboard. Refresh the endpoint for 10-20 times, and wait for 2-3 mins.
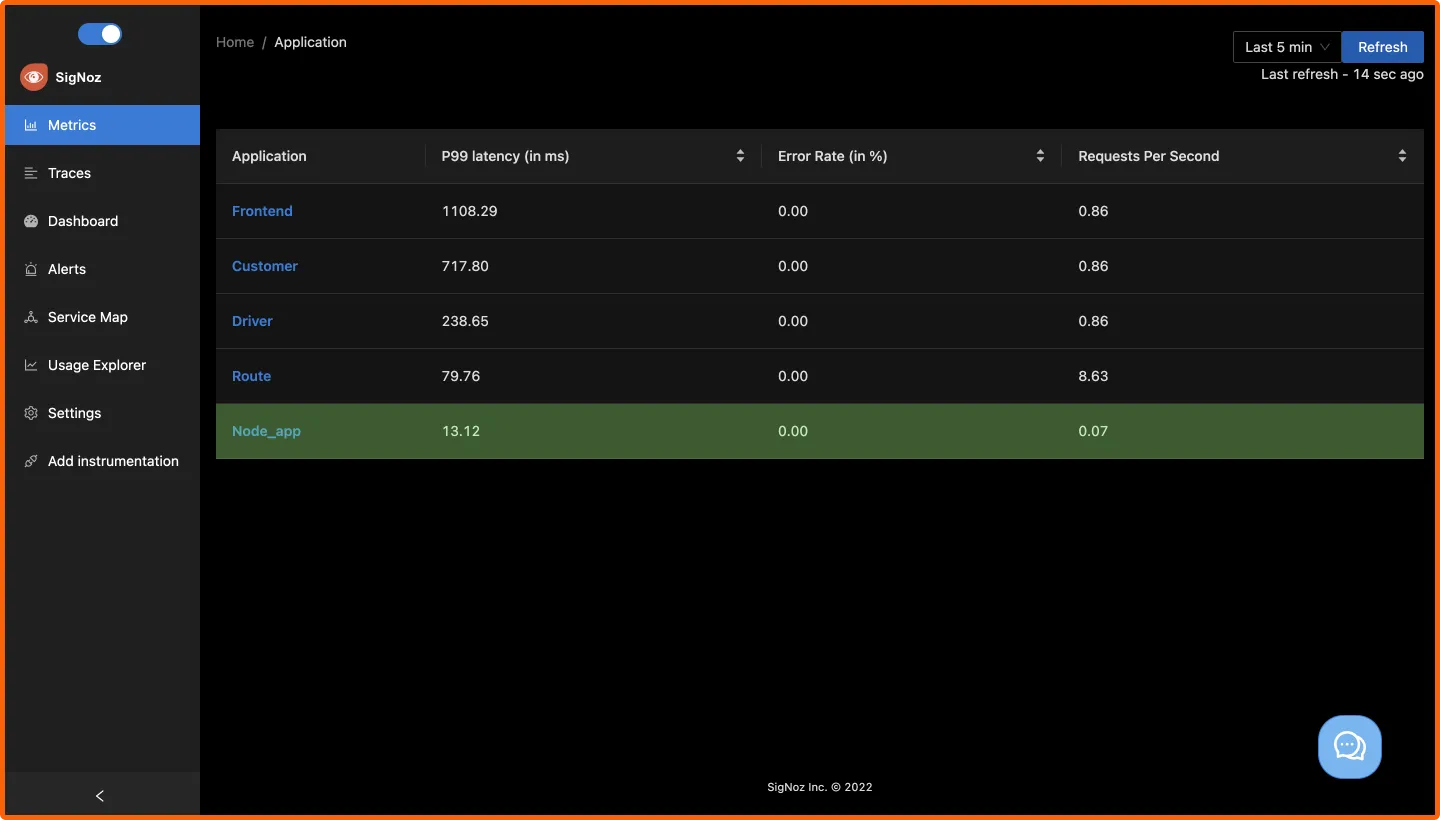
And, congratulations! You have instrumented your sample Node.js app. You can now access the SigNoz dashboard at http://localhost:3301 to monitor your app for performance metrics.
Identifying events causing high latency in your app
Now that you have installed SigNoz, let's see how you can identify specific events causing high latency in your deployed applications.
In just 5 easy steps, our dashboard lets you drill down to events causing a delay in your deployed apps 👇
- Choose your microservice
- Choose the timestamp where latency is high
- Click on view traces
- Choose the trace ID with the highest latency
- Zero in on the highest latency event and take action
Here's a glimpse of how you can drill down and identify specific issues:
If you need any help with trying out SigNoz, feel free to mail us at support@signoz.io.
Check out our documentation for more installation guides and troubleshooting instructions.
They say, "If it's not monitored, then it's not in production." And with SigNoz you can start monitoring your Node.js applications now. Enabling your team to resolve issues quickly in production is critical to maintaining complex distributed systems in fine health.
At SigNoz, we are committed to making the best open-source, self-hosted tool for application performance monitoring. Feel free to check out our GitHub repo here:
