Not 3 pillars but a single whole to help customers solve issues faster
Wherever you read about observability, you are told that there are "3 pillars" of observability - Metrics, Traces and Logs.
An image that is generally projected is something like this.
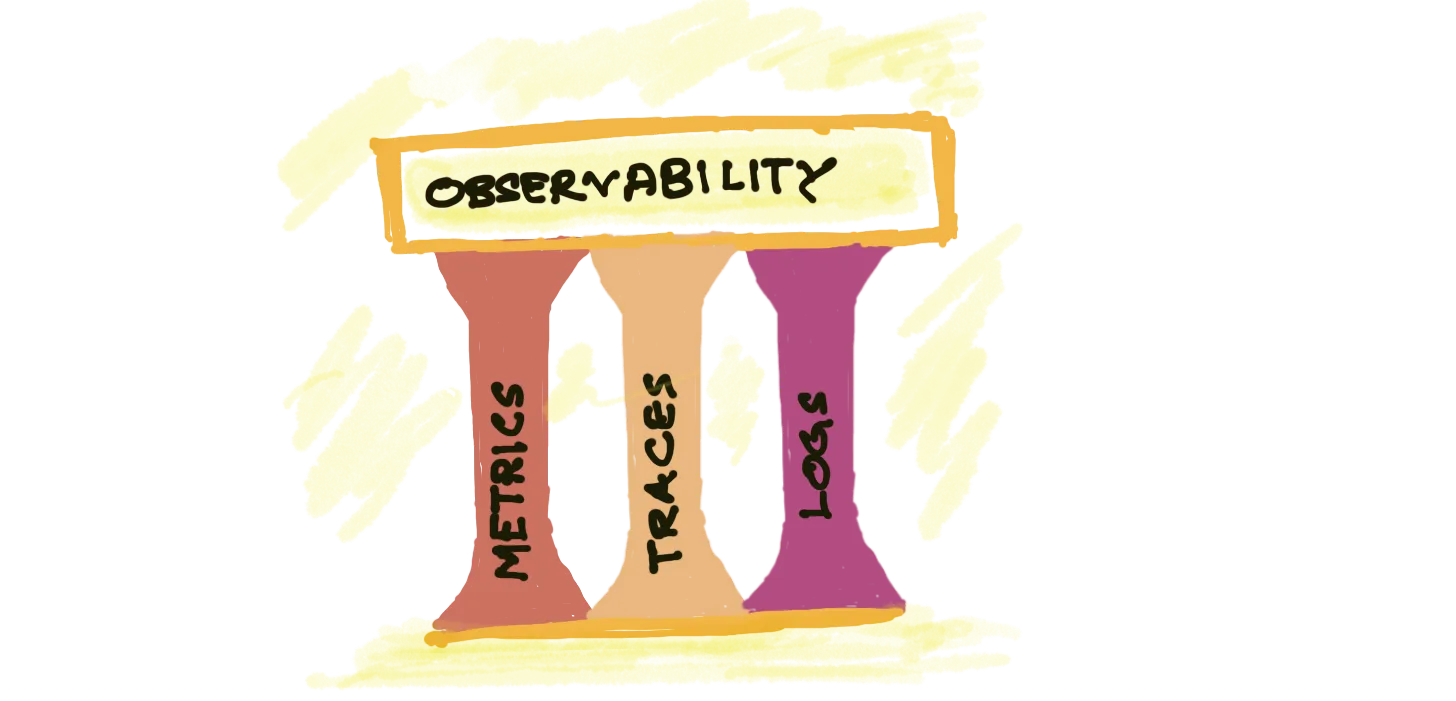
But wait a minute, why are there only three pillars, and does it really matter to the end user? At the end of the day, users are just trying to solve their problems fast.
Let's take a scenario. There's an e-commerce company that has multiple services running in its software stack. Their payment service is throwing errors, and customers are not able to start using their service. The customer success team is breathing down their neck to know when this problem will be resolved. Do you think the engineer is thinking about - "okay, what are the three pillars?" "Let me check pillar 1, pillar 2 and pillar 3 and see what they give me.
My guess is, No
They just care about their problem being solved. And FAST.
Solving customer problems
Like any other tool, an observability tool also solves a problem and one of the main problems it solves is this: if something is going wrong in my applications, can I find what it is and then fix it fast.
In my experience, finding what exactly is wrong is the bulk of the problem.
Is it a DB that is getting slow because of a particular type of query or your machine CPU usage is peaking, causing the service to take a longer time to respond. Or is it a third-party API that suddenly decided to die down on you?
Modern engineering systems are complex and involve many moving components. Finding where things are going wrong is non-trivial. And in our view, solving such complex problems need correlation across different signals.
Okay, so you find in your trace graph that an operation is taking more time. What could be the reason for that - is the VM's CPU getting saturated? Or are there some logs from that service that show that there was a mutex locking problem? You want to see everything in context.
False dichotomy of the three pillars
Talking about metrics, traces and logs as three pillars creates a flase dichotomy in our mind that they are independent things. Though that is entirely not true.
-
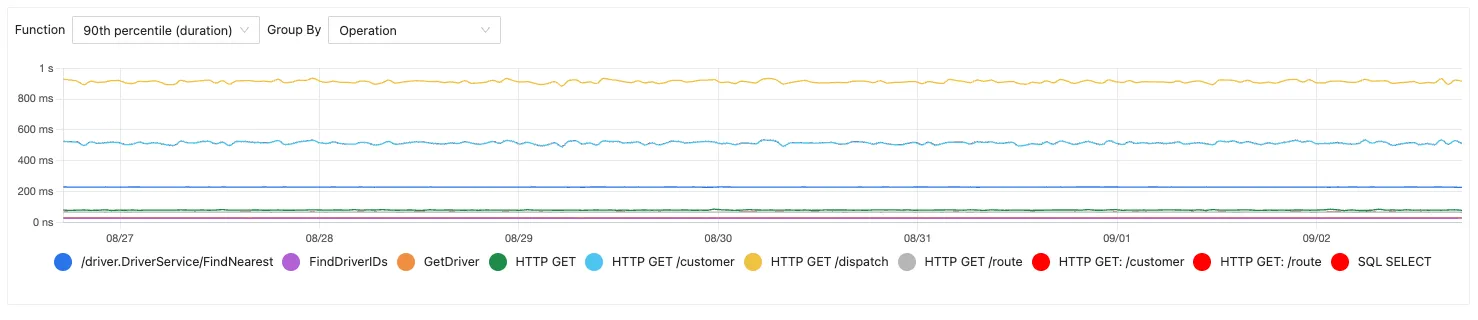
You can create application metrics like latency, error rates, etc. by processing trace span data. For example, SigNoz uses
spansmetricprocessor to create application metrics chart from trace data. -
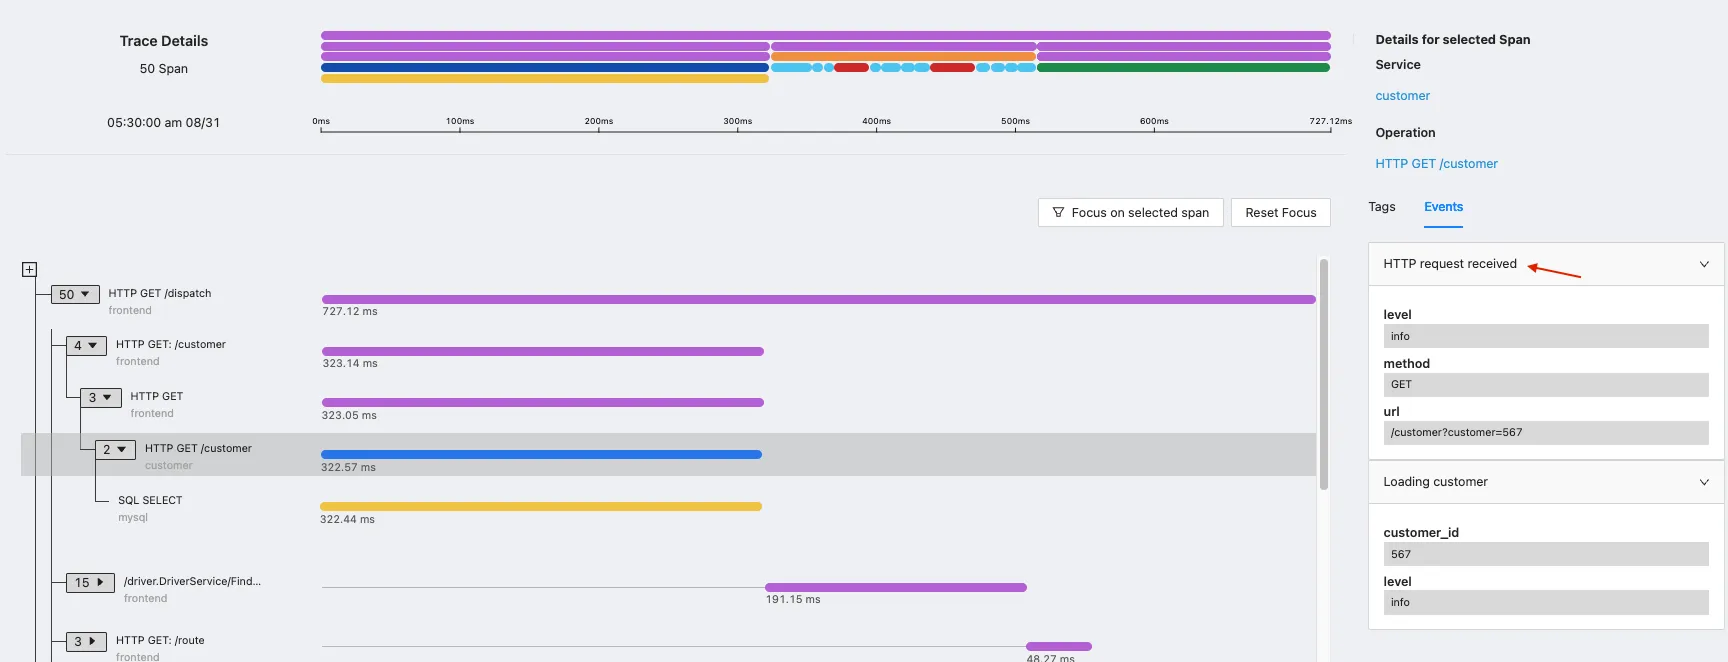
You can add logs and events in traces, which can help you get more context on the specific spans.
-
Logs can be aggregated to create metrics. e.g. using logs data you can create chart of requests which gave
STATUS_CODE=400in the last 1 hr and show it as a graph. -
Trace data can be aggregated to plot granular graphs on count of specific attributes in a time range. e.g. if you have an attribute of
customer_typein your span, you can plot graphs of request made by premium customers by just filtering oncustomer_type=premiumand showing that over a given time range. This would be good example of generating metrics from trace data.
operation nameA better model for observability
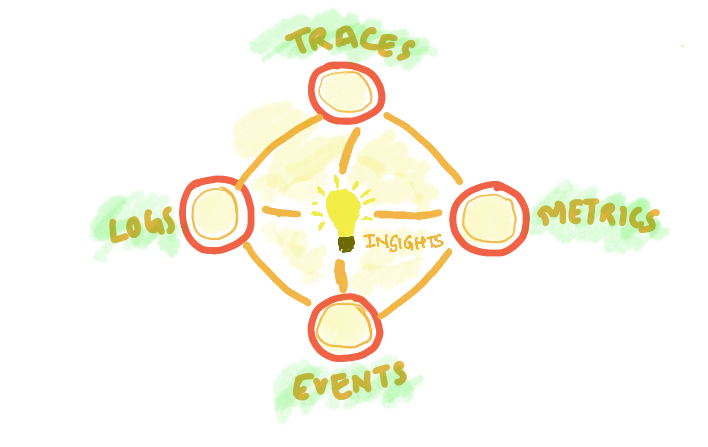
That is why at SigNoz, we don't believe in pillars or silos. There are just different signals which you want to see in a correlated way and in context to figure out what's the problem quickly.
I think an analogy of a mesh or network may be more apt here. Rather than the three silos supporting making up a stack, think of it more as an observability hive mind which can correlate, talk to each other and point you to the source of the problems.
That's why at SigNoz, we have a single underlying datastore that helps you correlate across signals much more seamlessly.
We have chosen columnar databases as our main workhorse as we think observability is fundamentally an analytics and correlation problem. The main need is to find the source of the problem fast. And for this, writing queries on aggregates is very important. You should be able to drill down from a top-level view to a specific question quickly.
For instance, suppose your customer-facing web application is slow, and your product managers are reporting a decrease in conversion across the funnel.
You first want to find which services are showing higher latency than usual. So you go ahead and get p99 latency graphs by service. There you would find that a particular service is showing higher latency. Then you would add some filters around specific APIs or status codes that may be causing this and narrow down on the problem. Now, you have a specific API is seems slower than usual. You go to your traces page for this API and filter for traces that are showing higher latency.
On diving deeper into trace details, you find that the Redis call was taking longer than usual because the machine in which it was hosted was starved on CPU. As you can see, this needs metrics from applications, their detailed traces, and infrastructure metrics like CPU to come together to quickly find the root of the problem.
Single App and Columnar Databases
As you can imagine, finding the culprit would need lots of slicing and dicing, group bys, and counts. Being able to ask questions about your observability data. And this is where columnar databases shine.
Recently, Uber also moved from Elastic to ClickHouse as their database for their logs infra because they found that 60-70% of their logs queries were aggregation queries and columnar databases are designed for such queries and perform much faster.
At SigNoz, we think a lot about how to provide insights faster to users. Our belief is that a single app that has different types of signals and lets you correlate among them is the best way to do this (rather than installing a set of siloed tools and then making them talk to each other and facing all the issues in setting different systems and creating matching data formats)
- Single app for all telemetry signals
- Powerful aggregation and correlation capabilities
Here's a blog by Honeycomb where they talk in detail about why columnar databases are more suited for observability. They focus primarily on tracing and high cardinality, but the point around being able to ask questions from your observability system broadly holds.
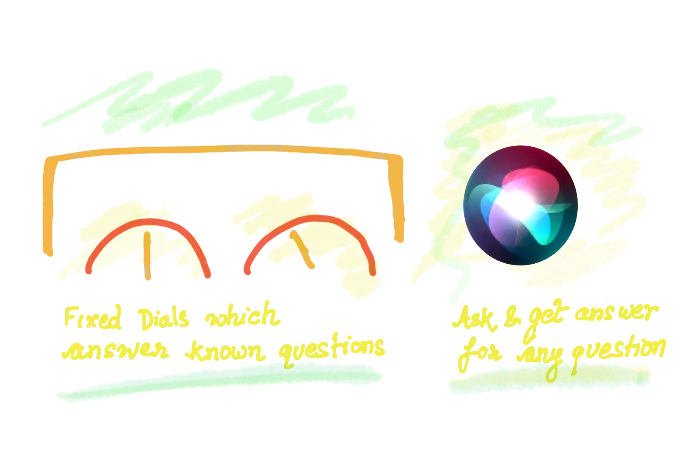
Dashboards or Siri?
Currently, people think of observability systems as a dashboard that they can use to monitor different dials, like while driving a car. But observability tools can be much more powerful. It can answer specific questions you may have about your infrastructure and applications. You should be able to go from a 30,000 ft view to the exact cause of the issue in a few clicks.
Think Siri rather than dashboards. At least, this is what we at SigNoz are building towards.
So, how are your observability systems set up? Would love to hear your battle stories and learn from them. Here's our slack community.
Do come by and say Hi!
