Three Pillars of Observability [And Beyond] - A Beginner's Guide
Observability is often defined in the context of three pillars: logs, metrics, and traces. Modern-day cloud-native applications are complex and dynamic. To avoid surprises and performance issues, you need a robust observability stack. But is observability limited to collecting logs, metrics, and traces? How is observability evolving to make our systems more observable?

In this tutorial, we cover:
- A Brief Overview of Observability
- Metrics
- Traces
- Logs
- Beyond the three pillars - Context
- Data Visualization - The Critical Component in Observability
- Navigating Observability Maturity in Your Organization
- Conclusion
A Brief Overview of Observability
Monitoring tools have been a key part of any enterprise for over 25 years, providing advanced alerts on infrastructure and application issues before they affect customers. As the years progressed, we increased the number of metrics in our monitoring systems for a better understanding of the systems being monitored.
However, as software systems have become more complex, relying solely on metrics for monitoring has its limitations. It often fails to identify unknown variables that could lead to digital experience issues, impacting end-users.
Recently, the concept of 'Observability' has emerged in the industry, marking a shift from traditional monitoring. Unlike the latter, which focuses on predefined metrics, observability emphasizes understanding a system's state at any given time, including both leading and trailing Service Level Indicators. This approach allows for real-time insights into performance problems or errors without being confined to specific metrics. For instance, using an observability tool like SigNoz to trace a web request reveals the entire journey and internal operations of the request, providing a more comprehensive view than just measuring server response times. It includes the details of the work being completed (methods, classes, database queries) in the context of a particular request.
The three pillars of observability are:
- Logs: Detailed records of events within your system
- Metrics: Numerical representations of data measured over time
- Traces: Records of the path of a request through a distributed system
Metrics
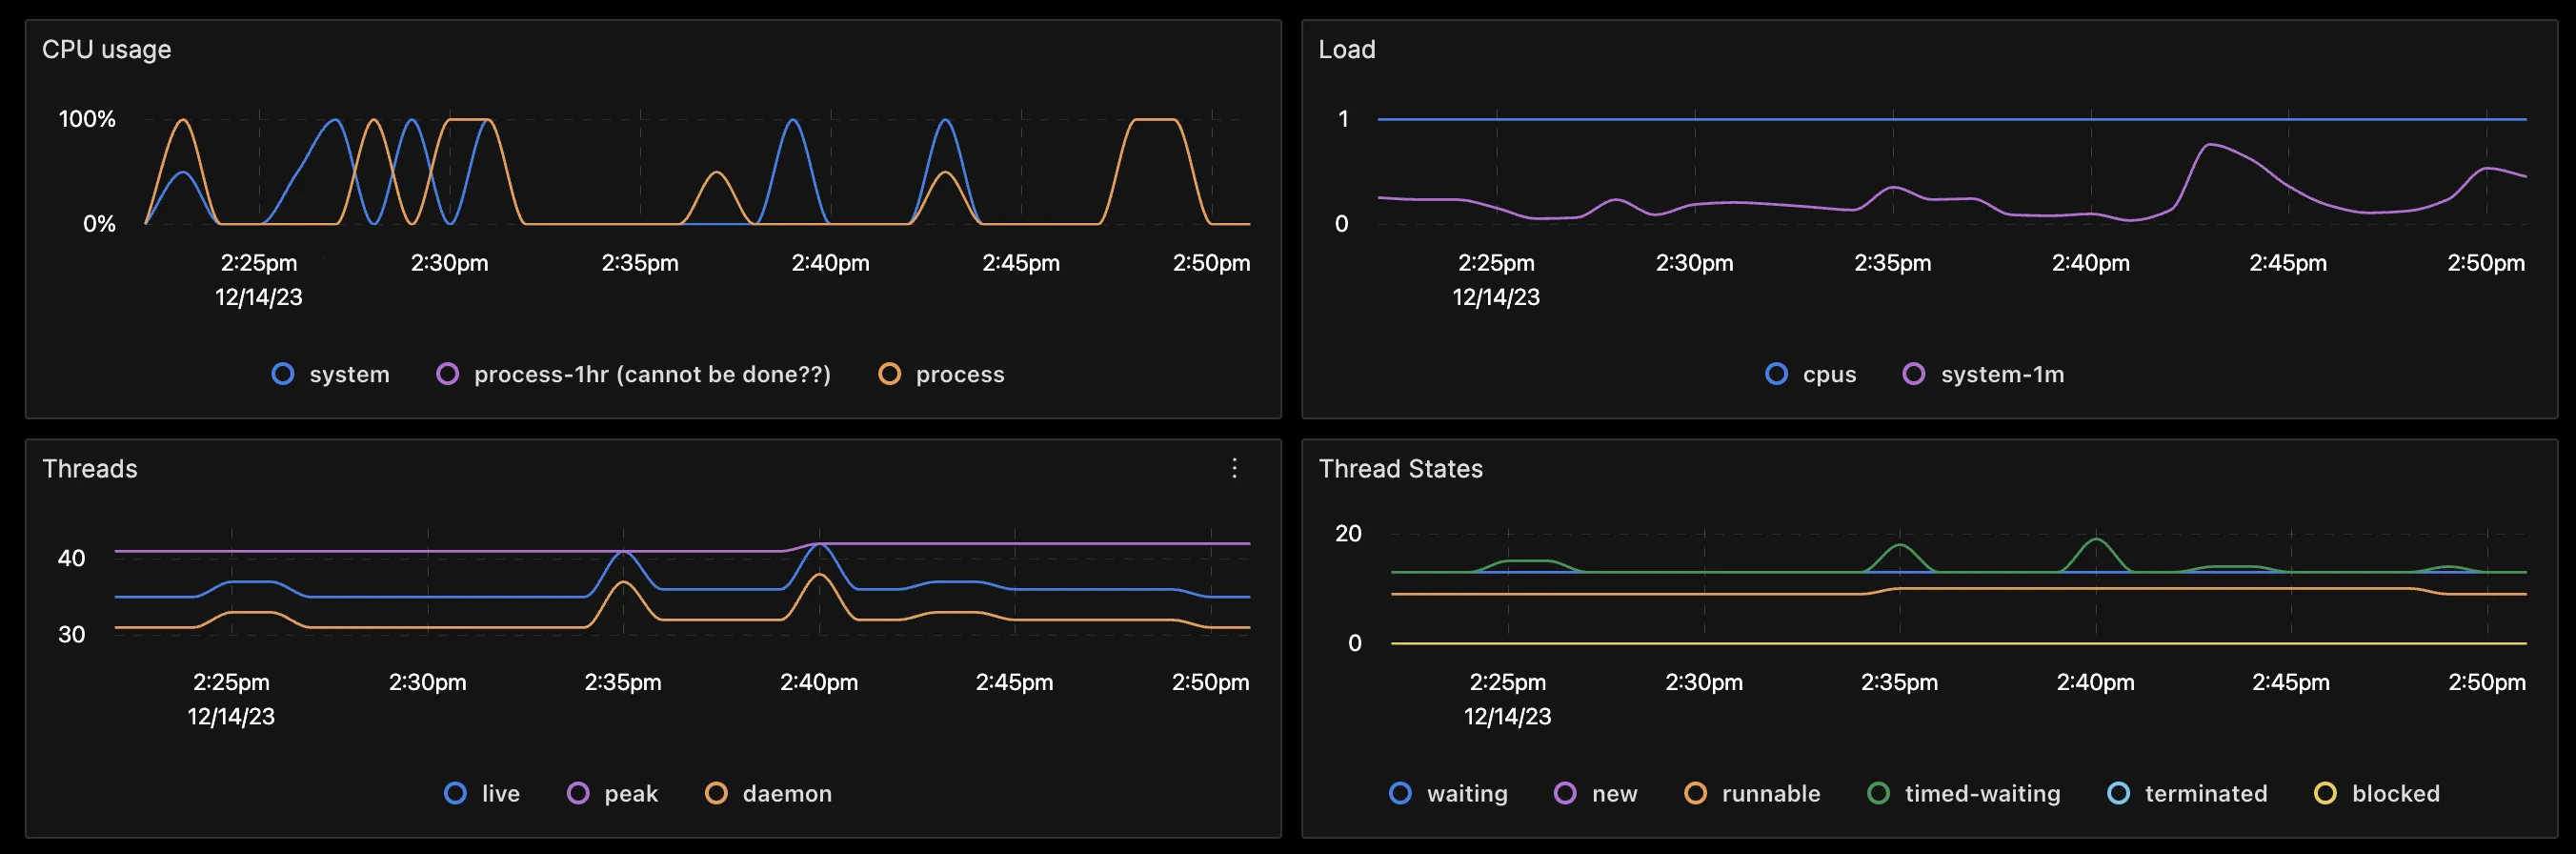
When examining metrics, they typically represent the state of a specific measure at a given moment. This is crucial for understanding changes over time, as seen in time-series graphs like CPU utilization.
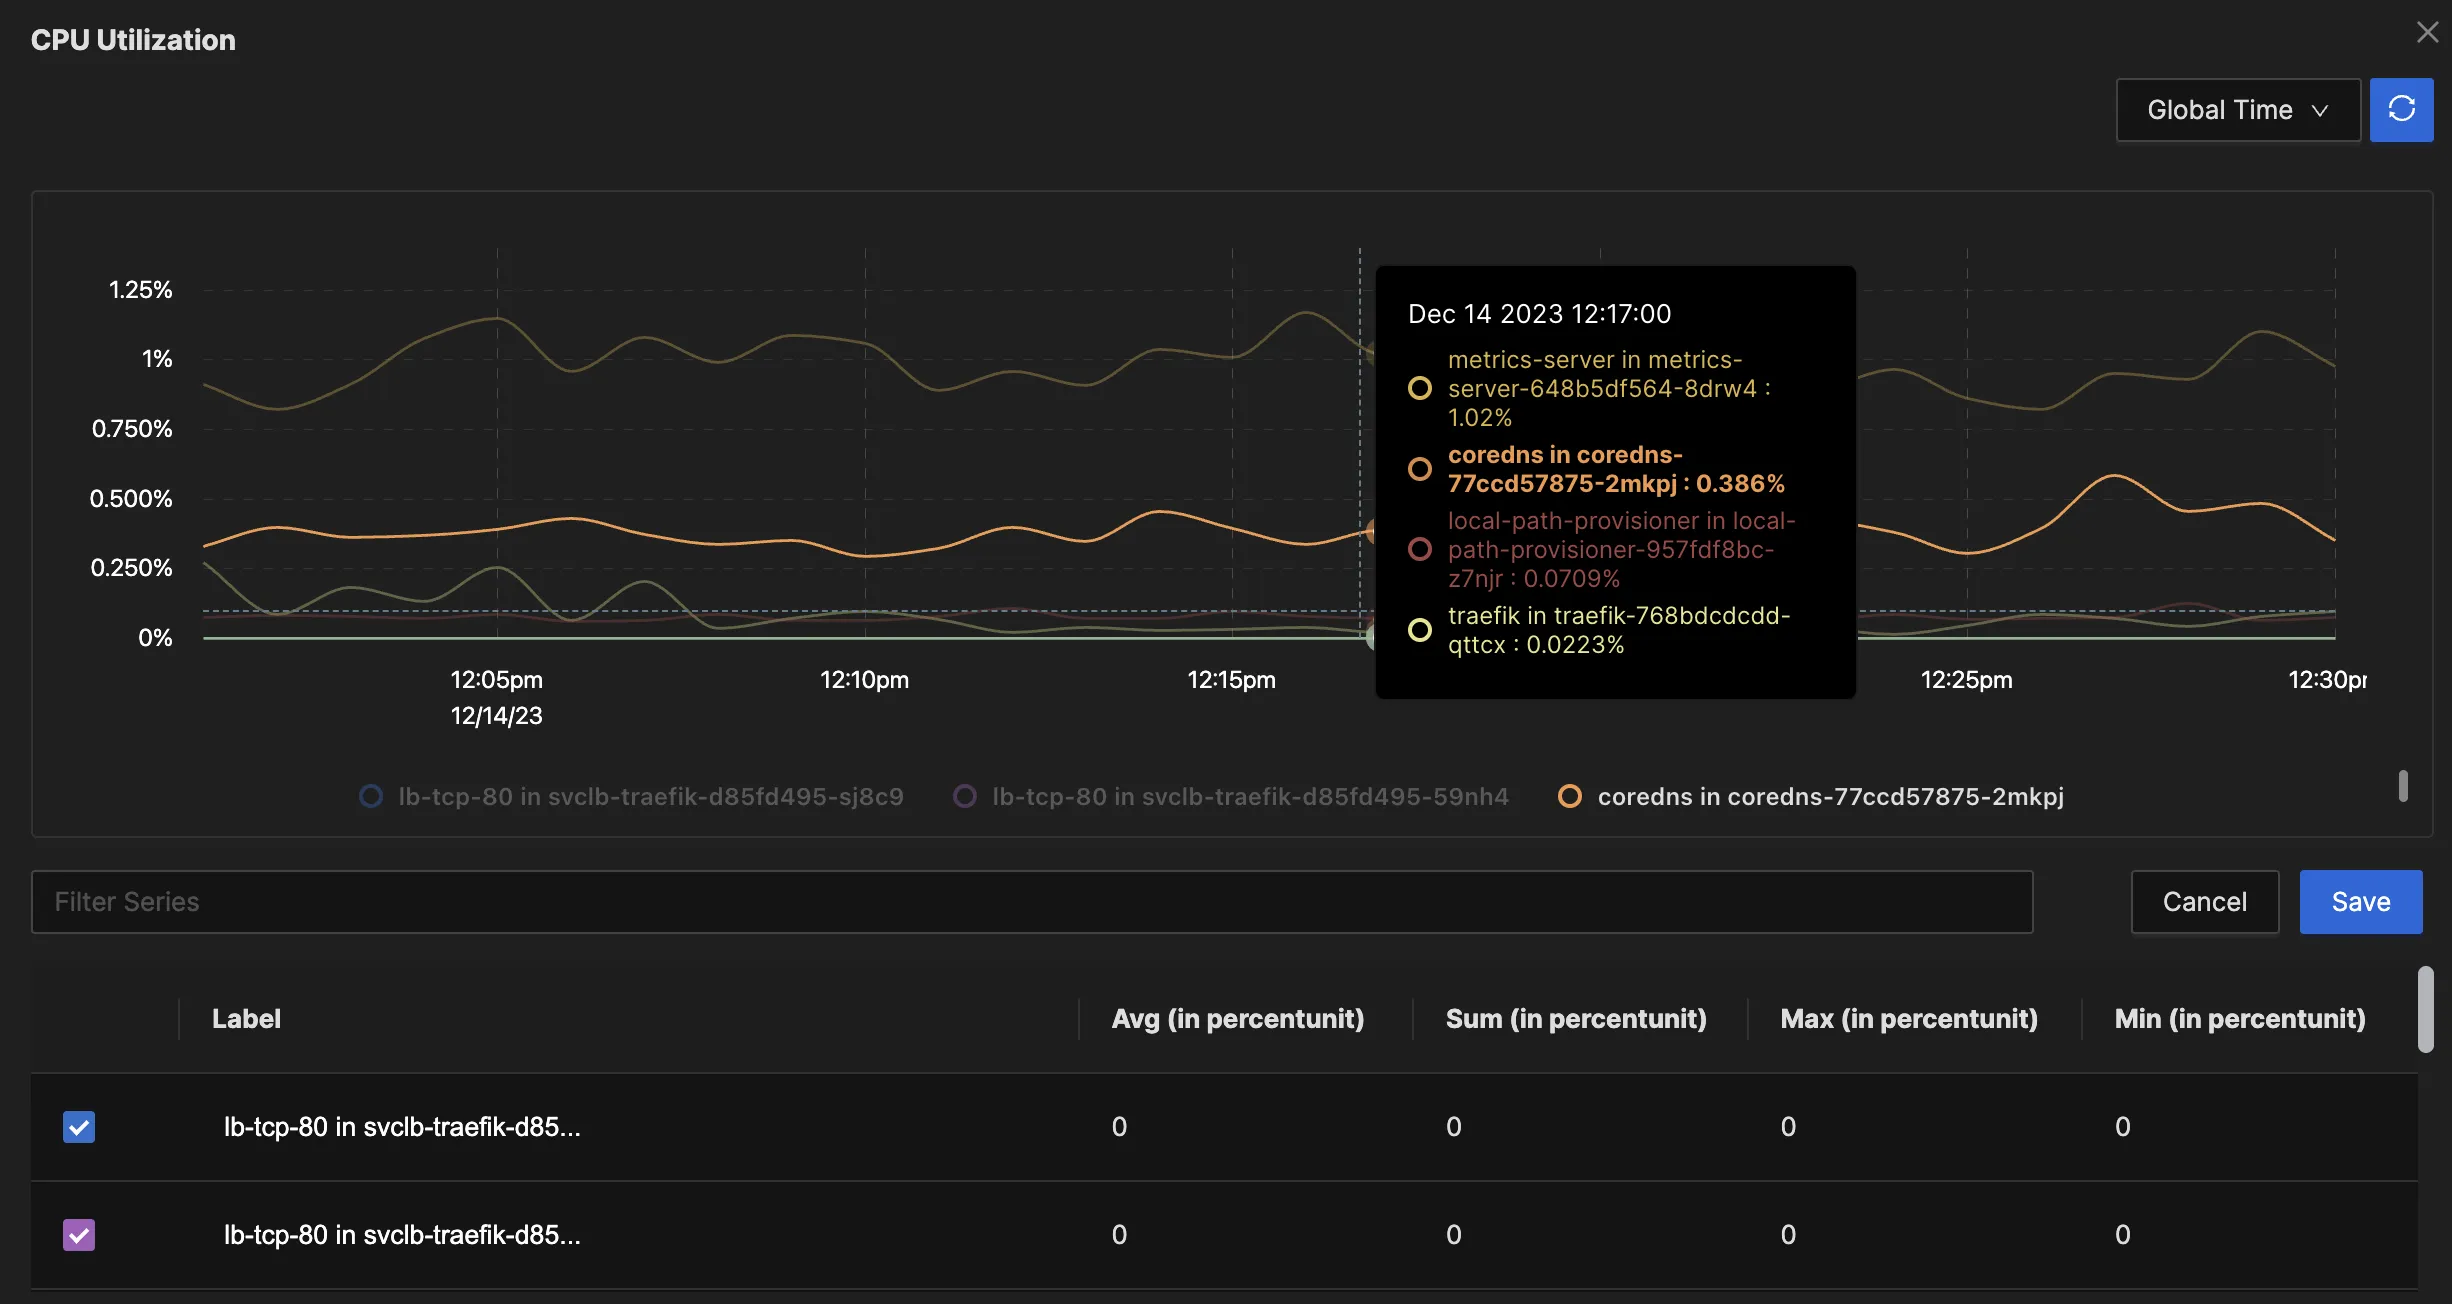
Time series graphs were popularised by one of the oldest monitoring tools, called MRTG (Multi-Router Traffic Grapher). MRTG would typically collect data every 5 minutes using SNMP (Simple Network Monitoring Protocol) to graph the utilization of router interfaces. SNMP was then popularised on Linux (and even MS Windows) to collect all kinds of metrics in regular polling intervals. SNMP is still popular but less preferred over newer methods such as agent-based monitoring (including the OTEL Collector), REST APIs, and streaming telemetry.
Two popular types of metrics are related to utilization and saturation. Utilization metrics indicate the percentage of a resource in use, such as CPU and memory utilization or the usage of application server worker threads. Meanwhile, saturation metrics reflect the degree of contention for a resource. For example, a disk queue length indicates the excess workload beyond the disk's processing capacity in a given interval. Here, while utilization might show 100%, saturation reveals the pending workload exceeding the system’s processing ability.
Key Types of Metrics
- Counters: Cumulative measurements that only increase (e.g., total number of requests)
- Gauges: Measurements that can increase or decrease (e.g., current CPU usage)
- Histograms: Distributions of values over time (e.g., request duration)
Importance of Time-Series Data in Metric Analysis
Time-series data allows you to:
- Track trends and patterns over time
- Detect anomalies and sudden changes in system behavior
- Forecast future resource needs based on historical data
Strategies for Effective Metric Collection and Aggregation
- Choose relevant metrics: Focus on metrics that directly relate to your system's performance and business goals.
- Use a consistent naming convention: Adopt a standardized approach to naming metrics for easier querying and analysis.
- Set appropriate collection intervals: Balance granularity with storage and processing requirements.
- Implement aggregation: Use techniques like percentiles and averages to summarize high-cardinality data.
Implementing Effective Metric Monitoring
- Set up dashboards: Create visual representations of key metrics for at-a-glance system health checks.
- Configure alerts: Establish thresholds for critical metrics and set up notifications for when they're breached.
- Use anomaly detection: Implement algorithms to identify unusual patterns in your metric data automatically.
Traces
Traces offer insights into events over time. In the context of APM and OpenTelemetry, this usually involves embedding libraries into the code or using a profiler/agent to profile applications and runtimes. For an example of integrating Spring Boot with OpenTelemetry and SigNoz for all three pillars of observability, refer to my article on Spring Boot Monitoring.
A typical example of a trace is an HTTP request to a web front end, involving multiple tasks to complete and return a response. Consider an HTTP POST request to add a new pet to an owner's profile. This request encompasses 25 units of work (Spans), each containing detailed attributes about the unit of work, SQL statements, thread IDs, and service details.
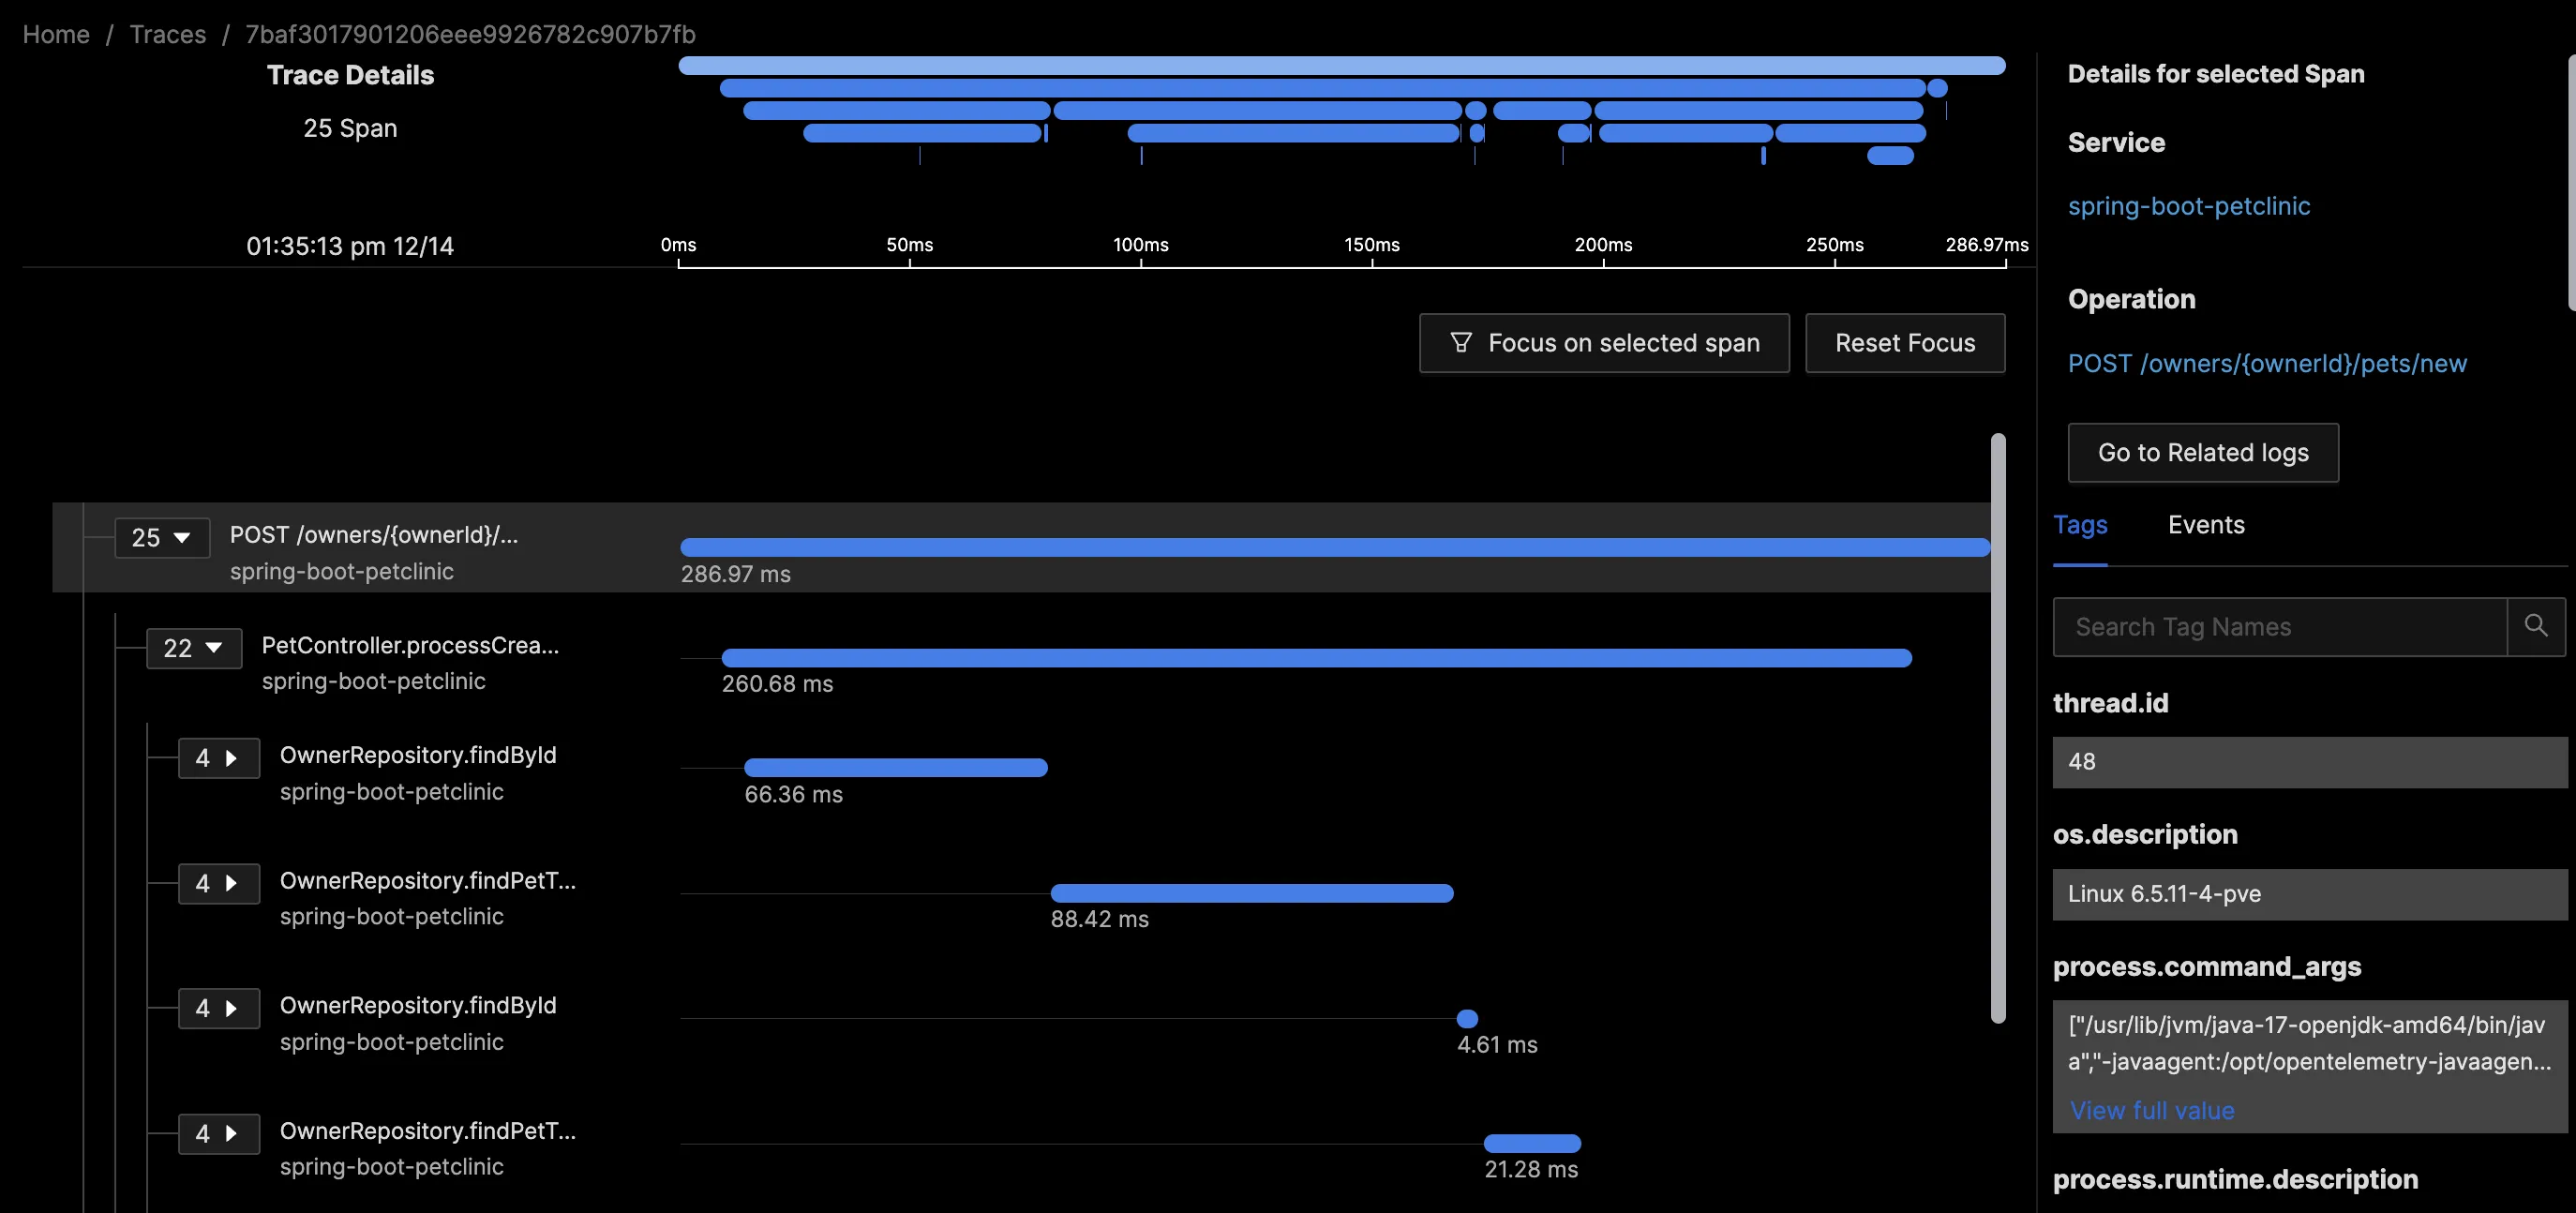
While some of this information can be derived from logs, a trace presents these units of work in a contextual and standardized format. Trace visualization like Flamegraphs and Gantt charts make it easy to visualize an entire request as it traverses different components in a complex distributed setup. This approach eliminates the need to comb through multiple servers, containers, and log files to track an individual request, thereby saving hours of work.
Components of a Trace
- Spans: Individual units of work within a trace, representing operations in different services
- Context propagation: The mechanism for passing trace information between services
Benefits of Tracing in Microservices Architectures
- Identify performance bottlenecks across service boundaries
- Understand dependencies between services
- Debug complex, distributed transactions
Implementing Tracing in Your Application Stack
- Choose a tracing framework: Options include OpenTelemetry, Jaeger, and Zipkin.
- Instrument your code: Add tracing calls to your application code to generate spans.
- Propagate context: Ensure trace context is passed between services in headers or message properties.
- Visualize and analyze: Use a tracing backend like SigNoz to collect, store, and visualize your trace data.
Advanced Tracing Techniques
- Correlate traces with logs and metrics: Link trace IDs to log entries and metric data points for a holistic view of system behavior.
- Analyze performance bottlenecks: Use flame graphs and waterfall diagrams to visualize request latency across services.
- Implement sampling: For high-volume systems, collect a representative sample of traces to reduce storage and processing requirements.
Logs
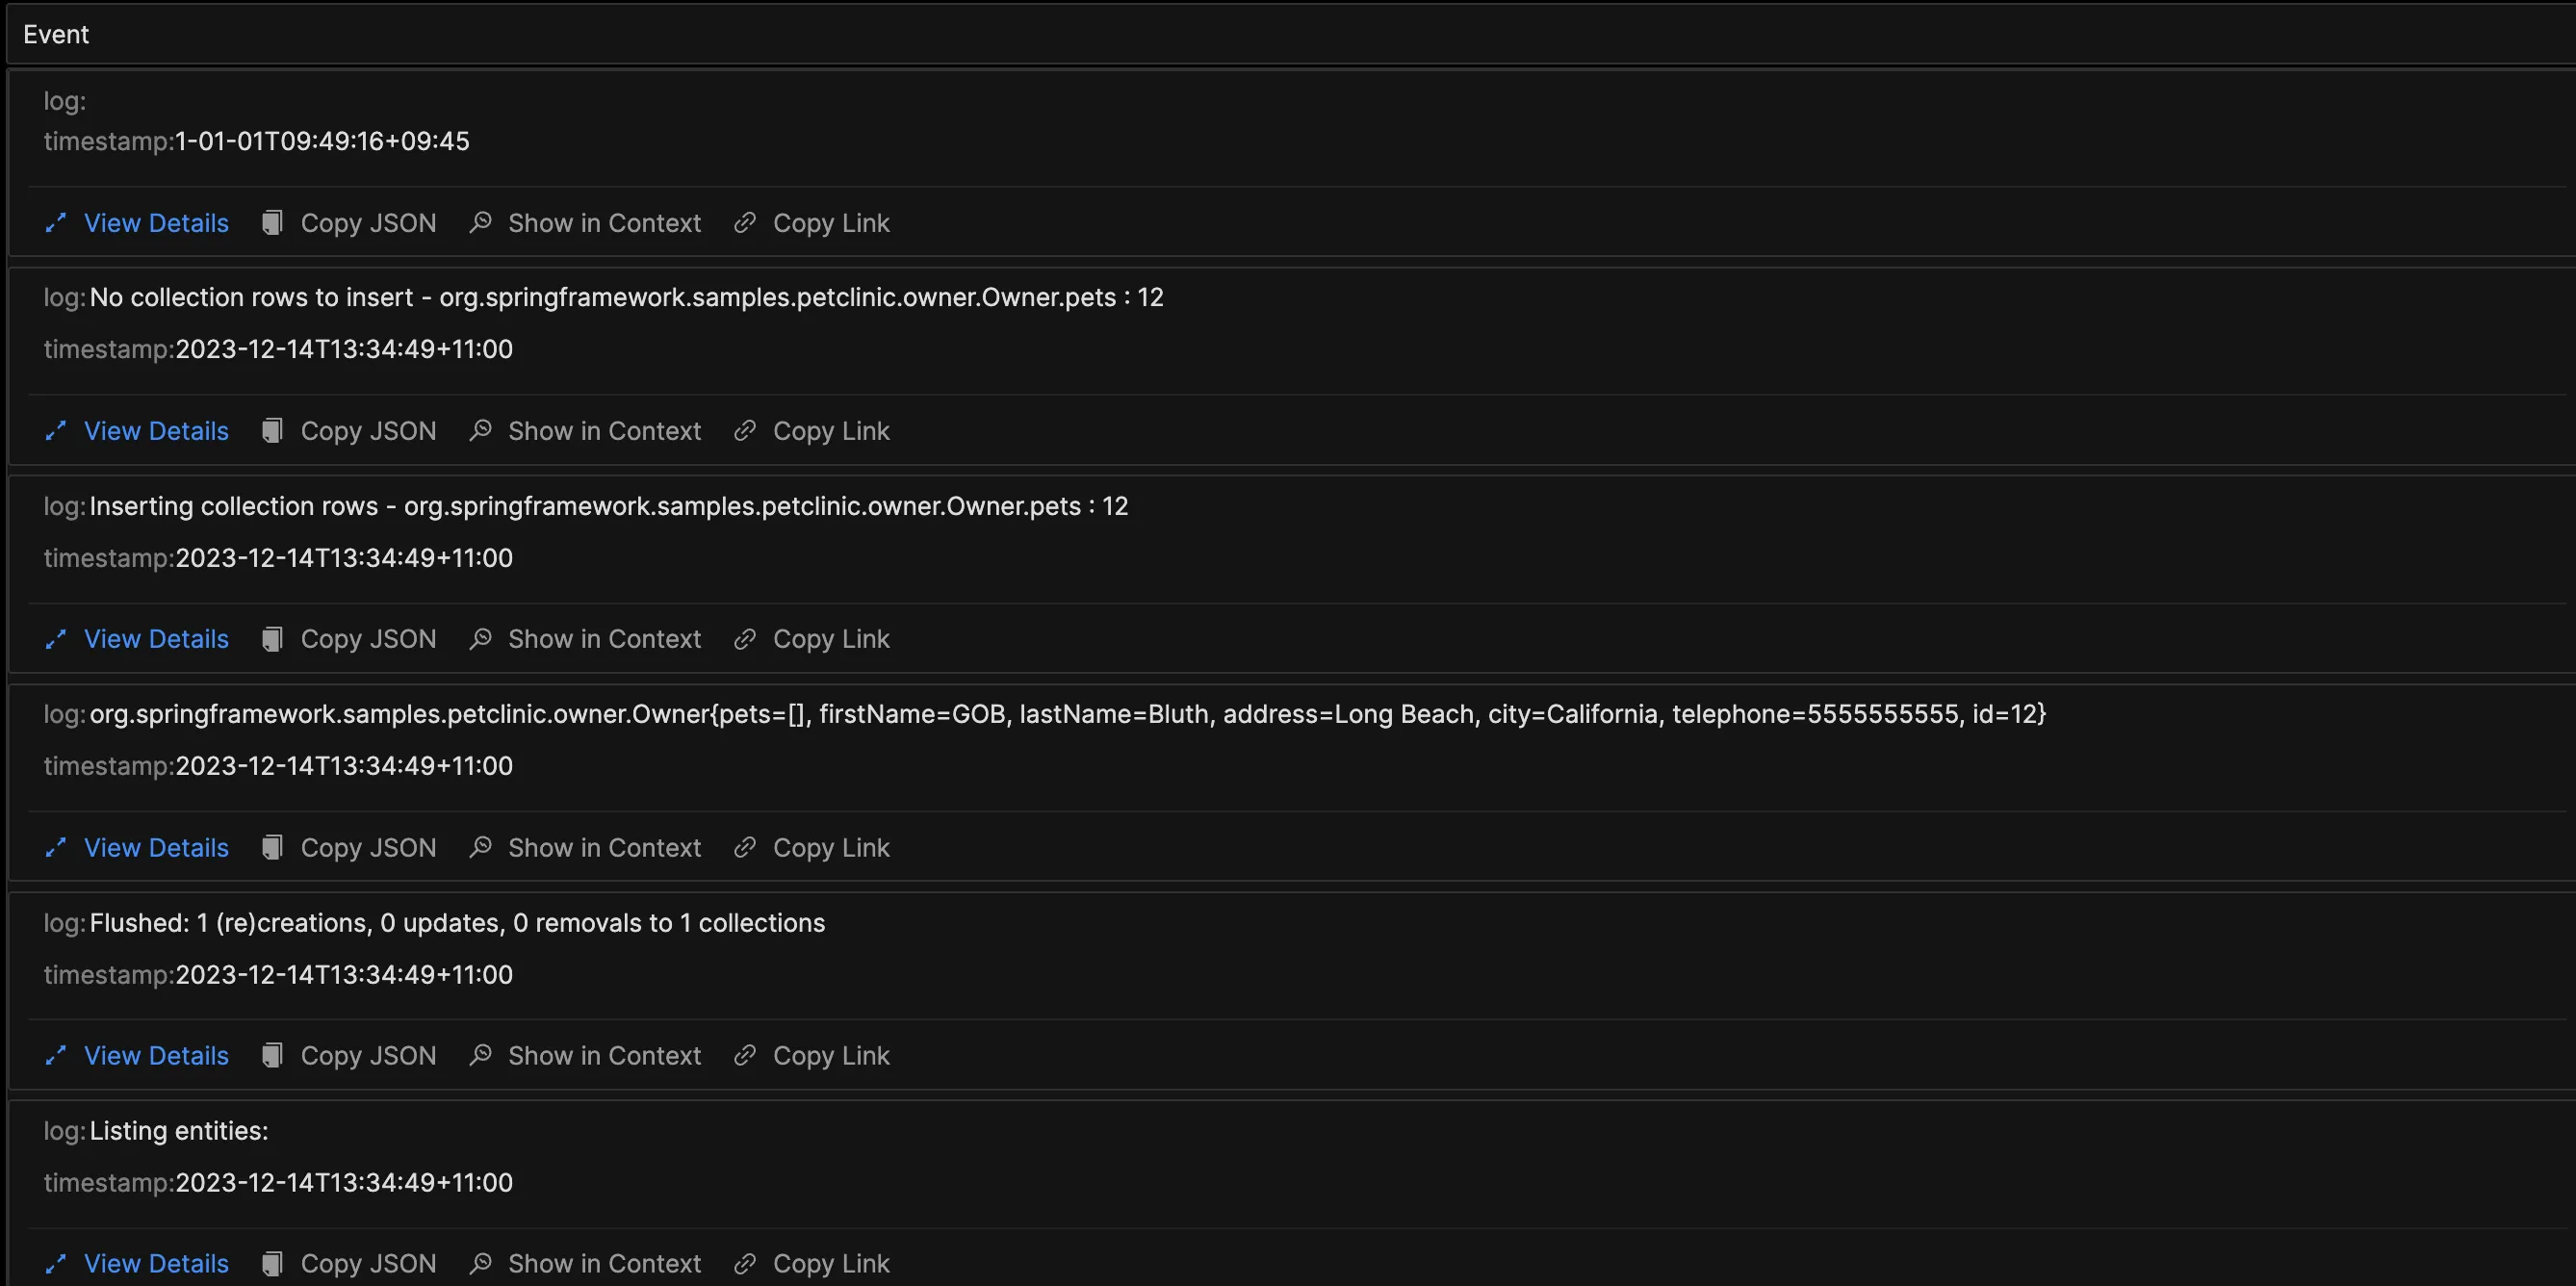
Logs, the oldest of the three observability pillars, have evolved from basic ‘print’ statements to sophisticated, structured formats. While their inherent flexibility and unstructured nature originally made analysis challenging, modern logging libraries, frameworks, and standards have significantly improved their usability. Tools like SigNoz provide log pipelines to transform logs to suit your querying and aggregation needs.
Types of Information Captured in Logs
- Error messages and stack traces
- Application state changes
- User actions and system events
- Detailed transaction information
Best Practices for Log Collection and Management
- Implement structured logging: Use a consistent format (e.g., JSON) to make logs easier to parse and analyze.
- Include contextual information: Add relevant details like user IDs, request IDs, and environment information to each log entry.
- Use log levels appropriately: Categorize logs as DEBUG, INFO, WARN, or ERROR to facilitate filtering and analysis.
- Centralize log storage: Aggregate logs from all components of your distributed system in a central location for easier access and analysis.
Tools and Techniques for Effective Log Analysis
- SigNoz, ELK Stack for log aggregation and visualization
- Grep and awk for command-line log analysis
- Machine learning algorithms for anomaly detection in log data
Challenges and Limitations of Logs
- High volume: Systems can generate enormous amounts of log data, making storage and analysis challenging.
- Unstructured data: Free-form log messages can be difficult to parse and analyze systematically.
- Consistency: Ensuring consistent logging practices across distributed systems and teams can be challenging.
- Performance impact: Excessive logging can impact system performance, requiring a balance between verbosity and efficiency.
Enhancing Logs with Context
Frameworks like Logback and Log4J have streamlined the modification of logs for easy consumption by OpenTelemetry and SigNoz, eliminating the need for a separate logging pipeline. For example, Logback's structured fields, attributes, and values can be queried by SigNoz to filter irrelevant data or isolate logs related to specific trace or span IDs.
Beyond the three pillars - Context
Observability has evolved from just the collection and analysis of three pillars of observability - logs, metrics, and traces. “Context” is increasingly recognized as a crucial component in debugging complex distributed systems, complementing the traditional three pillars: metrics, logs, and traces.
Context can be termed as the fourth pillar of observability - correlating different signals and providing more information to the three pillars of observability.
The Role of Context in Observability
In troubleshooting, context is key. It connects disparate pieces of information from metrics, logs, and traces. This interconnectedness helps in quickly pinpointing issues, understanding their impact, and devising more effective solutions.
Integrating context with three pillars of observability:
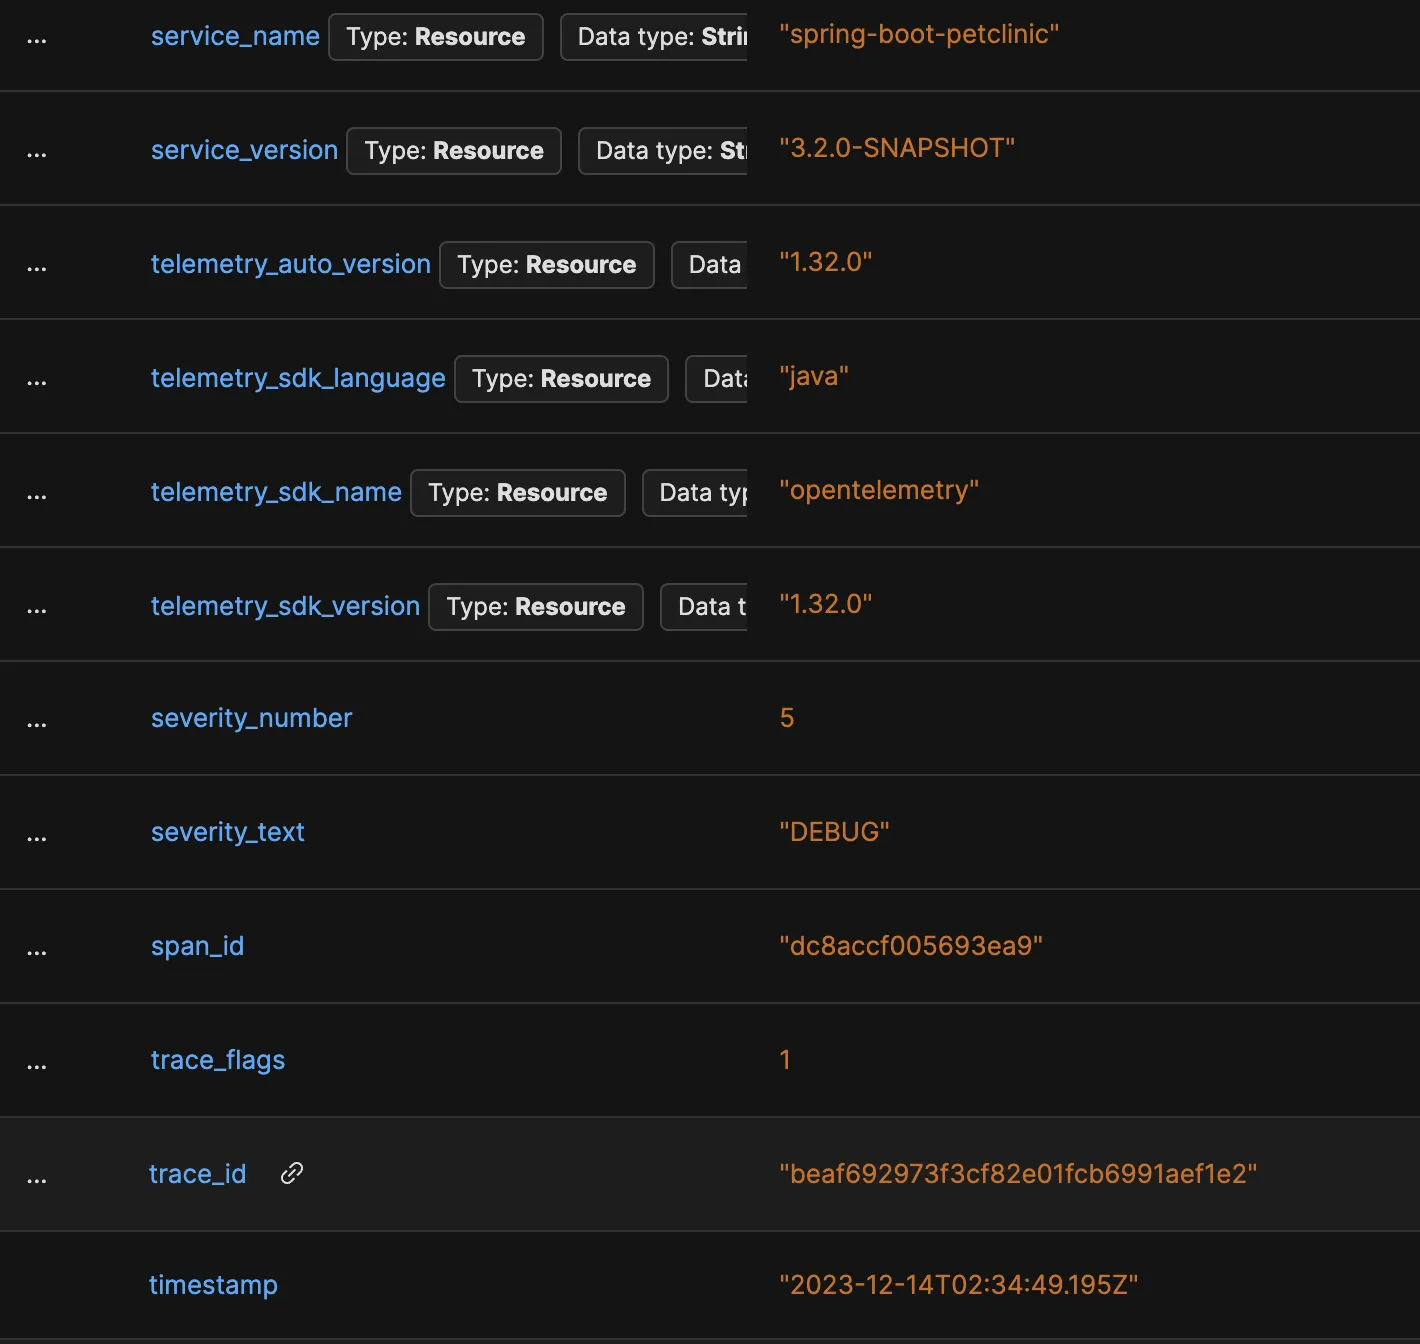
- Correlated Logs and Traces: Logs and traces can be correlated by injecting trace and span identifiers. Use the traces to understand the flow of the problematic request and identify where in the journey the issue occurred. Then, delve into the logs for those specific spans or services to gain detailed insights into what went wrong.
- Metrics with Context: Instead of just quantitative data, metrics become more meaningful when combined with context. For instance, a spike in resource usage is more informative when you know which deployment or change triggered it.
The future of Observability is trending towards leveraging AI for rapid data interpretation based on learned patterns to prioritize critical information for SRE and Observability teams while filtering out less essential data. This approach streamlines the focus on the most impactful issues. Furthermore, AI's role extends to automating routine responses to standard events, such as collecting relevant debugging information and restarting services. This automation minimizes the need for human intervention in restoring services, allowing teams to concentrate on Root Cause Analysis (RCA) and preventative strategies.
Data Visualization - The Critical Component in Observability
Visualization is key in Observability, enabling the transformation of data into a story that's accessible to various audiences. Dashboards should convey essential information to users of all technical levels and subject matter expertise, not just experts.
One of the biggest challenges organizations struggle with is creating dashboards that display every possible piece of information in a single view. If a dashboard needs to be read to understand it, then it is not a dashboard; it is a report.
Making Dashboards Consumable
Effective dashboards require empathy for the intended audience. For example, an executive probably only wants to know if a service is available and performant, therefore a traffic light may be all that is needed. In contrast, a service owner might benefit from more detailed metrics, such as user count, average performance, and p95 and p99 values, to identify outliers.
“Key to effective dashboards: simplicity, readability, and user-centric design."
Navigating Observability Maturity in Your Organization
Maturity indexes are an efficient way to baseline our applications and services and understand what can be done to reduce the risk of a degraded digital experience. To gauge maturity, we must evaluate the people, processes, and technology associated with a service.
Starting with people, assess the team’s observability skills and the organization's commitment to embedding observability practices.
Processes should reduce reliance on specific individuals, enhancing business or service resilience. For example, a service degradation plan might outline steps to gather information from the three pillars during a transient event.
Technology involves more than just tools; it's about using them to adequately instrument services. For an illustration, consider the article on Spring boot monitoring, which discusses instrumentation using the three pillars.
For each of these elements, we would apply a current state vs. a desired state using the maturity index to help us focus on which services need investment.
A Better Way to Look at Observability
While logs, metrics, and traces are indeed crucial components of observability, thinking of them as isolated pillars can create a false dichotomy. In reality, these signals are deeply interconnected:
- Application metrics can be derived from trace span data.
- Logs and events can be embedded within traces for added context.
- Log data can be aggregated to create meaningful metrics.
- Trace data can be used to generate granular, attribute-based metrics.

At SigNoz, we envision observability as a mesh or network rather than a set of pillars. This interconnected approach allows for more powerful correlations and faster problem-solving.
Implementing Observability with SigNoz
SigNoz is an open-source observability platform that integrates all three pillars of observability into a single, cohesive solution.
How SigNoz Integrates the Three Pillars of Observability
- Unified data collection: SigNoz uses OpenTelemetry to collect logs, metrics, and traces in a standardized format.
- Correlated analysis: The platform allows you to navigate seamlessly between different types of observability data.
- Advanced visualization: SigNoz provides powerful dashboards and tools for analyzing your observability data.
Getting Started with SigNoz
SigNoz Cloud is the easiest way to run SigNoz. Sign up for a free account and get 30 days of unlimited access to all features.

You can also install and self-host SigNoz yourself since it is open-source. With 24,000+ GitHub stars, open-source SigNoz is loved by developers. Find the instructions to self-host SigNoz.
Benefits of Using SigNoz for End-to-End Observability
- Open-source and self-hosted, giving you full control over your data
- Cost-effective alternative to proprietary observability platforms
- Active community support and regular updates
- Seamless integration with popular programming languages and frameworks
Conclusion
We presented a comprehensive view of the evolving landscape of observability in modern cloud-native applications. It moves beyond the traditional scope of monitoring, highlighting how observability has become more dynamic and interconnected with the inclusion of context as a fourth pillar. The future of observability is seen as increasingly reliant on AI and effective data visualization to make complex data understandable and actionable.
For organizations looking to enhance their digital experience and system reliability, embracing these evolving aspects of observability is crucial. The key is to integrate these practices into their operational culture, ensuring a robust, responsive, and resilient technological ecosystem.
FAQs
What's the difference between monitoring and observability?
Monitoring focuses on tracking predefined sets of metrics and logs to understand system health. Observability goes a step further by providing the context and tools to ask arbitrary questions about your system's behavior, even for unforeseen issues.
How do I choose which metrics to track for my application?
Start with the four golden signals of monitoring: latency, traffic, errors, and saturation. Then, add metrics specific to your application's business logic and performance characteristics. Regularly review and refine your metrics based on your evolving needs and insights.
Can observability help with proactive problem-solving?
Yes, observability can help identify potential issues before they become critical problems. By analyzing trends in your metrics, logs, and traces, you can spot emerging patterns that might indicate future problems and take preventive action.
What are some common challenges in implementing observability?
Common challenges include:
- Data volume management
- Ensuring data consistency across distributed systems
- Balancing observability with system performance
- Integrating observability into existing workflows and tools
- Training teams to effectively use observability data for troubleshooting and optimization
What are the three pillars of observability?
The three traditional pillars of observability are metrics, traces, and logs. These components work together to provide a comprehensive view of a system's health and performance.
How does observability differ from traditional monitoring?
Observability goes beyond traditional monitoring by focusing on understanding a system's state at any given time, including both leading and trailing Service Level Indicators. It allows for real-time insights into performance problems or errors without being confined to specific predefined metrics.
What is the role of context in observability?
Context is increasingly recognized as a crucial component in observability, often referred to as the fourth pillar. It helps correlate different signals (metrics, logs, and traces) and provides additional information to enhance debugging and troubleshooting in complex distributed systems.
How do traces contribute to observability?
Traces offer insights into events over time, typically involving embedded libraries in the code or using profilers/agents. They provide a detailed view of a request as it traverses different components in a complex distributed setup, making it easier to visualize and understand the flow of work.
What is the future of observability?
The future of observability is trending towards leveraging AI for rapid data interpretation based on learned patterns. This approach aims to prioritize critical information for SRE and Observability teams while filtering out less essential data, streamlining the focus on the most impactful issues.
How important is data visualization in observability?
Data visualization is a critical component in observability. It enables the transformation of complex data into accessible stories for various audiences. Effective dashboards should convey essential information to users of all technical levels, focusing on simplicity, readability, and user-centric design.
What is an observability maturity index?
An observability maturity index is a tool used to baseline applications and services and understand what can be done to reduce the risk of a degraded digital experience. It evaluates the people, processes, and technology associated with a service to gauge the organization's observability practices and identify areas for improvement.
Further Reading
